Transforming Data Streams with Kafka Connect: An Introduction to Single Messa...
Lab # 06
1. Advance Software Engineering LAB # 06
LAB # 06
OBJECTIVE:
• Creating Sequence Diagrams.
Sequence Diagrams
A sequence diagram shows object interactions arranged in time sequence. It depicts the objects
and classes involved in the scenario and the sequence of messages exchanged between the
objects needed to carry out the functionality of the scenario. Sequence diagrams typically are
associated with use case realizations in the Logical View of the system under development. In
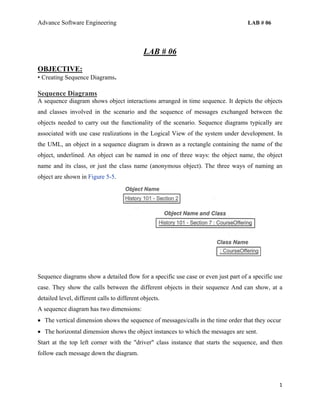
the UML, an object in a sequence diagram is drawn as a rectangle containing the name of the
object, underlined. An object can be named in one of three ways: the object name, the object
name and its class, or just the class name (anonymous object). The three ways of naming an
object are shown in Figure 5-5.
Sequence diagrams show a detailed flow for a specific use case or even just part of a specific use
case. They show the calls between the different objects in their sequence And can show, at a
detailed level, different calls to different objects.
A sequence diagram has two dimensions:
• The vertical dimension shows the sequence of messages/calls in the time order that they occur
• The horizontal dimension shows the object instances to which the messages are sent.
Start at the top left corner with the "driver" class instance that starts the sequence, and then
follow each message down the diagram.
1
2. Advance Software Engineering LAB # 06
The UML notation for objects and messages in a sequence diagram is shown in Figure 5.6.
1. Right-click to select the use case realization in the Logical View of the browser and make the
shortcut menu visible.
2. Select the New: Sequence Diagram menu choice. An unnamed sequence diagram is added to
the browser.
3. Double-click on the sequence diagram in the browser to open the diagram.
2. Click to select the actor in the browser.
3. Drag the actor onto the sequence diagram.
4. Click to select the Object icon from the toolbar.
5. Click on the sequence diagram window to place the object.
6. While the object is still selected, enter the name of the object.
7. Repeat the preceding steps for each object and actor in the scenario.
8. Click to select the Object Message icon from the toolbar.
9. Click on the actor or object sending the message and drag the message line to the actor or
object receiving the message.
10. While the message line is still selected, enter the name of the message.
11. Repeat steps 7 through 9 for each message in the scenario.
2
3. Advance Software Engineering LAB # 06
Sequence Diagrams And Boundary Classes
Boundary classes are added to sequence diagrams to show the interaction with the user or
another system. In the early analysis phases, the purpose of showing boundary classes on a
sequence diagram is to capture and document the interface requirements, not to show how the
interface will be implemented.
Complexity And Sequence Diagrams
Every time I teach a class, the question "How complex can a sequence diagram be?" is always
asked. The answer I always give is "Keep them simple." The beauty of these diagrams is their
simplicity—it is very easy to see the objects, the object interactions, the messages between the
objects, and the functionality captured by the scenario. The next question is usually "What do I
do about conditional logic?" (all the if, then, else logic that exists in the real world). Here, you
again have a very subjective answer. If the logic is simple, involving only a few messages, I
usually add the logic to one diagram and use notes and scripts to communicate the choices to be
made. On the other hand, if the if, then, else logic involves many complicated messages, I
typically draw a separate diagram—one for the if case, one for the then case, and one for the else
case. This is done to keep the diagrams simple. If you desire, diagrams may be linked to one
another. This allows the user to navigate through a set of diagrams.
3
4. Advance Software Engineering LAB # 06
NOTE
1. Select the Note icon from the toolbar.
2. Click on the diagram to place the note.
3. Select the diagram that you wish to link in the browser and drag the diagram onto the note.
4. To navigate to the linked diagram, double-click on the note.
Call Message
Definition
A message defines a particular communication between Lifelines of an Interaction. Call
message is a kind of message that represents an invocation of operation of target lifeline.
Properties
Name The name of message.
Action Type Type action type of the message.
Return Value The information to return to caller.
Sequence No. The number of message indicates the order of message within an interaction.
Documentation Description of message.
Asynchronous Determines whether the message is an asynchronous or a synchronous message.
Recursive Message
Definition
A message defines a particular communication between Lifelines of an Interaction. Recursive message is a kind of
message that represents the invocation of message of the same lifeline. It's target points to an activation on top of the
activation where the message was invoked from.
4
5. Advance Software Engineering LAB # 06
Delete Message
Delete message (called stop in previous versions of UML) is sent to terminate another lifeline.
The lifeline usually ends with a cross in the form of an X at the bottom denoting destruction
occurrence. UML 2.4 specification provides neither specific notation for delete message nor a
stereotype. Until they provide some notation, we can use custom «destroy» stereotype.
Online Bookshop terminates Account
Lifeline
Each object appearing on a sequence diagram contains a dashed, vertical line, called a lifeline,
which represents the location of an object at a particular point in time. The lifeline also serves as
a place for messages to start and stop and a place for the focus of control to reside.
Lifelines usually represent an object or its class.
5
6. Advance Software Engineering LAB # 06
TASK TO BE PERFORMED
Task # 01 : Create sequence diagram for the scenarios given below.
Scenario # 01
The ESU course registration problem will be used as an example throughout this book. The
process of assigning professors to courses and the registration of students is a frustrating and
time-consuming experience. After the professors of ESU have decided which courses they are
going to teach for the semester, the Registrar's office enters the information into the computer
system. A batch report is printed for the professors indicating which courses they will teach. A
course catalog is printed and distributed to the students. The students currently fill out (mulit
part, multicolor) registration forms that indicate their choice in courses, and return the completed
forms to the Registrar's office. The typical student load is four courses. The staff of the
Registrar's office then enters the students’ forms into the mainframe computer system. Once the
students' curriculum for the semester has been entered, a batch job is run overnight to assign
students to courses. Most of the time the students get their first choice; however, in those cases
where there is a conflict, the Registrar's office talks with each student to get additional choices.
Once all the students have been successfully assigned to courses, a hard copy of the students'
schedule is sent to the students for their verification. Most student registrations are processed
within a week, but some exceptional cases take up to two weeks to solve. Once the initial
registration period is completed, professors receive a student roster for each course they are
scheduled to teach.
Scenario # 02
You're short on cash, so you walk over to the automated teller machine (ATM), insert your card
into the card reader, respond to the prompts on the screen, and within a minute you walk away
with your money and a receipt. These machines can now be found at most supermarkets,
convenience stores and travel centers.
6
7. Advance Software Engineering LAB # 06
Scenario # 03: Create an sequence diagram for email account creation.
Scenario # 03: Create an sequence diagram Online Bookshop
Scenario # 03: Below an activity diagram is shown. Give an interpretation of the diagram.
7