Trusted Cricket Betting ID Provider In India: Get your Cricket ID Now
International Trade
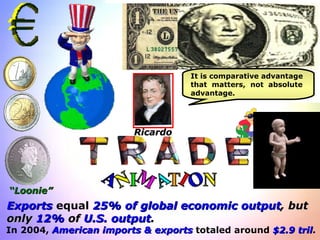
1. Exports equal 25% of global economic output , but only 12% of U.S. output . In 2004, American imports & exports totaled around $2.9 tril . “ Loonie” Ricardo It is comparative advantage that matters, not absolute advantage.
2. Independently Poor [If we consumed only the goods & services we produced] [We would toil long hours but remain dirt poor]
4. The Fruits of Free Trade A Global Fruit Basket Apples New Zealand Apricots China Bananas Ecuador Blackberries Canada Blueberries Chile Coconuts Philippines Grapefruit Bahamas Grapes Peru Kiwifruit Italy Lemons Argentina Limes El Salvador Oranges Australia Pears South Korea Pineapples C osta R ica Plums Guatemala Raspberries Mexico Strawberries Poland Tangerines S.Africa W atermelons H onduras
12. 224 C anada 197 [in 04] China 118 Japan 138 M exico 97 Mexico 170 C anada 35 [in 04] China 200 180 160 140 120 100 80 60 40 20 0 180 160 140 120 100 80 60 40 20 0 Imports 68 Germany 40 Taiwan 43 UK 37 K orea 19 F rance 34 UK 29 Germany 24 Korea 28 Taiwan 17 Singapore 17 Netherlands 14 F rance EXPORTS 52 Japan
13. If World Trade Is So Great, Why Are These People Against It?
14. Name a TV Company That S till Produces TVs in the U.S.
15. Giant Sucking Sound Familiar TV Names But Foreign [We used to have 27 companies producing TVs, now 0] Magnavox Netherlands (Phillips) Philco Netherlands (Phillips) Sylvania Netherlands (Phillips) RCA France-China (TCL-Thompson) G eneral Electric France (Thompson) Motorola Japan (Quasar) Zenith South Korea
16. $124 Billion Chinese Trade Deficit Top Chinese Imports (bil.) 8.6 Shoes 6.1 Toys 5.6 Input-output units 5.1 Data processing machine parts 3.2 VCRs 2.6 Wood furniture 2.0 Transmission 1.7 Data Storage units 1.6 Christmas items 1.6 Video games 1.6 Telephone sets 1.4 Sweaters & pullovers Top Chinese Imports (percentage of all imports) 88% of all Radios 87 % C hristmas & festive items 83% Toys 70% Leather goods 67% Shoes 67% Handbags 65% Lamps and lights 64% Cases for cameras, eyeglasses, etc. 60% Drills, power tools 56% Household plastics 54% Sporting goods 53% Ceramic Kitchenware The U.S. trade deficit with China in 2004 was $ 162 billion . Wal-Mart bought $16 billion from China in 2004.
17. Japan – “Land of the $30 pizzas, $30 lipstick, $50 melons, $100 jeans and $4,500 two-bedroom apts.” Japan has been a closed economy[fewer choices, higher prices ] Item N.Y. Tokyo Shock Absorbers $228 $605 Alternator $120 $600 Watermelon $5 $50 Cup of coffee $1 $7 Cab to airport $20 $200 Stamp .37 .79 Gallon of gasoline $1.85 $5.00 Newspaper .50 $1.00 Movie Ticket $14 $20 We have 550 cars per 1,000 ; Japan has only 240 per 1000 inhabitants. Japanese cameras are more expensive in Tokyo than in New York. In Tokyo, you have to have a sizable inheritance to be able to afford a house. Their national debt is $31,000 per capita , compared to $24,500 in the U.S. J apan has had a decade-long economic tailspin , even with in. rates of .15 of 1%. The Japanese paid $28 billion per year in higher prices for rice because they would not buy from U.S. rice farmers. Japanese consumers pay $600,000 in higher prices for each job protected.
19. Check out this Honda Chinese Knockoff. One of these Honda motorcycles is a Chinese knockoff . *The fake one is on the right [selling for $300]. Global counterfeiting cost companies $512 billion in 2004. China has 2/3 of all counterfeit products . Some of the counterfeiting goods include: 16.5 million Lipitor tablets, $1 million worth of H-P inkjet cartridges, phony Viagra; cigarettes, $100 bills, 11,000 fake parts for Nokia phones, Callaway Golf clubs, Intel Computer chips, shampoos, soaps, teas, 10% of all medicines, bogus car parts, Sony PS2’s, even cars. China’s policy seems to be: “ If you can make it , we can fake it .”
20.
21. . Counterpoint: That is half the story. Here is the rest of the story. 1. The higher steel prices saved 17,000 jobs in the steel industry but led to the loss of 52,400 jobs in American steel-using industries. For every job saved, three were lost. 2. The import quotas on Japanese autos preserved 4,598 American auto jobs but at a cost to consumers of $241,235 per job per year, in higher prices paid for cars. Saving a 30,000 auto job cost consumers $120,000 annually in higher prices. Point: Protecting American businesses from foreign competition does potentially preserve American jobs. 1. Restrictions on imported steel in the 80s saved 17,000 jobs in the steel industry and its suppliers. 2. Import quotas on Japanese autos preserved 4,598 American jobs . *The more you pay for protected goods, the less you have to use to buy other goods. The less consumers have to buy other goods, then fewer jobs will be created by the market. Jobs, Jobs, Jobs Argument
22. Low Wage Competition Counterpoint: Low wages allow developing countries to enter the world economy. These jobs are considered “good jobs” in the developing country, and allows the US to produce what we do best. Point: If we trade freely with low wage countries, U.S. businesses will flee to those countries and U.S. wages will plummet.
23. “ I know you are against free trade as a former employee . But – how do you feel about free trade as a consumer ?
24.
25. Total output will be greatest when each good is produced by the nation that has the lowest opportunity cost for that good. Principle of Comparative Advantage
26. “ The Babe” Absolute Advantage in Hitting & Pitching Babe Ruth was the best hitter and pitcher on His team. He had been the best pitcher in the American League for several years, winning 94 games and losing only 46. He could produce the same amount of home runs as any teammate with fewer at bats. The problem was that if he pitched, he would bat fewer times because pitchers need rest after pitching. The Babe had helped the Red Sox win the pennant in 1915, 1916, & 1918 . He had pitched 29 scoreless innings in the world series. As a pitcher for the Red Sox in 1918 & 1919, he hit 40 of the Red Sox 46 home runs . After being sold to the Yankees in 1920 , the coaches decided that the Babe had a comparative advantage in hitting . A few pitchers on the team could pitch almost as well as the Babe, but not one could touch the his hitting. In terms of opportunity costs, the Yankees would lose fewer games if the Babe specialized in hitting. So – the Babe ended up hitting 714 home runs even though he spent seven years as a pitcher. And the Red Sox don’t win again – until 2004 .
27. Absolute Advantage [ outputs or quantity ] – high number is more efficient, can produce more push-ups with the same number of muscles. I Can do 8 push-ups . I Can do 42 push-ups. I have an absolute advantage in producing push-ups.
28. Absolute Advantage [ inputs or hours ] - low number is more efficient, can clean the same house quicker. I can clean that house in 4 hours. I’m more efficient. I can do the same work in 3 hours so I have an absolute advantage .
29. PRODUCTION POSSIBILITIES A B Curve For Each Country Coffee (tons) Coffee (tons) 45 40 35 30 25 20 15 10 5 0 30 25 20 15 10 5 0 5 10 15 20 25 30 5 10 15 20 Wheat (tons) Wheat (tons) United States Brazil
30. TRADING POSSIBILITIES LINES Coffee (tons) Coffee (tons) 45 40 35 30 25 20 15 10 5 0 30 25 20 15 10 5 0 5 10 15 20 25 30 5 10 15 20 A B Trading possibilities line Trading possibilities line Wheat (tons) Wheat (tons) The Gains from Trade United States Brazil
31. TRADING POSSIBILITIES LINES Coffee (tons) Coffee (tons) 45 40 35 30 25 20 15 10 5 0 30 25 20 15 10 5 0 5 10 15 20 25 30 5 10 15 20 A B Trading possibilities line Trading possibilities line A’ B’ Wheat (tons) Wheat (tons) The Gains from Trade United States Brazil
32. TRADING POSSIBILITIES LINES Coffee (tons) Coffee (tons) 45 40 35 30 25 20 15 10 5 0 30 25 20 15 10 5 0 5 10 15 20 25 30 5 10 15 20 A B Trading possibilities line Trading possibilities line A’ B’ Wheat (tons) Wheat (tons) The Gains from Trade The Case For Free Trade United States Brazil
33. COMPARATIVE ADVANTAGE Trading According to Comparative Advantage With trade, a few people lose a lot, a lot of people gain a little. [Freer trade is like improved technology]
34.
35. Wanted: More Cheap Imports Trade fosters competition, which rewards productivity and restrains cost. More-traded Products Five-year price decrease V ideo Equipment TV sets T oys P hoto equipment R oasted coffee A udio equipment D ishes & flatware W omen’s outerwear M en’s shirts/sweaters F ilm & photo sup. G irls’ apparel M en’s footwear N ew cars W omen’s dresses R ice HH laundry equip.
37. Joe Export Goes Out Of Business 12,000 x $40 = $480,000; 12,000 X $25 = $300,000 (It cost $180,000 to save one clock-radio guy’s job) Suppose Joe Export lives and works in the U.S. making dancing clock radios. He produces and sells 12,000 clock radios per year at a price of $40 each . There is no international trade. One day the U.S. market is opened to dancing clock radios from Japan. The Japanese manufacturers have a comparative advantage and sell them for $25 each. Joe can not compete at this price. His sales drop to such a degree that he goes out of business. International trade has harmed him but helped American consumers because they save $180,000. “ I can do the econ rap.”
38. Absolute A dvantage “ We can produce 40 tons of corn.” “ We can produce 60 tons of corn, so - we have an absolute advantage because we can produce more corn with the same resources.”
39. Global Trade The world is becoming a smaller place. What happens in Tokyo affects what happens in New York and Minneapolis. There is over $12 trillion in world trade . Volume of Trade Exports as % of GDP Panama 80% Belgium 70% Netherlands 62% Kuwait 55% Norway 45% Canada 41% [If we sneeze, Canada catches a cold] South Korea 36% Germany 36% China 35%[1/3 bought by U.S.] United Kingdom 29% Spain 29% Italy 28% France 27% Mexico 25% [80% of Mexico’s exports are sold to the U.S.] Japan 12% United States 11% [over $1 trillion in 2004] World 25% In 2004, we had a trade deficit in goods of $666 billion . We had a trade surplus in services of $48 billion . ($618 ) The importance of trade has grown. 11 %
40. High Cost of Protection It cost an average of $231,289 per job saved. Consumers pay $100 billion annually in higher prices . Protecting sugar raises candy and soft drink prices; protecting steel makes car prices higher. This is a “negative-sum game.”
41. History of Tariffs 1. Revenue Tariffs – applied to products not produced domestically [bananas, coffee]. These are normally low & their purpose is to provide income for the government. 2. Protective Tariffs – tax on imports designed to protect domestic producers from foreign competition [autos, shoes, textiles]. * We have tariffs on 8,753 products (70% of our imports). They add about 3% to prices . They cost consumers an extra $70 billion. [$1,000 per family] 1 st Hong Kong 2 nd 3 rd
42. Smoot-Hawley Tariff of 1930 Smoot-Hawley Tariff of 1930 -so high it decreased imports 60% and hurt all international trade. International trade plummeted from $60 billion in 1928 to $25 billion in 1938. Smoot-Hawley Tariffs on over 12,000 products went up. Agricultural tariffs went from 20% to 34%, clocks from 45% to 55%, woolen products from 50% to 60%, wines, spirits, & beverages from 36% to 47%, corn and butter tariffs were doubled, over 800 production items were taxed. Thispolicy put the “Great” in the “Great Depression” . Reed Smoot Willis Hawley
45. Trade Policies 2. GATT [ G eneral A greement on T ariffs & T rade] 1947–1995 - started with 23 nations and ended with 128 nations – set the rules for world trade . GATT had no mechanism to enforce their rules. Tariffs fell from 40% to 4% . 1. Reciprocal Trade Act – 1934-Roosevelt said to other countries, “ If you’ll lower your tariffs, we’ll reciprocate and lower ours by the same percent.” [up to 50% of existing rates]
46. World Trade Organization GATT protected intellectual property (patents , trademarks, and copyrights). GATT in 1995 was replaced by the World Trade Organization [ WTO ]. These agreements (by 2005) will boost the world’s GDP by $6 trillion [8%] . [ 148 nations ] U.S. consumers will gain $30 billion annually. We have trade restrictions on oranges from S. America , machine tools from Switzerlan d, TVs from S. Korea , computer screens from Japan , and steel from nearly everywhere on earth. There are also restrictions on watches , tobacco , ships , ice cream , cheese , clothing, sugar , & hundreds of other products. Sugar quotas for 2,000 sugar growers cost consumers $3 billion per year [cost twice the world price -22 cents per pound v. 10 cents per pound for the world price]. The annual cost of retaining just 1 job through trade restraints is $1 million in specialty steel, $550,000 in nuts and screws , $240,000 in orange juice , and $200,000 in glassware . In 1980 , U.S. auto companies sold 1 million fewer cars than in 1979. The “Big 3” lost over $4 billion . The “Big 3” demanded protection so they could retool for smaller cars. Japan agreed to voluntarily freeze auto exports to 1.65 million from 1981-1983 & 1.85 million in 1984 . With fewer choices, domestic car prices rose $2,000 and Japanese car prices rose $2,500 . We had a smaller selection, had to wait longer and paid $15.7 billion extra. WTO WTO
50. This is more cars than the entire country of China had under the communist economy.
51.
52.
53.
54. Non-tariff Barriers Non-tariff Barriers –licensing requirements, re-inspections , unreasonable standards pertaining to quality and safety, or unnecessary bureaucratic red tape in customs procedures. The Japanese conduct stringent re-inspections of our autos that cost the Japanese consumer an extra $500.00 . 33 % 22 % 31 % 86 % 23 % 25 %
55. NAFTA [January 1, 1994] [ U.S., Canada, & Mexico ] NAFTA is a $12 trillion market [1,000 page docu] gamble for 421 million consumers . NAFTA will roll back 20,000 separate tariffs over 15 yrs. Before NAFTA, those barriers averaged 11% in Mexico , 5% in Canada , & 4% in the U.S. American consumers will save $20 billion per year when all trade barriers are removed. U.S. Canada Mexico GDP $12 tril. $1 Tril. $1 Trillion [40% live on less than $2 day] P opulation 295 mil. 30 mil. 105 million [Only 28% grad. high school] P er C apita $36,000 $30,000 $9,000 Ave. Hourly $16.00 $17.00 $2.00 [.60 min. wage]
56. Texas’ exports to Mexico have increased from $19 B to $52 B Top Texas Export Countries - 2000 $52 billion =$4 b illion Carlos Salinas De Gortari Brian Mulroney George Bush Signing of NAFTA - 1994
57. NAFTA’s Benefits for Mexico Mexico buys 70% of its imports from Texas. Texas’ exports to Mexico have increased from $19 billion in 1994 to over $52 billion in 2004 . Mexico’s imports of U.S. goods have gone from $51 billion to $111 billion , supporting over 1 million jobs in the U.S. Imports from Mexico have more than tripled . NAFTA encourages more world-wide investment in Mexico. This is enhancing their productivity and income . Some of this increased income is being used to buy U.S. exports . A higher standard of living in Mexico will help stem the flow of illegal immigrants to the U.S.
58. U.S. – Canada Trade U.S. exports to Canada $175 B U.S. imports from Canada $229 B Canadian-Mexican Trade Canadian exports to Mexico $1.3 B C anadian imports from Mexico $8.5 B U.S. - Mexico Trade U.S. exports to Mexico $109 B U.S. imports from Mexico $135 B North American Free Trade Agreement [NAFTA]
59. Note Sheet – 1-13 1. Most of our merchandise trade is with other industrially advanced (capitalist/communist) nations. 2. Quantitatively, our most important trade partner is (Japan/Mexico/Canada/Germany/Djibouti). 3. American exports of goods/services average about (30%/25%/12%/4%) of GDP. 4. According to the theory of comparative advantage , a good should be produced in that nation where its cost is (most/least) in terms of alternative goods which might otherwise be produced. 5. The ratio at which nations will exchange two goods is the (domestic comparative [opportunity] cost/terms of trade). 6. A (quota/tariff) is an excise tax on imported goods . 7. If the U.S. eliminates tariffs on Cuban rollerblades , we would expect the price of Cuban rollerblades to (increase/decrease) in the U.S. Also employment would (increase/decrease) in the Cuban rollerblade industry . 8. The Smoot-Hawley Tariff of 1930 established very (low/high) tariffs on goods imported to the U.S. 9. GATT included over 100 nations and emphasized tariff (reductions/increases) for members, and (increasing/decreasing) import quotas. 10. The Reciprocal Trade Agreements Act of 1934 brought about considerable (increases/reductions) in American trade barriers. 11. The European Union (abolished/increased) tariffs among one another and established a system of common tariffs with non-member nations. 12. NAFTA included the U.S., Mexico, and (Japan/Canada/Djibouti). 13. Proponents of NAFTA contend it will (incr/decr) the flow of illegal immigrants (incr/decr) U.S. exports by raising productivity & income in Mexico , and enable the U.S. to obtain (more/less) total output from its scarce resources.
60. Appreciation / Depreciation History Japanese TV cost Y207,000 1. A. $1 = 140 [TV would cost $1,479 ] B. $1 = 80 [TV would cost $2,588 ] C. $1 = 106 [TV would cost $1,953 ] 2. A. 1 Euro = $1.17 B. 1 Euro = 86 cents [in 2002] C. 1 Euro = $1.23 [in 2005] 3. $1 = 1.3 Loonies 4. A. $1 = 2,400 rupiahs [in 1996] B. $1 = 9,555 rupiahs [in 2005] And – $1 = 15.8 Vietnamese dongs
61. Exports Have More Than Doubled As A Percent of GDP Since 1975 $ 618 Billion Trade Deficit in 2004 Export Goods & Services 12% of American GDP KEY FACTS ON TRADE
64. That Sinking Feeling [Percent change from 8/11/97 to 8/11/98] C anada’s D ollar [“Loonie”] -8.5 % Indonesia’s Rupiah -80.6 % Thailand’s Baht -26.3 % South Korean Won -33.3 % Mexico’s Peso -15.2 % Japanese Yen -21.2 % So – Currency Prices Can Be Very Volatile.
66. On January 1, 2002, 300 million Europeans in 12 countries woke up to a new currency, the euro. 1. Windows and gateways dominate the front side of each note as symbols of EU spirit of openness and cooperation . On the back side is a bridge from a particular age, a metaphor for communication among the people of Europe and between Europe and the rest of the world . 2. Sign – was inspired by the Greek letter epsilon , in reference to the cradle of European civilization and the first letter of the word “Europe” . The parallel lines represent the stability of the euro . 3. Eight denominations of euro coins , each having a common side and a national side. Seven Euro Bank Notes
67. 8 Euro Coins 1 cent 2 cents 5 cents 10 cents 20 cents 50 cents One Euro Two Euros
68. $1 will buy EXCHANGE RATES: GLOBAL PERSPECTIVE Foreign Currency per U.S. Dollar .63 British pounds 10.91 Mexican pesos .93 European euros 119 Japanese yen 1,237 South Korean won 47.68 Indian rupee 1.48 Canadian dollars 1.36 Swiss francs 8.54 Swedish krona
69. Strong and Weak Dollar Exports Imports “ Strong Dollar”
70. The Falling Peso [Who Wins?] Losers [anyone buying with pesos] 1. Mexicans who buy American products 2. Mexican businesses that buy supplies from the U.S. 3. American businesses that sell products to Mexico 4. Mexican visitors to the U.S. 5. Those who primarily do business in pesos Winners [anyone buying with dollars] 1. American tourists to Mexico 2. People who send dollars to family or friends in Mexico 3. U.S. businesses that buy from Mexico 4. American consumers who buy Mexican imports 5. Those who primarily do business in dollars $1 = P3.5 $20,000 car = 70,000 pesos $1 = P10.0 $20,000 car = 200,000 pesos Year Dollar Yen Franc Mark 1 $1 320 4.0 1.8 2 $1 350 5.8 2.3 1. Given the change in the value of the dollar between year 1 and year 2, as indicated above, describe the effects this will have on U.S. tourism overseas.
71. 12 European Currencies Became Euros on 1-1-02 French Franc Luxembourg Franc Italian Lira German Mark Belgium Franc Portugal’s Escudo Greek Dracma Dutch Guilder Spanish Peseta But – there are still plenty of other currencies around the world. Ireland Pounds Finland Markhaa Austria Schilling
72.
73. European Union [ 25 nations–475 million people ] [ “Euroland” makes up the 22 euro nations ] [ GDPs of 25 total around $9.3 tril.] *It's like a "U.S. of Europe" [imagine each state in the U.S. having its own currency. If you wanted to buy a product in Louisiana, you would have to buy Louisiana currency and pay a 1-2% fee for doing so.) [After independence, states printed their own money. Formerly, there were tariffs and quotas against other European countries. The single currency will create efficiencies leading to faster growth & facilitate the establishment of a kind of U.S. of Europe . There will be huge benefits from free trade . The elimination of trade barriers alone will boost European GDPs an average of 6% & lower prices by about 6%. About 4-5 million more jobs will be created all over Europe.
74. European Union European free trade will increase production in two ways. 1. Lower costs , which will increase output . 2. It will increase productivity of capital and labor as those factors are allocated on the basis of comparative advantage . Europe will be more prosperous. So, there will be a central bank[European Central Bank] , or a kind of national sovereignty . This is the goal. Each nation still has its own central bank but they will have no a uthority to conduct m onetary policy. They will operate like regional banks of the Fed .
75. Appreciation / Depreciation NS [14-19] 17. Depreciation of the euro will (increase/decrease) European exports & (increase/decrease) their imports . 18. If Mexico decides to increase their investments in the U.S. , the peso will (appreciate/depreciate) which would (increase/decrease) [ Mexico’s imports ] U.S. exports to Mexico. 19. If the exchange rate changes so that more Japanese yen are required to buy a dollar then the yen will (appreciate/depreciate) and Americans will purchase (more/less) Japanese goods. 14. If the dollar depreciates relative to the peso , the peso will (appreciate/depreciate) relative to the dollar. 15. Appreciation of the dollar will tend to (increase/decrease) American imports & (increase/decrease) A merican exports. 16. The yen price of the dollar has decreased from 150=$1 to 100=$1 , which means the dollar (apprec/deprec), which (incr/decr) our imports from Japan.
76. APPRECIATION of a Currency 1. Increase in taste [more demand for a country’s products or assets] 2. Increase in interest rates [Overseas investors increase their investments there.] 3. Decrease in price level [overseas buyers want to buy our cheaper goods.] 4. Decrease in growth rate [ A country’s declining economy results in them buying less from other countries; decreasing demand for their currency and thus appreciating the declining economy’s currency] 5. Decrease in the price of a currency relative to the other
77. Appreciation / Depreciation Quiz 1. If Japan buys 2 mil. more A merican cars the dollar would (appr/depr) & our imports from Japan would (incr/decr). 2. If U.S. in. rates are increasing faster than Japan’s, the dollar would (appr/depr) and our exports would (increase/decrease). 3. If prices are dropping more in Japan than in the U.S., the yen will (appr/depr) and Japan’s imports will (increase/decrease). 4. If the U.S. growth rate is faster than that of Japan , the dollar will (appreciate/depreciate) and U.S. imports from Japan will (increase/decrease). 5. If the dollar price of the yen decreases , the dollar has (appreciated/depreciated) and our imports from Japan will (increase/decrease).
78. Appreciation / Depreciation Quiz [continued] 6. If Russia sells 10 bil. worth of oil to the U.S. the ruble would (appr/depr) and their imports from the U.S. would (incr/decr). 7. If U.S. in. rates are decreasing faster here than in Canada, the dollar would (appreciate/ depreciate) & U.S. exports would (incr/decr). 8. If prices are increasing more in Japan than in the U.S., the dollar will (appr/depr) and our exports will (increase/decrease). 9. If the U.S. growth rate is slower than that of Canada , the Canadian dollar will (appreciate/depreciate) & Canada’s exports to the U.S. will (increase/decrease). 10. If the dollar price of the euro increases , the dollar has (appreciated/depreciated) and our our imports from France will (increase/decrease).
79. Appreciation / Depreciation Practice Quiz 1 4. If Malaysia’s price level is decreasing faster than that of Brazil , the Malaysian ringgit will (apprec/deprec) & Malaysia’s exports to Brazil will (increase/decrease). 5. If growth rate is less rapid in Djibouti than in Swaiziland , then the Djibouti bouti will (appreciate/depreciate) and Djibouti’s exports will (increase/decrease). 6. If the Euro price of the S. Korean won decreases , the Euro has (apprec/deprec) & European exports to Korea will (incr/decr). 7. If interest rates are increasing faster in Zambia than in Spain , the Zambian Kwachi will (appreciate /depreciate) and Zambia’s imports from Spain will (increase/decrease). 1. If more Thai bahts are required to buy a dollar , then the baht has (appreciated/depreciated), & Thai exports to the U.S. should (increase/decrease). 2. If Latvia’s demand for U.S. Fuzzy W uzzies decrease , then Latvia’s Lat will (apprec/deprec) & Latvia’s imports from the U.S. will (increase/decrease). 3. If interest rates are decreasing faster in S.Korea[4 % ] than in Cuba[8 % ], then the Korean won will (appr/depr) & Korea’s exports to Cuba will (increase/decrease).
![Independently Poor [If we consumed only the goods & services we produced] [We would toil long hours but remain dirt poor]](data:image/gif;base64,R0lGODlhAQABAIAAAAAAAP///yH5BAEAAAAALAAAAAABAAEAAAIBRAA7)