2. M. Quader et al.
specific primers of Bulman and Marshall (1997). In their
study they found that the test is rapid, more reliable and
easier to interpret, especially when few cysts are available.
It is, therefore, a very convenient technique for studies
with a limited amount of starting material (Bustin, 2000;
Bago et al., 2002).
In this paper, our objectives were to determine the
presence of species of PCN in Victoria, to study sequence
based diversity of the identified species and to assess
the sensitivity of molecular diagnostic methods on the
Victorian PCN population.
Materials and methods
SAMPLING
Eighty-seven soil samples from different properties in
Cora Lynn, Gembrook, Catani, Bunyip, Iona, Garfield
and Koo Wee Rup in Victoria, Australia, were collected
and cysts were extracted using the Fenwick (1940) can
method. One or two cysts randomly selected from each
sample were used to determine species identification.
DNA EXTRACTION
DNA was extracted using a modified method of
FastDNA Spin Kit for Soil (Catalogue no. 6560-200;
www.bio101.com). Each cyst(s) was placed into 1.5 ml
centrifuge tube with 175 µl sodium phosphate buffer and
25 µl MT buffer was added to the tube and crushed with
a micro pestle. A mixture of ceramic and silica parti-
cles (100-150 µg) was added into each tube. The tube
was shaken in a TissueLyser®
(Qiagen) with 30 shakes/s
speed for 1 min followed by centrifugation at 1200 g for
30 s. The supernatant was transferred to a clean 1.5 ml
tube and 50 µl PPS (Protein Precipitation Solution) was
added. This was mixed by inverting tubes ten times and
centrifuged at 1200 g for 5 min. The supernatant was then
transferred to a clean 1.5 ml tube and 200 µl binding ma-
trix suspension was added to the supernatant and inverted
by hand for 2 min to allow binding of DNA to the matrix.
The entire mixture was then transferred to a spin filter and
centrifuged at 1200 g for 1 min. Then 100 µl of SEWS-M
was added to the spin filter and centrifuged at 1200 g for
1 min. The flow-through was discarded and the spin fil-
ter was placed in a catch tube (2 ml centrifuge tube). The
tubes were centrifuged for 2 min to dry the matrix of the
residual SEWS-M wash solution and the spin filter was
removed and placed in sterile 2 ml centrifuge tube. The
spin filter was air dried for 5 min at room temperature and
50 µl DES (DNAse/Pyrogen free water) was added to the
spin filter and stirred gently with a pipette tip to resuspend
the silica for efficient elution of the DNA. The tubes were
centrifuged at 1200 g for 1 min to transfer the eluted DNA
to a 2 ml centrifuge tube. DNA was stored in −20◦
C until
used.
PCR AMPLIFICATION
The primers used for PCR amplification are presented
in Table 1. A multiplex PCR amplification was done
according to Bulman and Marshall (1997). DNA of known
Gr and Gp (imported from New Zealand) was used as a
positive control against unknown samples. In each PCR,
a reaction without template DNA was performed as a
negative control. An amplified band of the same size as
the control was considered to represent the same species
as the control. The ribosomal gene spacer region was
amplified using primers ITS5 and ITS26 for sequencing
(Bulman & Marshall, 1997).
Table 1. List of primers with their name, sequences, binding sites, references, target DNA, specificity and types of PCR reactions used.
Name Primer sequences Binding site Reference Region amplified Specificity Type of PCR
ITS5 5 -GGAAGTAAAAGTC 18S DNA White et al. (1990) Partial 18S, complete ITS-1, Universal Conventional
GTAACAAGG-3 5.8S, ITS-2 and partial 28S and real-time
(With ITS26 primer)
ITS26 5 -ATATGCTTAAGTT 28S DNA Howlett et al. Partial 18S, complete ITS-1, Universal Conventional
CAGCGGGT-3 (1992) 5.8S, ITS-2 and partial 28S
(With ITS5 primer)
ITSr3 5 -AGCGCAGACATGC ITS-1 Bulman and Partial 18S and partial ITS-1 G. rostochiensis Conventional
CGCAA-3 Marshall (1997) (With ITS5 primer) and real-time
ITSp4 5 -ACAACAGCAATCG ITS-1 Bulman and Partial 18S and partial ITS-1 G. pallida Conventional
TCGAG-3 Marshall (1997) (With ITS5 primer) and real-time
472 Nematology
3. PCR-based identification of potato cyst nematodes
REAL-TIME PCR
The PCR primers used to distinguish Gp and Gr
were those described by Bulman and Marshall (1997).
The reactions were performed in a Rotor Gene 6 (Cor-
bett Research) real-time PCR machine. All reaction mix-
tures consisted of 12.5 µl 2X Platinum®
SYBR®
Green
qPCR SuperMix-UDG (Invitrogen Life Technologies,
Melbourne, Australia), 1 µl of 10 µM each of primers
(PITSr3, ITS5 and PITSp4), 1 µl DNA (14-80 ng µl−1
)
template and 9.5 µl water to make a total volume of 25 µl.
PCR cycling conditions were as follows: initial Uracil-
DNA Glycosylase (UDG) stage for 2 min at 50◦
C then a
Taq enzyme activation stage for 10 min at 95◦
C followed
by 40 cycles of 95◦
C for 10 s, 60◦
C for 15 s and 72◦
C
for 20 s. An automated measurement of PCR product
accumulation was done at the end of each extension step
of each amplification cycle. A melting programme of
ramp 72-95◦
C, each stem rising by 1◦
C, wait for 45 s on
first step then wait 5 s each step afterwards, was set for
the melting curve analysis at the end of 40 cycles so as to
obtain the melting peaks.
SEQUENCE ANALYSIS
The amplified product (primers ITS5 and ITS26) in-
cluded the primer-binding sites for the species-specific
products. The forward and reverse strands of PCR prod-
ucts of rDNA of 19 PCN samples from seven locations
were sequenced using the commercial facility of Flinders
Medical Centre, Flinders University of South Australia,
Australia.
Forward and reverse sequences of each sample were
aligned and edited using computer programs BioEdit
(http://www.mbio.ncsu.edu/BioEdit/bioedit.html) and
Chromas (http://www.genome-express.com/site_gex_by_
web/chromas.htm), and subjected to a database search
using BLAST (NCBI, National Centre for Biotechnol-
ogy Information, http://www.ncbi.nlm.nih.gov/). All se-
quences of Gr and Gp from the current study have
been submitted to GenBank (accession nos EF622513-
EF622532).
Only the sequences that contained the same length
and location of rDNA as the Victorian sequences were
selected from GenBank and published journal articles
and used for phylogenetic analysis. These were from
New Zealand (GrRoI-Lincon-NZ; Bulman & Marshall,
1997), Japan (AB207271), Russia-1 (DQ847120), Gr-
NYUSA (AF016878), Russia-2 (DQ847119) and UK
(DQ847118).
The computer program MEGA 4 (Molecular Evolu-
tionary Genetics Analysis http://www.megasoftware.net)
was used to align the sequences and for estimation of
pair-wise distances and construction of the phylogenetic
tree. The phylogeny test and options were maximum par-
simony, bootstrapped with 500 replicates and complete
deletion of gaps/missing data.
The alignment used 892-895 bases (ITS-1, 5.8S and
ITS-2) to obtain a common area on rDNA across all se-
quences (because not all sequences in GenBank database
have the same length as Victorian sequences). A sequence
of Gp from New Zealand was included as an out-group.
Results
CONVENTIONAL PCR
The 434 bp bands for Gr and 256 bp for Gp were
visualised on gel photographs (Figs 1, 2). All of the 87
cyst samples from selected fields were found to be Gr.
REAL-TIME PCR
The melting peaks from multiplex PCR for Gp and Gr
were ca 85◦
C and 88◦
C respectively (Fig. 3). Melting
peaks for some isolates of Gr varied significantly (86-
88.2◦
C) compared with insignificant variations (83.7-
84.2◦
C) in melting peaks of Gp (data unpubl.). However,
despite variation in melting peaks, the real-time PCR
products provided consistent diagnostic bands for Gr,
thereby indicating the limitation of melting curve analysis
for more than 200 bp PCR products. The real-time PCR
was able to detect eight times lower levels of DNA than
conventional PCR.
SEQUENCE DIVERGENCE
All rDNA sequences of Gr (19 from Victoria and six
from different parts of the world) were grouped into ten
groups in a maximum parsimony-based phylogenetic tree
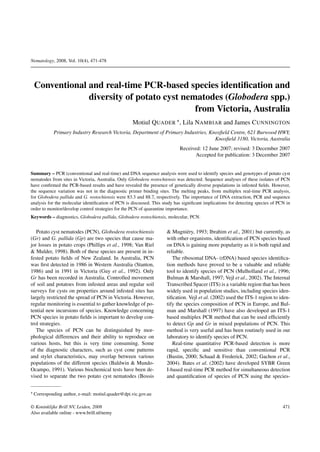
(Fig. 4). All Victorian isolates of Gr were grouped into six
genotypic groups (Fig. 4). PCN obtained from different
properties of the same owner were grouped into separate
clusters. Nine out of 19 isolates of Gr were grouped into
a single cluster. Only one sample was grouped with the
sequences from Russia and USA. The sequences from
New Zealand were grouped with the sequences from
Japan. Another group was formed with Gr sequences from
Russia and UK. However, very few sequence variances
were found across all genotypes and therefore none of
Vol. 10(4), 2008 473
4. M. Quader et al.
Fig. 1. Example of gel photograph of a multiplex PCR. Lane 1 = negative control; 2 and 3 = Globodera pallida/G. rostochiensis 1:1;
4 = G. rostochiensis; 5 = G. pallida; 6-12 = unknown samples; 13 = ladder DNA (100 bp).
Fig. 2. Example of gel photograph of PCR products from cyst DNA. Lane 1 = ladder DNA (100 bp); 2 = Globodera pallida; 3 =
G. rostochiensis; 4-10 = unknown PCN samples; 11 = negative control (no DNA); 12 = ladder DNA.
Fig. 3. Melting graph for Gr and Gp from real-time multiplex PCR analysis. A = Gp (83.3◦C), B = Gr (88.7◦C). Each line of the curve
represents one replication of PCR reaction. Inset: gel photo of multiplex real-time PCR products.
474 Nematology
5. PCR-based identification of potato cyst nematodes
Fig. 4. Bootstrapped phylogenetic reconstruction of sequences (892-895 bp) from PCN from Victoria and different parts of the world.
F1-F12 = farmer numbers; P1-P4 = property numbers followed by isolate numbers, name of locations and/or accession number; CI
= 0.930233, RI = 0.884615, RCI = 0.822898 (for all sites). Only bootstrap values over 50% are represented on clades. The scale
represents the number of sequences.
Vol. 10(4), 2008 475
6. M. Quader et al.
the isolates was grouped with species Gp indicating that
variation in sequence did not change the species identity
of the nematode.
The overall mean distance amongst the sequences was
0.5%. Pair wise distances within the isolates of Gr were
between 0-1.5% and 3.1-3.4% between Gr and Gp (data
unpubl.).
Discussion
In this study we have improved the reliability of
results by using a modified DNA extraction method
of a DNA extraction kit (MP Biomedical, New South
Wales, Australia). This has ensured quality and optimum
production of DNA as compared to the phenol-chloroform
extraction method that had been used in our laboratory.
This quality is important for good reproducible PCR
products or for fluorescence signal in real-time analysis.
In addition, extracted DNA from a cyst can be used
directly in a PCR reaction without further dilution as
our method was constantly producing 20-80 ng DNA
per µl (data unpubl.). The sequences from amplified
PCR products were matched to sequences of Gr in
a database indicating the presence of target DNA in
extracted samples.
As expected, the sensitivity of the conventional PCR
method was good enough to produce diagnostic markers
from as low as 480 pg µl−1
PCN DNA. Despite a two
bases difference in the diagnostic primer binding sites
of these species, subsequent sequence analysis confirmed
the accurate (100%) production of a diagnostic marker
corresponding to each species.
In this study, we were able to distinguish between Gr
and Gp in multiplex real-time PCR using SYBR Green I
fluorescent dye. This assay allows species determination
by melting curve analysis. The accuracy of PCN species
identity determined by this method was compared to that
obtained by conventional PCR and sequence analysis.
This study is in agreement with previous studies where
a similar technique has been used to quantify and identify
species of PCN and cyst nematodes (Bates et al., 2002;
Madani et al., 2005).
As intercalating agents bind regardless of the nu-
cleotide nature they can be used for any type of sequence.
This is an economical advantage for a laboratory test-
ing a large number of genes/target DNA. However, this
is also a disadvantage for certain conditions, where flu-
orescence emission from both non-specific and specific
products could produce misleading results, thereby com-
promising accurate detection/quantification. In order to
avoid this potential problem, intercalating agents can be
replaced by fluorescent probe(s), which specifically bind
to the target sequence. On the other hand, under the rapid
cycling conditions of real-time PCR, it is preferable to
amplify smaller products in the range 100-200 bp (Ga-
chon et al., 2004). This was probably true for our study as
we obtained variable peaks for the bigger band (434 bp)
of Gr compared to consistent peaks for the smaller band
(256 bp) of Gp. It may, therefore, be possible to further
optimise the reaction by designing alternative common
primer(s) to produce smaller products for both species of
Globodera and to develop fluorescent probes.
SEQUENCE DIVERSITY
It is difficult to study the population genetics of an
introduced organism because the current genetic structure
could have already been influenced by a number of
factors such as: i) the number of individuals that were
introduced; ii) number of generations since introduction;
iii) genotypes of the individuals introduced; and iv)
random effect of genetic drift (Picard et al., 2004).
It is thought that Gr and Gp are both native to the
Andean Cordillera, the origin of its unique host genus,
Solanum (Canto-Saenz & Scurrah, 1977; Stone, 1985).
These species were introduced to Europe and then else-
where from South America along with the potato (Bald-
win & Mundo-Ocampo, 1991). In this study, the sequence
similarity amongst isolates of Gr was 99.21-99.99%, in-
dicating once again the common ancestry of the species.
However, isolates of Victorian PCN population were dif-
ferent to the European and American genotypes recorded
in GenBank which vary a little amongst themselves. Sub-
botin et al. (2000) have also found several haplotypes
within the genome of Gr. This could be due either to the
nature of the genome of the Gr nematode or the possi-
bility of several introductions to Australia. The pattern of
grouping of isolates in the phylogenetic tree from different
growers in Victoria indicates the possibility of up to seven
introductions in Victoria or any number (between 1 and 6)
of introduction(s) with several haplotypes in each intro-
duction of PCN in Victoria. However, further study with
more DNA sequences from live PCN isolates or DNA
from different parts of the world will be needed to verify
this hypothesis.
The sequence similarity (100%) on primer binding
sites amongst all genotypes, including those from New
Zealand, Japan, Russia, USA and UK, indicates the
476 Nematology
7. PCR-based identification of potato cyst nematodes
sensitivity of diagnostic primers on a wider range of
genotypes of PCN across the world.
This study has demonstrated that PCR-mediated ampli-
fication of specific regions of the PCN genome is highly
effective as a species diagnostic tool and is therefore a
sensitive method that can be used for taxonomic pur-
poses.
Acknowledgement
The authors are grateful to Dr F.A. Shah and Dr J.W.
Marshall of Crop & Food Research, New Zealand, for
supplying Gp DNA.
References
BAGO, B., ZIPFEL, W., WILLIAMS, R.M., JUN, J., ARREOLA,
R., LAMMERS, P.J., PFEFFER, P.E. & SHACHAR-HILL, Y.
(2002). Translocation and utilization of fungal storage lipid in
the arbuscular mycorrhizal symbiosis. Plant Physiology 128,
108-124.
BALDWIN, J.G. & MUNDO-OCAMPO, M. (1991). Heteroderi-
nae, cyst- and non-cyst forming nematodes. In: Nickle, W.R.
(Ed.). Manual of agricultural nematology. New York, NY,
USA, Marcel Dekker, pp. 275-362.
BATES, A.J., TAYLOR, E.A., GANS, P.T. & THOMAS, J.E.
(2002). Determination of relative proportions of Globodera
species in mixed populations of potato cyst nematodes using
PCR product melting peak analysis. Molecular Plant Pathol-
ogy 3, 153-161.
BOSSIS, M. & MUGNIÉRY, M. (1993). Specific status of six
Globodera parasites of solanaceous plants studied by means
of two-dimensional gel electrophoresis with a comparison of
gel patterns by a computed system. Fundamental and Applied
Nematology 16, 47-56.
BULMAN, S.R. & MARSHALL, J.W. (1997). Differentiation of
Australasian potato cyst nematode (PCN) populations using
the polymerase chain reaction (PCR). New Zealand Journal
of Crop and Horticultural Science 25, 123-129.
BUSTIN, S.A. (2000). Absolute quantification of mRNA using
real-time reverse transcription polymerase chain reaction
assays. Journal of Molecular Endocrinology 25, 169-193.
CANTO-SAENZ, M. & SCURRAH, M.M. (1977). Races of the
potato cyst nematode in the Andean region and a new system
of classification. Nematologica 23, 340-349.
FENWICK, D.M. (1940). Methods for the recovery and count-
ing of cyst of Heterodera schachtii from soil. Journal of
Helminthology 18, 155-172.
GACHON, C., MINGAM, A. & CHARRIER, B. (2004). Real-
time PCR: what relevance to plant studies? Journal of
Experimental Botany 55, 1445-1454.
GUY, G.L., WOODWARD, J. & HINCH, J.M. (1992). Glo-
bodera rostochiensis and possibly G. pallida in Australia.
Journal of Nematology 24, 594.
HOWLETT, B.J., BROWNLEE, A.G., GUEST, D.I., ADCOCK,
G.J. & MCFADDEN, G.I. (1992). The 5S ribosomal RNA
gene is linked to large and small subunit ribosomal RNA
genes in the oomycetes, Phytophthora vignae, P. cinnamomi,
P. megasperma f. sp. glycinae and Saprolegnia ferax. Current
Genetics 22, 455-461.
IBRAHIM, S.K., MINNIS, S.T., BARKER, A.D.P., RUS-
SELL, M.D., HAYDOCK, P.P.J., EVANS, K., GROVE, I.G.,
WOODS, S.R. & WILCOX, A. (2001). Evaluation of PCR,
IEF and ELISA techniques for the detection and identification
of potato cyst nematodes from field soil samples in England
and Wales. Pest Management Science 57, 1068-1074.
MADANI, M., SUBBOTIN, S.A. & MOENS, M. (2005). Quan-
titative detection of the potato cyst nematode, Globodera pal-
lida, and beet cyst nematode, Heterodera schachtii, using
real-time PCR with SYBR green I dye. Molecular and Cellu-
lar Probes 19, 81-86.
MULHOLLAND, V., CARDE, L., O’DONNELL, K.J., FLEM-
ING, C.C. & POWERS, T.O. (1996). Use of the polymerase
chain reaction to discriminate potato cyst nematode at the
species level. BCPC Symposium Proceedings 65: Diagnosis
in crop production, pp. 247-252.
PHILLIPS, M.S., TRUDGILL, D.L., HACKETT, C.A., HAN-
COCK, M., HOLLIDAY, J.M. & SPAULL, A.M. (1998). A ba-
sis for predictive modelling of the relationship of potato
yields to population density of the potato cyst nematode, Glo-
bodera pallida. Journal of Agricultural Science 130, 45-51.
PICARD, D., PLANTARD, O., SCURRAH, M. & MUGNIÉRY,
D. (2004). Inbreeding and population structure of the potato
cyst nematode (Globodera pallida) in its native area (Peru).
Molecular Ecology 13, 2899-2908.
SCHAAD, N.W. & FREDERICK, R.D. (2002). Real-time PCR
and its application for rapid plant disease diagnostics. Cana-
dian Journal of Plant Pathology 24, 250-258.
STANTON, J.M. (1986). First record of potato cyst nematode,
Globodera rostochiensis, in Australia. Australasian Plant
Pathology 15, 1986.
STONE, A.R. (1985). Co-evolution of potato cyst nematodes
and their host: implication for pathotypes and resistance.
Bulletin of the Organisation of European Plant Protection 15,
131-137.
SUBBOTIN, S.A., HALFORD, P.D., WARRY, A. & PERRY,
R.N. (2000). Variations in ribosomal DNA sequences and
phylogeny of Globodera parasitising solanaceous plants.
Nematology 2, 591-604.
VAN RIEL, H.R. & MULDER, A. (1998). Potato cyst nema-
todes (Globodera species) in Western Europe. In: Marks, R.J.
& Brodie, B.B. (Eds). Potato cyst nematodes: biology, dis-
tribution and control. Wallingford, UK, CABI Publishing,
Vol. 10(4), 2008 477
8. M. Quader et al.
pp. 271-298.
VEJL, P., SKUPINOVA, P.S., SEDLAK, P. & DOMKAROVA, J.
(2002). Identification of PCN species (Globodera rostochien-
sis, G. pallida) by using of ITS-1 region’s polymorphism.
Rostlinna Vyroba. Ustava Zemedelskych a Potravinarskych
Informaci, Praha, Czech Republic, 48, 46-489.
WHITE, T.J., BRUNS, T., LEE, S. & TAYLOR, J. (1990).
Amplification and direct sequencing of fungal ribosomal
RNA genes for phylogenetics. In: Gelfard, M.A., Sninsky,
D.H. & White, T.J. (Eds). PCR protocols. A guide to methods
and applications. San Diego, CA, USA, Academic Press, pp.
315-322.
478 Nematology