Moneycation april 2015 newsletter; volume #3, issue #10
•
1 gefällt mir•482 views

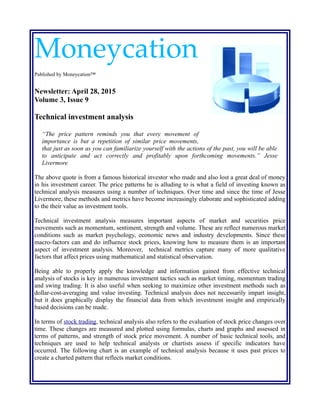
Technical investment analysis involves understanding price movements and knowing how to interpret their meaning. Numerous technical trading tools exist to assist with improving the probability of trading success.

Empfohlen
Weitere ähnliche Inhalte
Was ist angesagt?
Was ist angesagt? (20)
Andere mochten auch
Ähnlich wie Moneycation april 2015 newsletter; volume #3, issue #10
Ähnlich wie Moneycation april 2015 newsletter; volume #3, issue #10 (20)
Mehr von A.W. Berry
Mehr von A.W. Berry (20)
Kürzlich hochgeladen
Kürzlich hochgeladen (20)
Moneycation april 2015 newsletter; volume #3, issue #10
- 1. Moneycation Published by Moneycation™ Newsletter: April 28, 2015 Volume 3, Issue 9 Technical investment analysis “The price pattern reminds you that every movement of importance is but a repetition of similar price movements, that just as soon as you can familiarize yourself with the actions of the past, you will be able to anticipate and act correctly and profitably upon forthcoming movements.” Jesse Livermore The above quote is from a famous historical investor who made and also lost a great deal of money in his investment career. The price patterns he is alluding to is what a field of investing known as technical analysis measures using a number of techniques. Over time and since the time of Jesse Livermore, these methods and metrics have become increasingly elaborate and sophisticated adding to the their value as investment tools. Technical investment analysis measures important aspects of market and securities price movements such as momentum, sentiment, strength and volume. These are reflect numerous market conditions such as market psychology, economic news and industry developments. Since these macro-factors can and do influence stock prices, knowing how to measure them is an important aspect of investment analysis. Moreover, technical metrics capture many of more qualitative factors that affect prices using mathematical and statistical observation. Being able to properly apply the knowledge and information gained from effective technical analysis of stocks is key in numerous investment tactics such as market timing, momentum trading and swing trading. It is also useful when seeking to maximize other investment methods such as dollar-cost-averaging and value investing. Technical analysis does not necessarily impart insight, but it does graphically display the financial data from which investment insight and empirically based decisions can be made. In terms of stock trading, technical analysis also refers to the evaluation of stock price changes over time. These changes are measured and plotted using formulas, charts and graphs and assessed in terms of patterns, and strength of stock price movement. A number of basic technical tools, and techniques are used to help technical analysts or chartists assess if specific indicators have occurred. The following chart is an example of technical analysis because it uses past prices to create a charted pattern that reflects market conditions.
- 2. Candlestick charting is form of technical investment analysis Image attribution: StocksDocs. CC BY S.A.-3.0 After a technical indicator has occurred, a confirmation of that indicator may follow using another technical analysis metric. Technical analysis is not an exact science, and generally shouldn't be considered as always being reliable. Rather basic technical analysis is sometimes used in stock trading to assist in substantiating or validating other methods of stock analysis. As the video below states, technical analysis is not about fundamental statistics such as earnings per share. Moving averages Moving averages are measured in days, usually up to 200. When longer-term moving averages have been moved through by stock prices, it sometimes indicates a significant price movement. Sometimes stock price support and resistance are formed near moving averages, and when these price levels are significantly broken it can mean a possible price momentum trend. In other words, moving averages are at times used as pivot points where a stock may have a pattern of rebounding upward or downward. Candlestick charting Candlestick charting is a form of technical analysis that began in East Asia. In this type of analysis price movements are represented by black or white candlesticks with lines at the top and bottom. Sometimes colors such as green or red replace the black and white in candlesticks. The color, length and positioning of these candles are placed on a chart and scaled in terms of time and stock price . The technical analysis of these charts will then interpret the candles based on past patterns of similar candle positioning. Oscillators Oscillators are used to determine upper and lower limits of price movements. Examples of oscillators are the Relative Strength Index (RSI), and the Rate of Change (ROC) indicators. These
- 3. basic stock technical analysis tools plot values on a scale between 0-100 using mathematical formulas. When certain value levels are reached, the oscillators are sometimes thought to show an increased probability of a price being close to a high or low. Trading levels Trading levels constitute the amount of stock trading that takes place during a specific period of time and is another widely used basic aspect of technical analysis in stock trading. Trading levels are measured using volume and when it ncreases it can mean a growing momentum in the movement of a trend may be occurring or about to occur. Volume can also indicate overall market participation. For example, during holidays, volume can be quite low due to the absence of investing activity on those days in holiday when the stock market is open. Line graphs Line graphs are also used in basic technical analysis of the stock market. When stock prices are plotted onto line graphs over time, the movement of that price can be analyzed for patterns in a similar way to candlestick charting. For example, a stock price line graph may create a pattern called 'head and shoulders', which literally takes the shape of a left and right shoulder with a head in the middle. If patterns like this become evident, stock prices sometimes follow similar movements to previous occurrences when a similar pattern was observed in that or other financial securities' line graphs. Anatomy of a stock chart candlestick Candlestick analysis tracks price movements to confirm trends Image attribution: Ticmarc, Public Domain Candlestick charting is a kind of financial analysis used in what is known as technical analysis. Technical analysis of financial securities interprets charted or graphed price movements, patterns and trends of a financial product to help improve the results of financial activities such as stock trading. In candlestick analysis the candlestick chart or graph is the tool for analysis, but the
- 4. analysis of that chart is what provides financial utility. Moreover, as a form of technical analysis, candlestick charting reflects financial influences such as market psychology via product price patterns instead of the evaluating the product itself. The history of candlestick charting In the book 'Trading Applications of Japanese Candlestick Charting' by Gary Wagner and Bradley Matheny, the origins of candlestick charting are said to date back to the seventeenth century creation of an honorary samurai and futures trader named Sokyu Homma. According to Wagner and Matheny, Homma's candlestick patterns indicated commodity price direction when a series of three candlesticks in either an upward or downward pattern occur as 'gaps' in the opposite direction. Patterns like those developed by Sokyu Homma are determined using candlestick charting through evaluation of key variables in a financial product's price including its opening price, highest price, lowest price and closing price. These price movements are represented as a pattern or series of chronological units such as a single day, with each unit graphed as a single rectangle or line known as a candlestick. The video below further explains the history and purpose of candlestick charting. Interpretation of price patterns The appearance of candlesticks and wicks provide a lot of information about a financial product's price patterns for the period of time it is measuring. Essential aspects of the candlesticks are their color, length and the length of the 'wicks' or lines at the top and bottom of the candlestick's body. These candlesticks can vary in length and position on a candlestick chart depending on how the price of a particular price such as company price per share moves in a given time period. The top and bottom of the candlestick's body symbolize the opening and closing prices, and the top and bottom of the wicks represent the highest and lowest values reached during a trading period. When a candlestick is black or red, a product's price has closed lower than its price when it opened at the beginning of trading. If the product's price closes higher than the opening price, the body of the candle is green or white. Long candlesticks and wicks represent a larger range of price movement than shorter candlesticks where the bottom wicks indicate the lowest price of the trading period and the top wick show the highest price. Sometimes no candlestick body is formed at all and this is called a 'doji'. Also per Wagner and Bradley, a Doji represents a trading period in which the opening price and closing price were very similar. Price evaluation and forecasting Once the appearance and location of a candlestick is understood, it is then interpreted for price evaluation and forecasting purposes. This is done by analyzing the form of the candles and their relationship to other candlesticks on the chart. For example, a series of black candlesticks each positioned lower than the next indicates a negative price trend such as a 'bearish hook reversal' and may mean confidence in a stock or commodity has been lost. Furthermore, if the majority of candlesticks on a chart are black with a visible downward trend, this can indicate a long term trend such as a market correction. A market correction is when a price moves lower to correct overly optimistic speculation regarding a specific product's value.
- 5. There are several candlestick chart patterns which a chartist is ideally familiar with. These patterns also have names such as 'spinning top', and 'marubozu' which help the chartist quickly interpret their meaning based on previous interpretations of the candlestick pattern. To illustrate, according to Minyanville Media Inc, an Emmy Award Winning business information provider, a 'spinning top' can serve as an indicator a price reversal is about to take place. Candlestick charting analysis, like most financial analysis in general is not definitive proof of where a financial product's price is heading. However, candlestick charts can serve as indicators of market indecisiveness, conviction and momentum; all of which in and of themselves influence the price of financial products. The Relative Strength Indicator (RSI) was developed in 1978 by an individual named Welles Wilder. The RSI is what day traders call a 'technical indicator' and is a mathematical calculation used in the assessment of a securities performance. The RSI can be applied to stocks, currency, commodities and even baseball batting averages but the indicator was designed primarily for financial markets. What the Relative Strength Indicator measures The RSI measures short-term strength of price momentum as compared to recent price declines on a scale from 0-100. In other words, the indicator measures a financial vehicle's gain in proportion to recent losses over a period of 1-3 weeks. This allows day traders and brokerage firms to have a better idea regarding the significance of a price movement. The closer the RSI is to 100, the more significant the price increase is and the closer the RSI value is to 0, the greater the scale of price decreases. RSI values over 50 are considered 'bullish' or favorable while a value of 70 may indicate a financial instrument has been overbought. How the Relative Strength Indicator is Calculated Modern technology and computerized software programs often calculate technical indicators such as RSI for the trader so they don't have to waste their time with multiple equations. What's more the RSI's of securities can be displayed in the form of a graph allowing a trader to see how the RSI has changed over time. For this reason it can be considered more important to know what the RSI measures than how it is measured. However, for purpose of explanation the basic RSI calculation is as follows: RSI= 100-(100/1+RS) where RS=(Total gains/n)/(Total losses/n) where n=number of days or periods. This is one of the easier ways to calculate RSI as there is also a more sophisticated way to calculate it using past RSI's for greater accuracy or 'smoothing'. Also, if a securities price does not change from day to day the equation is adjusted to incorporate an 'exponential moving average'. Usefulness of the Relative Strength Indicator The usefulness of the RSI is relative to many external factors and other technical indicators. While it is not the only indicator, it is thought of as a useful one but is often not the only indicator used by traders when making buy or sell decisions. The reason the RSI is useful is because it is a reflection of enthusiasm for a particular stock, commodity or other financial instrument. When enthusiasm is high and a stock is not 'overbought' as indicated by the RSI, it may be a significant entry point for a trader.
- 6. In summary, the Relative Strength Indicator (RSI) is a mathematical metric used in technical analysis of financial instruments. The RSI is often calculated using financial software to assist traders in making buy and/or sell decisions. The RSI is one of many tools available to securities traders and measures price movement momentum. As useful as the RSI may be it is often used in conjunction with other technical indicators. The zero line cross trading system The zero line cross trading system is mostly simply used as a "price momentum indicator". Indicators such as this are statistically based and are not a guarantee that a desired and/or indicated change will occur but rather an indication that a change has occurred and may lead to future changes in a specific direction. In other words, the zero line cross indicator is what day traders call a technical indicator and is used in technical analysis of financial securities such as stocks. The time frame for which this indicator is used in is quick, lasting as little as a few minutes and it may switch indications several times in a single day. Why the Zero Line Cross trading system is useful The ZLC is useful because like other technical indicators that measure price momentum, it demonstrates a potential movement trend in the price of a stock. Day traders may use this indicator in determining when they should buy in or sell out of a stock position. How the zero line cross works The mathematics behind the ZLC can be distracting and abstract as it is used in tandem with another technical indicator called the commodity channel index (CCI) which is used in market timing of price cycles. The CCI uses a scale of 0-100, but also uses a scale of 0 -(-100). The zero line of the CCI scale is used in the zero line cross trading system along with another technical indicator called the moving average which is literally the moving average of a price over time. When the price of a stock or commodity crosses the zero line of two long term commodity channel index lines i.e. price momentum as calculated using different time frames, a trader is signaled a buy may be in order. The indicator is stronger if the moving average is also broken by the stock or commodity price. Many computer software programs perform the mathematical calculations needed to determine when the zero line is crossed in the appropriate way and do so in the form of a graphical representation or chart overlay. A few of the important aspects of the zero line cross trading system are the following: • Price passes through both long term commodity channel index zero lines. • The price of the stock or commodity also breaks through the moving average. • The zero line has not been significantly surpassed
- 7. Calculating the zero line cross indicator To better understand the dynamics of the zero line cross indicator it can be helpful to understand the mathematics behind the calculation but is not always necessary. Three equations are used in the zero line system. 1. Price moving average 2. Commodity Channel Index (time scale A: Ex. 30 days) 3. Commodity Channel Index (time scale B: Ex. 60 days) There are several ways to calculate a moving average such as simple moving average, typical moving average and exponential moving average with increasing accuracy in the same order. The typical moving average is calculated by taking a number of days or periods stock price high, low and close values and dividing it by three and then adding each days typical price average and dividing that by the total number of periods. Symbolically it looks like this: TMA=(H1+L1+C1/3)+(H2+L2+C2/3)+(H3+L3+C3/3)../N where N=number of periods and TMA=Typical Moving Average. And (H1+L1+C1/3)=TP or typical price. Both the commodity Channel Index values are calculated in an ongoing manner using the same method for different time periods. The long term time periods allow the mathematician or software program to determine a 200 point index range from -100 to +100 and the calculation is as follows: CCI=(average price of the stocks high, low and closing values-moving average price)/ .015 * mean deviation). The mean deviation is calculated by determining the average dispersion of a time periods stock price about the mean. Symbolically the mean deviation is calculated as follows: 1. Calculate TMA for each day of the time period to be measured Ex.30 days using the above formula. 2. Subtract each days Typical price from the Typical Moving average for that day. 3. Add the new values up and divide by 30. The Zero line cross trading system is a price momentum indicator that is usually used in an on going basis for short term trading while using long term values in its calculation. A range between -100 through +100 is determined by calculating the commodity channel index for a number of days in the past thereby establishing a zero line. This zero line becomes the indicator device through which the trader can better determine if a price trend shift is occurring. If the zero line and the moving average lines are broken this suggests to the trader a positive change in momentum in a securities price could occur. The moving average bounce trading system is a pattern in stock price movement similar to a ball bouncing off a moving floor. For example, just like the average height of a female may be 5' 8" a stock price also acquires an average over time. During a typical trading day, the price of the stock may move above or below this average stock price. The analysis of these price movements is called technical analysis as the following video illustrates. The moving average bounce trading system
- 8. utilizes a technical analysis technique. To explain further, the moving average bounce trading system is a system of analyzing financial instruments based on a bouncing pattern produced by a stock price's movement around its moving average. Specifically, the pattern starts by moving away from the moving average, then back toward it and then away again, hence the 'bounce' term. Why the moving average bounce is meaningful to day traders The moving average bounce indicates that a stock price or other financial instrument may have reached a new price floor because the bounce is technically the second divergence away from the moving average line. This means the chances of the price moving below the moving average may be lower and a trader hopes this is the case. Spotting a moving average bounce Stock price graphs and software applications often chart the course of historical stock price movement and also perform statistical calculations used in analyzing stock price movement. One such calculation is the moving average and can be viewed on stock charts and graphs in the form of a line visibly overlayed on the stock price line. This enables the day trader to compare the stock price to the moving average and spot the bounce. Timing a moving average bounce Moving average bounces can occur anytime in a financial instruments trading cycle. In day trading, a moving average bounce is used in a short-term period meaning the period in which the bounce occurs can be minutes. Nevertheless, the actual moving average that is used can be a long term moving average but this is not absolutely necessary and depends on the technique and patterns used in stock trading. Calculating the moving average If one has no choice but to calculate a moving average manually the equation is fairly simple. Select a time period such as 30, 60, or 90 days and take three time periods for each of those days. Find the price of the stock for each time period, add them and then divide them by 3 to get an average daily price. Then do this for each of the 30, 60 or 90 days, add them and divide that number by the number of days. The moving average will then have been calculated for the 90th day. In mathematical steps, an example calculation proceeds as follows: 1. Morning price + Midday price + Afternoon price/3 2. Repeat for desired number of days Ex. 30 days 3. Add each days average price and divide by 30 There are several ways to calculate a moving average, and the method one chooses depends on the accuracy one desires and/or the software one uses. Three methods of moving average are simple moving average, 'typical price' moving average and the exponential moving average. The above example uses the typical price method and is an average using a number of averages while the
- 9. simple average method is just an average. The exponential moving average gives greater importance to recent prices and is thus a 'weighted' moving average. The formula for this moving average incorporates an exponent with each new days moving average for such weighting purposes and is calculated as follows: Exponential Moving Average=Stock Close price * Exponent) + (prior days moving average or exponential moving average * (1-Exponent) Where the exponent is calculated by dividing 2 by the number of days in the moving average +1. The exponent is the key to calculating the moving average using this method and it is calculated by dividing the number 2 by the number of days in the moving average calculation + 1. This must be done for each of the days as in the typical price moving average method above. However, the first day in the calculation which is actually the second day because a previous day must exist for the equation to work properly, will have a larger exponent than the most recent days allowing it to be mathematically weighted. The moving average bounce is what day traders call a 'technical indicator' meaning it is used in the technical analysis of a financial instrument's price movement. The purpose of the moving average bounce is to signal a possible buying or entry point for the trader. The confidence given to this technique is due to the fact that the bounce is the second rather than the first movement away from the moving average line indicating a possible price floor and predictable movement in the price of the stock. The actual movement of the stock price may or may not move the direction the trader intends through using the moving average bounce system. However, the bounce system also gives the trader more reason to think the stock price will move in the direction (s)he wishes. Moving average bounces can be observed using technical analysis software, various stock price charts and/or calculated manually. The moving average bounce system may also be used along side one or more other technical indicators. The Commodity Channel Index The commodity channel index (CCI) is one of many financial techniques that have been developed by mathematicians, economists, and financial analysts within the last few decades. The commodity channel index is used to assist with predicting stock price and other financial instruments movement. The Commodity Channel Index (CCI) is one such technique and was first introduced in 1980 by a man named Donald Lambert. The CCI is a mathematical indicator that measures price oscillations around an average stock price and uses a range from -100 through +100. Prices closer to +100 in the range indicate more buying of a commodity and prices closer to the -100 point in the CCI range indicate more selling has taken place. Why the commodity channel index is useful The commodity channel index is useful for day traders because they can monitor the stock price in relation to the commodity channel index to see if prices suitably positioned for a possible trade. In
- 10. any given day of trading a stock price may move into and out various points within the commodity channel index range which helps the trader navigate price movements. The CCI is considered beneficial in the following ways: • Can be used across securities markets including stocks, commodities, and foreign exchange. • Is readily available in software applications and presented in graphical format. • Indicates where a securities price stands in relation to CCI range. • Helps traders determine possible entry and exit points for trading. • Points out where a stock, commodity or other security may be overbought or oversold. • Provides an ongoing measurement throughout the trading day. Using the commodity channel index The commodity channel index is used by calculating 2-3 equations on an ongoing basis. These equations are the moving average, and 1-2 long term commodity channel index equations. The moving average is used in determining an average security price over a period of time and the commodity channel index is used to both establish a range of high, low and middle points for the securities price and where within the range a current stock or commodity price is. The results of these equations are often presented in the form of line graphs alongside the actual historical price movement of a security. Calculating the commodity channel index If one's computer, spreadsheet application or technical analysis software is not working one may find themselves in the position of having to calculate the CCI manually. Performing the manual calculations may also assist in understanding the concepts and reasoning behind the commodity channel index. The calculations are as follows: The commodity channel index uses three sub equations in the main equation. Those equations are average daily price, moving average daily price and mean deviation of price from the moving average daily price. 1. An average daily price is calculated using different price points in a day such as open, close and midday or high, low or close or high, low or open. All these values could also be used and it depends on which numbers one things are more accurate. The following is an example of the calculation. Open $25.00+Midday 24.50 +Close 24.75=74.25/3=$24.75. Thus $24.75 is the average price for a day using open, midday and closing prices. 2. The moving average is determined by calculating the average daily price for a given number of days such as 60 days. These daily averages are then added and averaged themselves. For example, daily average day 1+ daily average day 2etc/ number of days=60. If the total of daily averages was 1650 then divided by 60 would yield a moving average number of $27.50. 3. Price Mean deviation is the difference in a stock or commodities price from the moving average. Like the previous two calculations this is also an average but the numbers being averaged are the difference of a daily price average from the moving daily average. For example, if in 60 days this difference adds up to $10.20, divided by 60=0.17 making the mean price deviation .17 cents.
- 11. 4. Last the CCI is calculated by using #1 , #2 and #3 above by subtracting the moving average daily price from an average price on a particular day for which the trader wants the indicator for. This value is then divided by .015 multiplied by the mean deviation. Using our examples above we get the following using $28.00 as our latest average day price. CCI=Latest average price-Moving average price/ .015 * Mean deviation. Note: (The .015 was included by Lambert in the calculation to allow for proximity to the 200 point scale so a majority of price values would fall within it.) CCI=$28.00-$27.50/.015 *.17=.50/.00255=196.07 Thus our commodity channel index number is well over +100 indicating a potentially overbought position! The Commodity Channel Index is one of many financial analysis tools available to day traders. This being the case it is often used alongside other useful indicators such as volume indicators, candlestick analysis, relative strength indicator and the zero line cross indicator. To use the CCI alone may not provide an adequate description of the price movement pattern that is being observed and therefore may at times if not often, be insufficient as price momentum indicator. Nevertheless, Conclusion Knowing how technical analysis works and being able to interpret stock price charts is considered quite important by investors. Even investors that prefer fundamental analysis often refer to technical charts and graphs for added insights into their potential investments. This is because technical analysis not only provides a visual display of quantitative financial data, but also presents a historical pattern of price movements and corresponding factors such as purchase volume and strength that occur side-by-side with those price changes. Technical methods and metrics such as the relative strength index, commodity price index and moving average bounce trading system apply pattern recognition to quantifiable observations and trends. Doing so helps investors and analysts interpret how and why securities prices move in the way that they do. This type of analysis also assists market participants evaluate whether or not buying or selling at particular times and price entry points is a wise and financially prudent choice. For example, even though a company may be trading under its historical price-to-earnings ratio, the price may still be overbought from a technical perspective. In other words, market conditions and business fundamentals are not always in agreement and this is important to acknowledge when making informed investment decisions. Being able to spot when this happens and understand its relevance makes the value of technical analysis all the more important.
- 12. Sources: 1. “Accounting Today”; Tax Strategy: Pass-Through Entity Simplification”; George G. Jones and Mark A. Luscombe; May 1, 2013 2. “Accounting Today”; Businesses Owners Need to Keep an Eye on Potential U.S. Tax Changes; Mike Trabold; July 16, 2014 3. "Forbes”; S Corporation SE Avoidance Still a Solid Strategy; Peter J Reilly; August 25, 2013 4. “Turbo Tax”; 6 Ways To Pay As Little Self-Employment Tax As Legally Necessary; Josh Ritchie; June 14, 2010 5. “U.S. Internal Revenue Service”; Appeals Pass-Through Entity Handbook; IRS Revenue Manual: Part 8, Chapter 19 6. “Federal Reserve Bank Board of Governors”; The Twelve Federal Reserve Districts 7. “Federal Reserve Bank Board of Governors”; Industrial Production and Capacity Utilization-G.17; January 16, 2015 8. “Federal Reserve Bank Board of Governors”; Consumer Credit Outstanding; September 10, 2012 9. “Federal Reserve Bank Board of Governors”; Reserve Balances Required, Maintained and Interest Rates Paid; February 6, 2014 10. “Federal Reserve Bank Board of Governors”; Credit and Liquidity Programs and Balance Sheet 11. “U.S. Federal Reserve System”; Bank of America Corporation; National Information Center 12. “Babson College”; How to Calculate Beta Using Excel 13. Zvi Bodei, Alex Kane and Alan J.Marcus. 'Investments' Mcraw-Hill Irwin. New York, 2002. P. 265-271 14. Eugene F. Brigham, and Joel F. Houston. Fundamentals of Financial Management 9th Ed. South-Western, 1999.p277-281. 15. Howard Bryan Bonham CPA, The complete Investment and Finance Dictionary. Avon Media Corporation, 2001.p.62 16. “Investopedia”; Commodity Channel Index 17. “Panda Cash”; Exponential Moving Average 18. “Stockcharts.com”; Commodity Channel Index 19. “Swingtradestocks.com”; How to Use Moving Averages 20. “Investopedia”; Relative Strength Index - RSI 21. “Forex Realm”; Relative Strength Index -RSI 22. “The Investment FAQ”; Technical Analysis: The Relative Strength Indicator; Unknown, Chris Lott and C.K. Krishnadas; June 14, 2008 Disclaimer: The content in this newsletter is for informational purposes only, and does not constitute financial planning or any other kind of advice, and should not be construed as such. Any opinions or statements expressed by cited third parties do not necessarily reflect those of Moneycation™. All information within this newsletter is to be used or not used at the sole discretion of the reader and its authenticity and accuracy are not guaranteed. The author of this newsletter assumes no liability for actions, decisions or events relating in any way to this newsletter's content. Copyright © 2014 Moneycation™; All Rights Reserved