1. GIS for Landscape Planning and Management
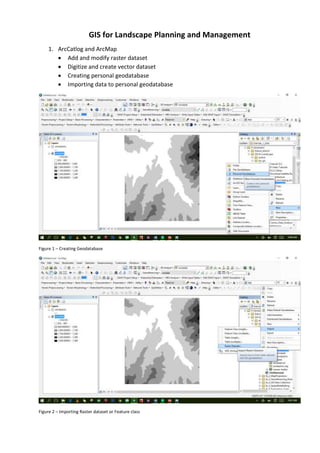
1. ArcCatlog and ArcMap
Add and modify raster dataset
Digitize and create vector dataset
Creating personal geodatabase
Importing data to personal geodatabase
Figure 1 – Creating Geodatabase
Figure 2 – Importing Raster dataset or Feature class
2. Figure 3 – Creating Shapefile
2. Georeferencing Data and use projections
Add point feature for location
Add raster data (eg: Toposheet)
Georeferencing using control points
Figure 4 – Georeferencing Toposheet
3. 3. Landsat data (LISS-III)
LISS-III Raster dataset (Location: Dahod, India)
LISS-III Metadata – 1 arc (30m) resolution. Source cartosat (bhuvan)
False colors output changing the band order
Figure 5 – Compilation of Raster dataset to carry out NDVI Analysis
Above image represents the Landuse/Landcover of the region which can be classified under
unsupervised or supervised classification.
THESIS
Topic: Integrated water resource management in semi-arid region - case: Dahod (a tribal
dominated district)
4. Dem Manipulation and Spatial Analysis
Dem clip
Spatial Analyst tools
4. Figure 6 – Dem Manipulation and contours
5. Dem Manipulation and Slope
5. Figure 7 – Slope Raster dataset with Slope (percent Rise class)
6. Village data and Analysis
Census data interpretation
Water resource Scenario
6. Figure 8 – Villages Drinking water source (surface water and ground water)
Village
population
To
understand
the demand
and supply
Distance
to water
resource
for village
people
7. 7. Well and Tubewell data (Groundwater)
To represent Groundwater depth and fluctuation (pre and post Monsoon)
And to represent Yield (m^3/s) Of well and hand pump (average throughout the year)
Figure 9 – Well & Hand-pump Data input in Attribute table; Analysis with respect to fluctuation (m) (seasonwise) and Yield (m^3/s)
8. Analysis of Natural layers (For Eg: Soil) to represent various characteristics with respect to
Erosion, Recharge Potential and Agriculture Suitability
For Soil: Characteristics like Soil Depth, Texture, Drainage Intensity, Permeability, Water
Holding Capacity, etc. are been included in Attribute table to carry Analysis and generate
maps accordingly
Such Analysis is been carried out for Landuse and Landcover, Geology, slope, and Hydrology.
Figure 10 – Soil Characteristics in excel file which will be imported to GIS to carry Analysis
8. Figure 11 – Soil Map which shows Soil Type and further map can be manipulated with respect to Soil Characteristics
9. Agriculture Suitability
Suitability with respect to slope class, Soil Characteristics
Figure 12 – Agriculture suitability map (Most suitable, moderately suitable & Not suitable zoning)
9. 10. Soil Erosion Risk zoning
Erosion w.r.t Slope, Soil Depth and Texture, Landuse/Landcover
Figure 13 – Soil Erosion class
11. Recharge Potential Zoning
With respect to Soil Characteristics, Geology, Landuse/Landcover
Figure 14 – Recharge Potential Zone Map
10. 12. Critical Zoning based on Soil Erosion Risk, Recharge Potential & Agriculture Suitability
Figure 15 - Critical zoning based on
rating system
And Overlay is done in ArcMap-GIS
11. REGIONAL PLANNING
13. Regional study of Mt. Abu, Rajasthan
Study of Natural layers: Topography, Slope, Geology, Soil, Vegetation Typology,
Vegetation Degradation, Fauna Habitat, Landuse/Landcover
Analysis based on overlaying natural layers w.r.t Soil Erosion, Vegetation Suitability,
Fauna Habitat Suitability
Figure 16 – Vegetation Typology with respect to Elevation
12. Figure 17 – Vegetation Degradation Map prepared from Google image, Ecological Survey at 3 locations
13. Figure 18 – Fauna Habitat Zone w.r.t data available from forest department report and Site observations
Figure 19 – Vegetation Suitability (Details are shown on next page)
14.
15. Figure 20 – Land suitability Map for Mt. Abu (Details are shown below)
16. GIS IN ENVIRONMENTAL PLANNING
14. GIS application in river monitoring : Case – Sabarmati river
Input test location as point shape file and add data of the test parameters
Display of data in various form (Eg: KML/KMZ; to view on Google Earth)
Figure 21 – Sabarmati River test location display on Google earth and display of test parameters of Kankaria Lake
15. GIS application in Groundwater monitoring
Input test location as point shape file and add data of the test parameters
Display of data in various form (Eg: KML/KMZ; to view on Google Earth)
Figure 22 – Groundwater data of selected talukas highlighted with Taluka boundary and disply of test parameters of Vatva – GIDC
17. 16. GIS application for contours generation of Groundwater depth
Groundwater depth data input in GIS and using interpolation tool to generate
contours
Exported the data in KML/KMZ as shown below
Figure 23 – Groundwater contours at 5m interval - Groundwater table depth in May 2014
Figure 24 - Groundwater contours at 5m interval - Groundwater table depth in October 2014
17. GIS application in City environment planning: Case – Ahmedabad city
Map making using various source data (Eg: AMC ward map, Road network map,
Toposheet, etc.)
18. Figure 25 – Ahmedabad City map digitized using ARCMap
19. 18. GIS application in Ecological Restoration: Case – Mangrove ecosystem of Gulf of Kutch
Digitization of various layers to carry out analysis with respect to ecological planning
Figure 26 – Digitization of natural layers of Gulf of Kutch – range of 10km from sea