May Market Watch 2021
•
0 gefällt mir•149 views

Full Market Report for May 2021 courtesy of TRREB.

Empfohlen
Weitere ähnliche Inhalte
Was ist angesagt?
Was ist angesagt? (20)
Ähnlich wie May Market Watch 2021
Ähnlich wie May Market Watch 2021 (20)
Mehr von Michelle Makos
Mehr von Michelle Makos (14)
Kürzlich hochgeladen
Kürzlich hochgeladen (20)
May Market Watch 2021
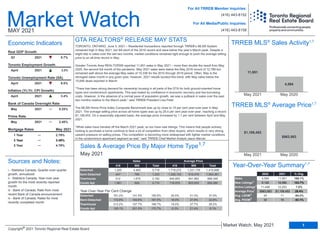
- 1. Sales New Listings Active Listings Average Price Avg. LDOM Avg. PDOM 4,594 11,951 160.1% 9,126 18,586 103.7% 11,448 12,253 7.0% $863,563 $1,108,453 28.4% 24 11 -54.2% 32 15 -53.1% 2020 2021 % Chg. Year Market Watch MAY 2021 Economic Indicators May 2021 GTA REALTORS® RELEASE MAY STATS TORONTO, ONTARIO, June 3, 2021 – Residential transactions reported through TRREB’s MLS® System remained high in May 2021, but fell short of the 2016 record and were below this year’s March peak. Despite a slight ebb in sales over the last two months, market conditions remained tight enough to push the average selling price to an all-time record in May. Greater Toronto Area REALTORS® reported 11,951 sales in May 2021 – more than double the result from May 2020, the second full month of the pandemic. May 2021 sales were below the May 2016 record of 12,789 but remained well above the average May sales of 10,336 for the 2010 through 2019 period. Often, May is the strongest sales month in any given year; however, 2021 results bucked this trend, with May sales below the 15,646 deals reported in March. “There has been strong demand for ownership housing in all parts of the GTA for both ground-oriented home types and condominium apartments. This was fueled by confidence in economic recovery and low borrowing costs. However, in the absence of a normal pace of population growth, we saw a pullback in sales over the past two months relative to the March peak,” said TRREB President Lisa Patel. The MLS® Home Price Index Composite Benchmark was up by close to 19 per cent year-over-year in May 2021. The average selling price across all home types was up by 28.4 per cent year-over-year, reaching a record $1,108,453. On a seasonally adjusted basis, the average price increased by 1.1 per cent between April and May 2021. “While sales have trended off the March 2021 peak, so too have new listings. This means that people actively looking to purchase a home continue to face a lot of competition from other buyers, which results in very strong upward pressure on selling prices. This competition is becoming more widespread with tighter market conditions in the condominium apartment segment as well,” said TRREB Chief Market Analyst Jason Mercer. Sources and Notes: i - Statistics Canada, Quarter-over-quarter growth, annualized ii - Statistics Canada, Year-over-year growth for the most recently reported month iii - Bank of Canada, Rate from most recent Bank of Canada announcement iv - Bank of Canada, Rates for most recently completed month For All TRREB Member Inquiries: For All Media/Public Inquiries: (416) 443-8152 (416) 443-8158 May 2020 May 2021 11,951 4,594 Detached Semi-Detached Townhouse Condo Apt 1,255 4,463 5,718 1,716,272 1,331,176 1,415,698 447 786 1,233 1,326,153 915,479 1,064,361 512 1,670 2,182 945,893 841,962 866,349 1,881 829 2,710 716,976 603,555 682,280 Sales Average Price 416 905 Total 416 905 Total Home Type Year-Over-Year Per Cent Change May 2020 May 2021 $1,108,453 $863,563 Detached Semi-Detached Townhouse Condo Apt 191.2% 141.5% 150.9% 20.5% 41.3% 37.0% 172.6% 164.6% 167.5% 16.0% 27.8% 22.6% 212.2% 157.7% 168.7% 19.0% 27.7% 26.2% 159.1% 201.5% 170.7% 6.3% 21.4% 9.1% TRREB MLS® Sales Activity1,7 TRREB MLS® Average Price1,7 Sales & Average Price By Major Home Type1,7 Year-Over-Year Summary1,7 May 2021 0.25% May 2021 2.45% 1 Year 2.79% 3 Year 3.49% 5 Year 4.79% April 2021 3.4% April 2021 9.5% April 2021 2.2% Q1 2021 5.7% Real GDP Growth Toronto Employment Growth Toronto Unemployment Rate (SA) Inflation (Yr./Yr. CPI Growth) Bank of Canada Overnight Rate Prime Rate 1 Market Watch, May 2021 Copyright® 2021 Toronto Regional Real Estate Board May 2021 Mortgage Rates 2 3 1 5 5
- 2. Toronto Regional Real Estate Board YEAR-TO-DATE, 2021 $0 to $99,999 $100,000 to $199,999 $200,000 to $299,999 $300,000 to $399,999 $400,000 to $499,999 $500,000 to $599,999 $600,000 to $699,999 $700,000 to $799,999 $800,000 to $899,999 $900,000 to $999,999 $1,000,000 to $1,249,999 $1,250,000 to $1,499,999 $1,500,000 to $1,749,999 $1,750,000 to $1,999,999 $2,000,000+ 0 0 0 0 0 0 0 0 0 0 1 0 0 0 1 0 0 0 0 2 2 0 0 0 6 0 0 0 1 9 12 0 0 1 35 0 0 0 0 48 25 2 0 27 301 0 1 0 2 358 52 10 6 121 864 0 0 0 2 1,055 119 58 84 269 681 7 1 4 0 1,223 291 113 231 269 328 14 0 2 1 1,249 481 224 325 162 196 16 0 3 1 1,408 629 317 228 45 97 16 1 1 0 1,334 1,259 286 215 35 111 21 0 2 0 1,929 1,143 93 84 17 36 7 1 2 0 1,383 622 77 20 12 23 1 0 0 0 755 362 16 7 3 15 0 0 0 0 403 719 37 15 6 16 0 0 1 0 794 Detached Semi-Detached Att/Row/Twnhouse Condo Townhouse Condo Apt Link Co-Op Apt Det Condo Co-Ownership Apt Total Name $0 to $99,999 $100,000 to $199,999 $200,000 to $299,999 $300,000 to $399,999 $400,000 to $499,999 $500,000 to $599,999 $600,000 to $699,999 $700,000 to $799,999 $800,000 to $899,999 $900,000 to $999,999 $1,000,000 to $1,249,999 $1,250,000 to $1,499,999 $1,500,000 to $1,749,999 $1,750,000 to $1,999,999 $2,000,000+ 0 0 0 0 4 0 0 0 0 4 1 0 0 0 24 0 1 0 0 26 11 0 0 2 47 0 8 0 1 69 32 0 4 15 276 0 12 1 12 352 91 6 4 182 2,303 0 8 0 9 2,603 292 44 31 610 4,830 3 6 3 7 5,826 651 248 369 1,225 3,756 23 11 13 3 6,299 1,394 442 1,031 1,282 1,686 49 1 6 1 5,892 2,307 1,109 1,507 702 1,005 77 4 7 2 6,720 3,036 1,439 1,101 223 559 68 4 8 0 6,438 6,241 1,262 1,041 213 478 118 1 5 0 9,359 5,466 432 339 72 193 36 4 4 0 6,546 3,002 269 100 37 92 2 1 1 0 3,504 1,661 109 29 15 54 1 2 1 0 1,872 3,265 134 50 18 96 0 0 1 0 3,564 Detached Semi-Detached Att/Row/Twnhouse Condo Townhouse Condo Apt Link Co-Op Apt Det Condo Co-Ownership Apt Total Name MAY 2021 SALES BY PRICE RANGE AND HOUSE TYPE 1,7 SALES BY PRICE RANGE AND HOUSE TYPE 1,7 Total Sales Share of Total Sales (%) Average Price ($) 5,718 1,233 1,215 967 2,710 82 4 15 7 11,951 47.8% 10.3% 10.2% 8.1% 22.7% 0.7% 0.0% 0.1% 0.1% 100.0% $1,415,698 $1,064,361 $949,983 $761,266 $682,280 $954,333 $889,975 $986,973 $546,571 $1,108,453 27,452 5,495 5,606 4,596 15,403 377 63 50 35 59,077 46.5% 9.3% 9.5% 7.8% 26.1% 0.6% 0.1% 0.1% 0.1% 100.0% $1,391,920 $1,051,890 $944,553 $750,072 $661,725 $973,417 $646,818 $905,321 $474,354 $1,073,104 Total Sales Share of Total Sales (%) Average Price ($)
- 3. TRREB Total 11,951 $13,247,118,659 $1,108,453 $945,000 18,586 65.0% 12,253 1.2 106% 11 15 Halton Region 1,197 $1,428,954,791 $1,193,780 $1,050,000 1,611 74.7% 916 0.9 104% 10 13 Burlington 368 $381,235,198 $1,035,965 $930,750 444 78.1% 230 0.9 105% 10 11 Halton Hills 109 $112,961,932 $1,036,348 $939,900 143 81.1% 85 0.7 107% 10 12 Milton 310 $329,406,018 $1,062,600 $955,000 434 76.3% 204 0.6 105% 9 14 Oakville 410 $605,351,643 $1,476,467 $1,297,500 590 69.7% 397 1.2 103% 11 15 Peel Region 2,379 $2,512,003,459 $1,055,907 $945,000 3,728 67.6% 2,179 1.0 104% 11 15 Brampton 1,174 $1,171,291,893 $997,693 $920,000 1,808 69.4% 960 0.8 104% 10 15 Caledon 134 $200,492,746 $1,496,215 $1,317,500 234 70.0% 178 1.2 101% 11 15 Mississauga 1,071 $1,140,218,820 $1,064,630 $945,000 1,686 65.4% 1,041 1.2 104% 11 15 City of Toronto 4,118 $4,598,718,991 $1,116,736 $890,000 7,051 57.5% 5,196 1.6 106% 12 16 Toronto West 1,072 $1,129,440,307 $1,053,582 $925,000 1,742 62.6% 1,210 1.3 107% 11 15 Toronto Central 1,933 $2,334,335,499 $1,207,623 $806,000 3,573 51.0% 3,047 2.1 104% 13 17 Toronto East 1,113 $1,134,943,185 $1,019,715 $950,000 1,736 67.3% 939 0.9 111% 10 13 York Region 2,192 $2,837,717,505 $1,294,579 $1,175,000 3,464 62.0% 2,668 1.5 104% 13 18 Aurora 134 $167,126,117 $1,247,210 $1,165,000 201 65.2% 152 1.3 103% 15 20 East Gwillimbury 80 $103,274,295 $1,290,929 $1,224,000 116 69.0% 81 1.2 105% 16 23 Georgina 127 $110,673,593 $871,446 $845,000 199 72.7% 143 1.0 110% 10 12 King 63 $135,901,199 $2,157,162 $1,955,000 97 60.5% 124 2.7 99% 24 31 Markham 569 $751,377,509 $1,320,523 $1,205,000 887 62.2% 610 1.3 107% 13 17 Newmarket 210 $220,036,502 $1,047,793 $999,900 241 70.9% 135 0.9 104% 12 16 Richmond Hill 367 $490,565,682 $1,336,691 $1,228,000 679 55.4% 615 1.9 103% 14 21 Vaughan 541 $727,569,876 $1,344,861 $1,230,000 895 58.8% 698 1.6 103% 12 17 Whitchurch-Stouffville 101 $131,192,732 $1,298,938 $1,092,000 149 68.0% 110 1.5 104% 10 16 Durham Region 1,574 $1,419,960,738 $902,135 $840,000 2,048 78.9% 889 0.6 112% 8 10 Ajax 227 $215,235,564 $948,174 $895,000 296 78.0% 113 0.5 111% 8 12 Brock 39 $29,229,046 $749,463 $740,000 41 82.8% 22 0.9 106% 11 17 Clarington 284 $249,924,746 $880,017 $799,500 330 82.3% 118 0.6 115% 7 8 Oshawa 462 $356,718,808 $772,119 $741,908 629 78.8% 294 0.6 114% 9 11 Pickering 184 $181,539,847 $986,630 $870,500 260 74.4% 131 0.8 109% 10 13 Scugog 43 $40,774,496 $948,244 $915,000 53 77.8% 39 1.3 111% 10 13 Uxbridge 36 $49,391,940 $1,371,998 $1,194,000 46 81.4% 34 1.1 106% 12 12 Whitby 299 $297,146,291 $993,800 $931,000 393 79.0% 138 0.5 112% 7 9 Dufferin County 70 $54,926,850 $784,669 $772,500 95 87.0% 44 0.5 106% 8 9 Orangeville 70 $54,926,850 $784,669 $772,500 95 87.0% 44 0.5 106% 8 9 Simcoe County 421 $394,836,325 $937,854 $860,000 589 78.9% 361 0.9 103% 12 15 Adjala-Tosorontio 26 $27,998,800 $1,076,877 $957,500 33 80.4% 27 1.2 101% 15 17 Bradford West Gwillimbury 99 $108,754,900 $1,098,534 $990,000 142 73.6% 74 0.8 103% 11 15 Essa 45 $35,985,299 $799,673 $730,000 54 88.4% 21 0.6 107% 8 10 Innisfil 126 $111,657,461 $886,170 $836,500 203 76.8% 154 1.1 104% 13 19 New Tecumseth 125 $110,439,865 $883,519 $840,000 157 82.3% 85 0.8 104% 11 14 Sub_Municipality # of Sales Dollar Volume Average Price Median Price New Listings SNLR (Trend) Active Listings Mos Inv (Trend) Avg. SP/LP Avg. LDOM Avg. PDOM Toronto Regional Real Estate Board SUMMARY OF EXISTING HOME TRANSACTIONS ALL TRREB AREAS ALL HOME TYPES, MAY 2021 1 1 1 2 8 3 9 4 5 3 Market Watch, May 2021 Copyright® 2021 Toronto Regional Real Estate Board 5
- 4. TRREB Total 11,951 $13,247,118,659 $1,108,453 $945,000 18,586 65.0% 12,253 1.2 106% 11 15 City of Toronto Total 4,118 $4,598,718,991 $1,116,736 $890,000 7,051 57.5% 5,196 1.6 106% 12 16 Toronto West 1,072 $1,129,440,307 $1,053,582 $925,000 1,742 62.6% 1,210 1.3 107% 11 15 Toronto W01 88 $121,987,600 $1,386,223 $1,185,000 104 64.6% 45 1.0 110% 10 12 Toronto W02 108 $134,030,399 $1,241,022 $1,245,000 181 69.0% 93 0.8 115% 8 9 Toronto W03 76 $77,960,489 $1,025,796 $1,015,000 118 63.4% 77 1.0 111% 9 13 Toronto W04 103 $94,770,027 $920,097 $850,000 188 59.7% 144 1.6 107% 12 17 Toronto W05 148 $124,676,244 $842,407 $896,000 222 64.1% 191 1.4 105% 15 19 Toronto W06 183 $179,801,878 $982,524 $859,000 336 57.7% 264 1.6 104% 13 18 Toronto W07 31 $48,162,717 $1,553,636 $1,418,000 47 60.7% 27 1.3 109% 7 7 Toronto W08 200 $232,955,319 $1,164,777 $893,500 320 62.5% 206 1.4 106% 11 15 Toronto W09 49 $50,390,924 $1,028,386 $900,000 86 61.7% 67 1.4 106% 14 17 Toronto W10 86 $64,704,710 $752,380 $630,000 140 67.0% 96 1.2 103% 12 16 Toronto Central 1,933 $2,334,335,499 $1,207,623 $806,000 3,573 51.0% 3,047 2.1 104% 13 17 Toronto C01 605 $546,774,090 $903,759 $730,000 1,098 47.9% 890 2.3 105% 12 17 Toronto C02 80 $150,967,110 $1,887,089 $1,552,000 179 44.6% 235 2.9 102% 17 24 Toronto C03 62 $120,857,632 $1,949,317 $1,562,500 130 57.9% 96 1.6 104% 9 13 Toronto C04 126 $293,091,816 $2,326,126 $2,210,000 195 57.1% 138 1.6 102% 11 14 Toronto C06 44 $52,591,843 $1,195,269 $877,500 75 56.9% 59 1.5 103% 11 13 Toronto C07 113 $135,708,420 $1,200,959 $865,000 240 53.1% 227 2.0 102% 14 18 Toronto C08 274 $234,075,536 $854,290 $726,500 558 46.5% 474 2.4 103% 12 17 Toronto C09 34 $80,417,600 $2,365,224 $1,800,000 65 50.9% 67 2.4 105% 14 16 Toronto C10 93 $106,288,539 $1,142,888 $830,000 187 54.3% 148 1.9 105% 10 14 Toronto C11 68 $92,970,830 $1,367,218 $915,000 113 57.9% 72 1.5 106% 12 15 Toronto C12 42 $125,157,088 $2,979,931 $2,472,000 62 46.7% 107 3.7 98% 22 38 Toronto C13 102 $126,958,137 $1,244,688 $917,500 132 60.5% 89 1.5 106% 16 20 Toronto C14 124 $124,816,331 $1,006,583 $679,000 265 53.5% 233 2.1 104% 12 16 Toronto C15 166 $143,660,527 $865,425 $671,500 274 58.8% 212 1.7 103% 12 17 Toronto East 1,113 $1,134,943,185 $1,019,715 $950,000 1,736 67.3% 939 0.9 111% 10 13 Toronto E01 120 $154,364,448 $1,286,370 $1,260,000 187 65.8% 86 0.8 117% 8 11 Toronto E02 88 $116,987,141 $1,329,399 $1,253,500 146 64.7% 68 0.9 113% 7 10 Toronto E03 147 $186,289,067 $1,267,273 $1,217,000 255 63.6% 123 0.9 112% 8 11 Toronto E04 117 $98,127,794 $838,699 $870,000 197 68.3% 110 0.8 109% 10 13 Toronto E05 111 $99,673,974 $897,964 $840,000 161 66.0% 117 1.1 108% 13 15 Toronto E06 47 $52,941,481 $1,126,414 $950,000 86 64.0% 46 1.1 109% 10 13 Toronto E07 103 $87,922,951 $853,621 $835,000 144 69.4% 88 1.0 110% 13 17 Toronto E08 68 $70,168,363 $1,031,888 $1,004,750 111 67.4% 72 1.2 107% 10 13 Toronto E09 135 $111,591,699 $826,605 $890,000 176 68.7% 90 1.0 110% 10 12 Toronto E10 79 $77,124,067 $976,254 $999,000 116 69.5% 61 1.0 107% 12 15 Toronto E11 98 $79,752,200 $813,798 $788,000 157 73.5% 78 0.8 108% 11 14 Municipality # of Sales Dollar Volume Average Price Median Price New Listings SNLR (Trend) Active Listings Mos Inv (Trend) Avg. SP/LP Avg. LDOM Avg. PDOM Toronto Regional Real Estate Board ALL HOME TYPES, MAY 2021 SUMMARY OF EXISTING HOME TRANSACTIONS CITY OF TORONTO MUNICIPAL BREAKDOWN 1 1 1 2 8 3 9 4 5 4 Market Watch, May 2021 Copyright® 2021 Toronto Regional Real Estate Board 5
- 5. TRREB Total 59,077 $63,395,755,550 $1,073,104 $925,000 86,755 106% 13 17 Halton Region 6,007 $7,276,039,256 $1,211,260 $1,065,000 8,238 106% 11 14 Burlington 1,704 $1,797,230,102 $1,054,713 $950,000 2,211 106% 12 13 Halton Hills 544 $592,717,162 $1,089,554 $980,000 722 108% 9 12 Milton 1,508 $1,571,145,334 $1,041,874 $955,000 2,173 107% 8 10 Oakville 2,251 $3,314,946,658 $1,472,655 $1,300,000 3,132 104% 12 17 Peel Region 11,993 $12,394,850,759 $1,033,507 $935,000 17,866 105% 10 14 Brampton 5,969 $6,009,492,584 $1,006,784 $935,000 9,143 105% 9 11 Caledon 650 $907,365,892 $1,395,948 $1,240,000 1,026 103% 12 15 Mississauga 5,374 $5,477,992,283 $1,019,351 $899,450 7,697 105% 12 17 City of Toronto 20,323 $21,266,259,520 $1,046,413 $825,000 30,030 106% 16 22 Toronto West 5,168 $5,145,850,690 $995,714 $875,000 7,483 107% 15 20 Toronto Central 10,186 $11,178,311,193 $1,097,419 $750,000 15,430 103% 18 26 Toronto East 4,969 $4,942,097,637 $994,586 $950,000 7,117 111% 11 14 York Region 10,852 $13,588,458,831 $1,252,162 $1,150,000 17,063 106% 14 19 Aurora 709 $901,026,366 $1,270,841 $1,165,000 1,080 105% 14 17 East Gwillimbury 462 $558,301,849 $1,208,446 $1,165,000 687 107% 13 16 Georgina 670 $563,313,904 $840,767 $800,000 1,004 107% 12 15 King 281 $568,268,278 $2,022,307 $1,900,000 495 98% 27 37 Markham 2,678 $3,372,983,908 $1,259,516 $1,189,500 4,097 108% 13 18 Newmarket 960 $1,032,529,564 $1,075,552 $1,018,000 1,413 107% 9 12 Richmond Hill 1,863 $2,464,691,156 $1,322,969 $1,222,000 3,191 105% 16 22 Vaughan 2,678 $3,424,787,229 $1,278,860 $1,184,500 4,286 104% 14 20 Whitchurch-Stouffville 551 $702,556,577 $1,275,057 $1,127,000 810 105% 16 21 Durham Region 7,446 $6,677,948,689 $896,850 $840,000 10,145 112% 8 10 Ajax 1,099 $1,051,030,459 $956,352 $905,000 1,553 112% 7 10 Brock 145 $108,853,623 $750,715 $730,000 189 106% 12 17 Clarington 1,383 $1,180,196,440 $853,360 $801,100 1,741 114% 8 10 Oshawa 2,165 $1,670,121,591 $771,419 $745,000 2,995 115% 8 10 Pickering 897 $904,267,090 $1,008,102 $900,000 1,310 109% 9 11 Scugog 173 $169,868,681 $981,900 $870,000 233 108% 17 20 Uxbridge 197 $242,850,099 $1,232,742 $1,080,000 247 106% 16 18 Whitby 1,387 $1,350,760,706 $973,872 $920,000 1,877 113% 7 8 Dufferin County 361 $284,147,538 $787,112 $775,000 447 108% 9 10 Orangeville 361 $284,147,538 $787,112 $775,000 447 108% 9 10 Simcoe County 2,095 $1,908,050,957 $910,764 $849,900 2,966 105% 12 14 Adjala-Tosorontio 121 $132,934,691 $1,098,634 $985,000 155 103% 17 18 Bradford West Gwillimbury 507 $524,408,540 $1,034,336 $970,000 757 106% 10 12 Essa 267 $211,371,348 $791,653 $730,000 329 105% 11 12 Innisfil 662 $583,835,556 $881,927 $810,500 989 104% 14 17 New Tecumseth 538 $455,500,822 $846,656 $810,000 736 104% 11 13 Sub_Municipality Number of Sales Dollar Volume Average Price Median Price New Listings Avg. SP/LP Avg. LDOM Avg. PDOM Toronto Regional Real Estate Board SUMMARY OF EXISTING HOME TRANSACTIONS ALL TRREB AREAS ALL HOME TYPES, YEAR-TO-DATE 2021 1 1 1 2 4 5 5 Market Watch, May 2021 Copyright® 2021 Toronto Regional Real Estate Board 5
- 6. TRREB Total 59,077 $63,395,755,550 $1,073,104 $925,000 86,755 106% 13 17 City of Toronto Total 20,323 $21,266,259,520 $1,046,413 $825,000 30,030 106% 16 22 Toronto West 5,168 $5,145,850,690 $995,714 $875,000 7,483 107% 15 20 Toronto W01 343 $435,297,777 $1,269,090 $980,000 439 111% 12 15 Toronto W02 495 $612,355,828 $1,237,082 $1,195,000 687 114% 9 13 Toronto W03 369 $372,037,413 $1,008,231 $982,000 565 112% 12 16 Toronto W04 534 $458,356,078 $858,345 $805,000 806 106% 17 23 Toronto W05 669 $553,686,504 $827,633 $855,000 1,005 106% 16 21 Toronto W06 943 $849,811,481 $901,179 $780,000 1,425 104% 16 22 Toronto W07 144 $222,277,056 $1,543,591 $1,445,000 207 107% 14 23 Toronto W08 990 $1,097,709,034 $1,108,797 $730,000 1,341 105% 16 21 Toronto W09 258 $238,637,750 $924,953 $882,500 394 106% 15 20 Toronto W10 423 $305,681,769 $722,652 $595,000 614 104% 15 20 Toronto Central 10,186 $11,178,311,193 $1,097,419 $750,000 15,430 103% 18 26 Toronto C01 3,282 $2,756,980,269 $840,031 $707,500 4,748 104% 19 28 Toronto C02 449 $726,049,990 $1,617,038 $1,210,000 844 102% 23 31 Toronto C03 297 $501,693,339 $1,689,203 $1,350,000 501 105% 14 19 Toronto C04 515 $1,138,595,608 $2,210,865 $2,150,000 794 103% 13 20 Toronto C06 218 $253,187,545 $1,161,411 $995,005 335 105% 13 19 Toronto C07 667 $743,184,179 $1,114,219 $790,000 1,067 103% 19 26 Toronto C08 1,526 $1,202,385,935 $787,933 $682,000 2,304 103% 20 28 Toronto C09 175 $379,852,065 $2,170,583 $1,580,000 268 101% 21 27 Toronto C10 502 $511,146,185 $1,018,219 $775,000 732 104% 18 28 Toronto C11 243 $291,534,550 $1,199,731 $680,000 401 105% 14 20 Toronto C12 191 $590,084,765 $3,089,449 $2,753,000 363 99% 22 34 Toronto C13 410 $516,766,054 $1,260,405 $915,000 618 105% 16 20 Toronto C14 759 $748,633,963 $986,343 $690,000 1,132 102% 18 26 Toronto C15 952 $818,216,746 $859,471 $660,000 1,323 105% 17 24 Toronto East 4,969 $4,942,097,637 $994,586 $950,000 7,117 111% 11 14 Toronto E01 516 $643,384,895 $1,246,870 $1,250,000 733 117% 9 12 Toronto E02 387 $560,577,291 $1,448,520 $1,328,000 563 113% 9 12 Toronto E03 571 $685,915,142 $1,201,252 $1,200,000 873 114% 9 12 Toronto E04 556 $477,291,065 $858,437 $880,000 809 110% 11 13 Toronto E05 449 $403,205,475 $898,008 $800,000 675 111% 12 14 Toronto E06 223 $258,112,345 $1,157,454 $1,050,000 343 109% 11 13 Toronto E07 533 $433,937,305 $814,141 $760,000 737 111% 11 14 Toronto E08 345 $336,054,094 $974,070 $900,000 492 108% 13 18 Toronto E09 599 $458,549,930 $765,526 $685,000 759 110% 14 19 Toronto E10 333 $334,644,222 $1,004,938 $995,000 496 108% 12 15 Toronto E11 457 $350,425,873 $766,796 $760,000 637 109% 11 13 Municipality Number of Sales Dollar Volume Average Price Median Price New Listings Avg. SP/LP Avg. LDOM Avg. PDOM Toronto Regional Real Estate Board SUMMARY OF EXISTING HOME TRANSACTIONS CITY OF TORONTO MUNICIPAL BREAKDOWN ALL HOME TYPES, YEAR-TO-DATE 2021 1 1 1 2 4 5 6 Market Watch, May 2021 Copyright® 2021 Toronto Regional Real Estate Board 5
- 7. TRREB Total 5,718 $8,094,962,362 $1,415,698 $1,245,000 8,838 5,668 105% 10 Halton Region 619 $942,479,309 $1,522,584 $1,375,000 855 513 104% 10 Burlington 167 $234,107,832 $1,401,843 $1,321,000 218 121 105% 9 Halton Hills 84 $95,781,419 $1,140,255 $1,058,750 115 67 107% 10 Milton 135 $180,290,806 $1,335,487 $1,275,000 192 103 104% 10 Oakville 233 $432,299,252 $1,855,362 $1,595,000 330 222 103% 11 Peel Region 1,136 $1,546,112,140 $1,361,014 $1,240,000 1,829 1,025 103% 10 Brampton 619 $733,936,978 $1,185,682 $1,105,000 1,031 515 104% 9 Caledon 106 $174,541,458 $1,646,618 $1,392,500 192 150 101% 11 Mississauga 411 $637,633,704 $1,551,420 $1,351,000 606 360 104% 11 City of Toronto 1,255 $2,153,921,884 $1,716,272 $1,395,000 2,126 1,479 106% 10 Toronto West 384 $575,070,832 $1,497,580 $1,300,000 637 427 108% 10 Toronto Central 381 $961,731,242 $2,524,229 $2,255,000 716 659 102% 12 Toronto East 490 $617,119,810 $1,259,428 $1,150,000 773 393 110% 10 York Region 1,273 $2,023,915,436 $1,589,879 $1,425,000 2,097 1,728 104% 13 Aurora 80 $118,524,841 $1,481,561 $1,400,500 112 100 102% 17 East Gwillimbury 71 $95,005,295 $1,338,103 $1,251,000 100 72 104% 16 Georgina 111 $100,200,293 $902,705 $875,000 170 116 111% 9 King 55 $128,669,199 $2,339,440 $2,080,000 87 116 99% 25 Markham 288 $497,774,818 $1,728,385 $1,555,000 462 342 106% 12 Newmarket 133 $157,384,853 $1,183,345 $1,150,000 152 89 105% 12 Richmond Hill 179 $323,992,254 $1,810,013 $1,638,000 400 414 102% 16 Vaughan 294 $503,345,351 $1,712,059 $1,500,000 507 389 102% 12 Whitchurch-Stouffville 62 $99,018,532 $1,597,073 $1,331,944 107 90 103% 9 Durham Region 1,051 $1,052,718,916 $1,001,636 $940,000 1,397 604 112% 8 Ajax 131 $140,302,736 $1,071,013 $1,018,000 166 64 111% 7 Brock 37 $28,249,146 $763,490 $745,000 40 22 106% 12 Clarington 199 $191,947,555 $964,561 $870,600 240 88 114% 7 Oshawa 301 $255,001,277 $847,180 $810,000 428 186 113% 8 Pickering 94 $118,012,247 $1,255,449 $1,150,000 137 81 109% 9 Scugog 42 $39,849,506 $948,798 $910,000 51 33 111% 10 Uxbridge 32 $46,308,040 $1,447,126 $1,305,000 39 29 106% 13 Whitby 215 $233,048,409 $1,083,946 $1,025,000 296 101 112% 7 Dufferin County 42 $37,468,050 $892,096 $875,000 57 23 106% 7 Orangeville 42 $37,468,050 $892,096 $875,000 57 23 106% 7 Simcoe County 342 $338,346,627 $989,318 $917,500 477 296 103% 12 Adjala-Tosorontio 26 $27,998,800 $1,076,877 $957,500 33 27 101% 15 Bradford West Gwillimbury 83 $95,999,900 $1,156,625 $1,075,000 119 63 102% 12 Essa 34 $28,703,099 $844,209 $757,500 40 15 107% 7 Innisfil 108 $99,722,161 $923,353 $864,500 176 132 104% 12 New Tecumseth 91 $85,922,667 $944,205 $900,000 109 59 104% 11 Municipality Number of Sales Dollar Volume Average Price Median Price New Listings Active Listings Avg. SP/LP Avg. LDOM DETACHED, MAY 2021 Toronto Regional Real Estate Board SUMMARY OF EXISTING HOME TRANSACTIONS ALL TRREB AREAS 1 1 2 4 5 1 1 3 7 Market Watch, May 2021 Copyright® 2021 Toronto Regional Real Estate Board
- 8. TRREB Total 5,718 $8,094,962,362 $1,415,698 $1,245,000 8,838 5,668 105% 10 City of Toronto 1,255 $2,153,921,884 $1,716,272 $1,395,000 2,126 1,479 106% 10 Toronto West 384 $575,070,832 $1,497,580 $1,300,000 637 427 108% 10 Toronto W01 22 $54,148,304 $2,461,287 $2,450,502 33 17 108% 10 Toronto W02 32 $52,614,512 $1,644,204 $1,536,256 50 28 115% 6 Toronto W03 36 $39,845,999 $1,106,833 $1,052,500 55 37 111% 10 Toronto W04 51 $61,211,815 $1,200,232 $1,150,714 99 83 107% 11 Toronto W05 34 $40,007,500 $1,176,691 $1,165,000 59 44 107% 11 Toronto W06 46 $66,832,202 $1,452,874 $1,254,000 80 59 105% 11 Toronto W07 23 $38,520,817 $1,674,818 $1,482,000 34 16 110% 6 Toronto W08 80 $149,842,158 $1,873,027 $1,702,500 123 69 107% 8 Toronto W09 23 $34,006,924 $1,478,562 $1,375,000 40 33 108% 12 Toronto W10 37 $38,040,601 $1,028,124 $961,000 64 41 103% 12 Toronto Central 381 $961,731,242 $2,524,229 $2,255,000 716 659 102% 12 Toronto C01 10 $22,921,453 $2,292,145 $2,140,000 23 20 108% 8 Toronto C02 15 $47,291,096 $3,152,740 $2,950,000 24 23 103% 25 Toronto C03 38 $93,450,468 $2,459,223 $2,202,500 66 47 103% 9 Toronto C04 94 $255,256,886 $2,715,499 $2,487,500 140 90 102% 10 Toronto C06 21 $37,750,696 $1,797,652 $1,401,111 42 32 103% 9 Toronto C07 42 $80,799,806 $1,923,805 $1,672,500 94 103 101% 14 Toronto C08 1 $1,390,000 $1,390,000 $1,390,000 9 6 99% 9 Toronto C09 10 $43,153,800 $4,315,380 $3,125,000 21 20 104% 14 Toronto C10 18 $38,867,400 $2,159,300 $1,887,700 33 27 103% 13 Toronto C11 24 $61,684,107 $2,570,171 $2,367,500 39 13 108% 4 Toronto C12 24 $104,133,888 $4,338,912 $3,694,500 41 86 98% 20 Toronto C13 37 $78,613,679 $2,124,694 $1,950,000 52 33 108% 9 Toronto C14 22 $52,261,888 $2,375,540 $2,145,000 76 93 103% 15 Toronto C15 25 $44,156,075 $1,766,243 $1,560,000 56 66 101% 14 Toronto East 490 $617,119,810 $1,259,428 $1,150,000 773 393 110% 10 Toronto E01 19 $30,544,000 $1,607,579 $1,445,000 27 11 115% 8 Toronto E02 29 $50,182,389 $1,730,427 $1,715,000 60 29 112% 7 Toronto E03 90 $128,082,825 $1,423,143 $1,314,500 155 75 110% 9 Toronto E04 51 $55,138,576 $1,081,149 $999,998 92 52 112% 8 Toronto E05 41 $51,444,664 $1,254,748 $1,200,100 64 39 109% 14 Toronto E06 34 $42,911,602 $1,262,106 $1,037,500 66 27 109% 7 Toronto E07 31 $37,084,100 $1,196,261 $1,150,000 44 31 110% 17 Toronto E08 36 $50,341,656 $1,398,379 $1,250,000 58 35 108% 7 Toronto E09 74 $75,092,899 $1,014,769 $990,000 82 33 111% 9 Toronto E10 50 $59,540,599 $1,190,812 $1,147,500 72 38 107% 10 Toronto E11 35 $36,756,500 $1,050,186 $975,000 53 23 108% 11 Municipality Number of Sales Dollar Volume Average Price Median Price New Listings Active Listings Avg. SP/LP Avg. LDOM DETACHED, MAY 2021 Toronto Regional Real Estate Board SUMMARY OF EXISTING HOME TRANSACTIONS CITY OF TORONTO MUNICIPAL BREAKDOWN 1 1 2 4 5 1 1 3 8 Market Watch, May 2021 Copyright® 2021 Toronto Regional Real Estate Board
- 9. TRREB Total 1,233 $1,312,357,318 $1,064,361 $968,000 1,733 809 110% 9 Halton Region 79 $76,634,047 $970,051 $955,000 109 47 107% 7 Burlington 21 $19,508,100 $928,957 $945,000 34 14 110% 5 Halton Hills 5 $4,057,375 $811,475 $808,000 9 7 105% 5 Milton 41 $38,894,072 $948,636 $945,000 55 21 104% 9 Oakville 12 $14,174,500 $1,181,208 $1,190,750 11 5 110% 6 Peel Region 402 $372,951,346 $927,740 $924,000 561 247 106% 9 Brampton 230 $204,744,809 $890,195 $885,000 305 136 105% 10 Caledon 7 $6,977,000 $996,714 $1,007,000 13 7 105% 6 Mississauga 165 $161,229,537 $977,149 $968,000 243 104 108% 9 City of Toronto 447 $592,790,540 $1,326,153 $1,189,000 691 363 113% 9 Toronto West 143 $162,878,779 $1,139,012 $1,040,000 216 114 112% 11 Toronto Central 140 $227,197,505 $1,622,839 $1,500,000 218 134 110% 10 Toronto East 164 $202,714,256 $1,236,063 $1,179,950 257 115 117% 7 York Region 166 $168,135,575 $1,012,865 $1,025,000 211 103 106% 10 Aurora 13 $11,931,000 $917,769 $935,000 17 9 104% 12 East Gwillimbury 3 $2,901,000 $967,000 $940,000 10 7 112% 13 Georgina 1 $769,000 $769,000 $769,000 1 1 99% 19 King 1 $1,195,000 $1,195,000 $1,195,000 2 1 100% 1 Markham 36 $39,994,500 $1,110,958 $1,089,950 43 17 111% 12 Newmarket 33 $26,987,650 $817,808 $810,850 35 13 104% 9 Richmond Hill 24 $25,002,850 $1,041,785 $1,037,500 29 21 104% 13 Vaughan 50 $54,585,775 $1,091,716 $1,062,500 66 29 106% 8 Whitchurch-Stouffville 5 $4,768,800 $953,760 $930,000 8 5 110% 5 Durham Region 113 $82,781,910 $732,583 $713,000 130 35 116% 7 Ajax 20 $17,234,000 $861,700 $857,750 26 9 107% 9 Brock 0 $0 $0 - 0 0 - - Clarington 10 $6,490,400 $649,040 $676,500 9 2 119% 6 Oshawa 66 $44,975,410 $681,446 $687,250 73 20 120% 7 Pickering 10 $8,485,600 $848,560 $857,500 17 4 113% 8 Scugog 0 $0 $0 - 1 0 - - Uxbridge 0 $0 $0 - 0 0 - - Whitby 7 $5,596,500 $799,500 $790,000 4 0 118% 7 Dufferin County 12 $8,076,900 $673,075 $658,750 12 6 103% 9 Orangeville 12 $8,076,900 $673,075 $658,750 12 6 103% 9 Simcoe County 14 $10,987,000 $784,786 $787,500 19 8 105% 8 Adjala-Tosorontio 0 $0 $0 - 0 0 - - Bradford West Gwillimbury 6 $5,269,000 $878,167 $908,750 8 3 107% 6 Essa 0 $0 $0 - 1 1 - - Innisfil 0 $0 $0 - 0 0 - - New Tecumseth 8 $5,718,000 $714,750 $670,000 10 4 103% 10 Municipality Number of Sales Dollar Volume Average Price Median Price New Listings Active Listings Avg. SP/LP Avg. LDOM SEMI-DETACHED, MAY 2021 Toronto Regional Real Estate Board SUMMARY OF EXISTING HOME TRANSACTIONS ALL TRREB AREAS 1 1 2 4 5 1 1 3 9 Market Watch, May 2021 Copyright® 2021 Toronto Regional Real Estate Board
- 10. TRREB Total 1,233 $1,312,357,318 $1,064,361 $968,000 1,733 809 110% 9 City of Toronto 447 $592,790,540 $1,326,153 $1,189,000 691 363 113% 9 Toronto West 143 $162,878,779 $1,139,012 $1,040,000 216 114 112% 11 Toronto W01 17 $27,664,100 $1,627,300 $1,645,000 19 6 117% 8 Toronto W02 24 $32,149,800 $1,339,575 $1,302,500 51 22 120% 9 Toronto W03 24 $26,720,202 $1,113,342 $1,100,000 46 29 114% 8 Toronto W04 7 $6,776,777 $968,111 $940,000 10 5 108% 11 Toronto W05 42 $39,339,400 $936,652 $933,500 54 38 103% 17 Toronto W06 14 $16,031,000 $1,145,071 $1,030,000 21 9 109% 8 Toronto W07 1 $885,000 $885,000 $885,000 1 0 111% 6 Toronto W08 6 $6,019,500 $1,003,250 $1,012,750 6 2 113% 6 Toronto W09 4 $3,781,000 $945,250 $895,000 3 1 107% 9 Toronto W10 4 $3,512,000 $878,000 $871,000 5 2 112% 5 Toronto Central 140 $227,197,505 $1,622,839 $1,500,000 218 134 110% 10 Toronto C01 32 $56,207,083 $1,756,471 $1,630,500 53 34 114% 8 Toronto C02 15 $40,104,293 $2,673,620 $2,400,000 23 22 104% 20 Toronto C03 13 $17,721,276 $1,363,175 $1,425,000 30 15 115% 4 Toronto C04 8 $13,603,112 $1,700,389 $1,590,000 12 7 110% 9 Toronto C06 1 $950,000 $950,000 $950,000 1 2 106% 14 Toronto C07 10 $11,792,450 $1,179,245 $1,172,500 13 6 106% 11 Toronto C08 9 $16,118,000 $1,790,889 $1,900,000 12 8 109% 14 Toronto C09 5 $14,500,000 $2,900,000 $2,875,000 5 3 114% 20 Toronto C10 14 $20,447,051 $1,460,504 $1,487,500 17 4 116% 6 Toronto C11 7 $9,449,500 $1,349,929 $1,308,000 4 3 114% 9 Toronto C12 0 $0 $0 - 0 0 - - Toronto C13 8 $7,594,900 $949,363 $951,500 19 12 107% 5 Toronto C14 0 $0 $0 - 0 1 - - Toronto C15 18 $18,709,840 $1,039,436 $1,000,000 29 17 106% 13 Toronto East 164 $202,714,256 $1,236,063 $1,179,950 257 115 117% 7 Toronto E01 50 $72,331,648 $1,446,633 $1,435,012 73 30 120% 5 Toronto E02 34 $45,691,276 $1,343,861 $1,219,000 39 12 117% 6 Toronto E03 38 $46,569,013 $1,225,500 $1,228,500 67 27 121% 7 Toronto E04 5 $4,330,000 $866,000 $845,000 12 8 106% 8 Toronto E05 7 $6,752,420 $964,631 $948,420 7 8 101% 16 Toronto E06 4 $3,496,899 $874,225 $893,450 7 3 113% 6 Toronto E07 8 $7,591,000 $948,875 $948,500 20 9 113% 11 Toronto E08 2 $1,760,000 $880,000 $880,000 1 0 105% 22 Toronto E09 5 $4,230,000 $846,000 $850,000 6 2 107% 10 Toronto E10 4 $3,357,000 $839,250 $835,000 6 3 109% 8 Toronto E11 7 $6,605,000 $943,571 $935,000 19 13 109% 4 Municipality Number of Sales Dollar Volume Average Price Median Price New Listings Active Listings Avg. SP/LP Avg. LDOM SEMI-DETACHED, MAY 2021 Toronto Regional Real Estate Board SUMMARY OF EXISTING HOME TRANSACTIONS CITY OF TORONTO MUNICIPAL BREAKDOWN 1 1 2 4 5 1 1 3 10 Market Watch, May 2021 Copyright® 2021 Toronto Regional Real Estate Board
- 11. TRREB Total 1,215 $1,154,229,694 $949,983 $880,000 1,620 867 108% 10 Halton Region 236 $221,891,289 $940,217 $890,000 288 129 107% 8 Burlington 43 $37,513,150 $872,399 $850,000 34 8 103% 9 Halton Hills 7 $5,695,388 $813,627 $825,000 9 5 108% 6 Milton 110 $95,076,085 $864,328 $855,000 133 46 107% 7 Oakville 76 $83,606,666 $1,100,088 $1,074,625 112 70 107% 9 Peel Region 223 $188,732,405 $846,334 $835,000 317 181 105% 11 Brampton 165 $134,870,805 $817,399 $820,000 239 140 104% 12 Caledon 18 $15,855,500 $880,861 $872,500 25 16 104% 13 Mississauga 40 $38,006,100 $950,153 $950,000 53 25 109% 9 City of Toronto 174 $213,435,265 $1,226,639 $1,112,995 255 147 108% 10 Toronto West 52 $61,267,902 $1,178,229 $1,176,261 61 35 109% 11 Toronto Central 51 $81,390,634 $1,595,895 $1,498,888 94 71 105% 12 Toronto East 71 $70,776,729 $996,855 $900,000 100 41 112% 9 York Region 321 $333,099,248 $1,037,692 $995,000 435 264 108% 12 Aurora 18 $18,000,276 $1,000,015 $975,500 35 16 108% 9 East Gwillimbury 6 $5,368,000 $894,667 $934,500 6 2 104% 14 Georgina 12 $8,212,500 $684,375 $690,000 11 4 105% 7 King 2 $1,995,000 $997,500 $997,500 4 3 114% 9 Markham 80 $88,740,080 $1,109,251 $1,100,000 105 64 113% 14 Newmarket 31 $27,462,000 $885,871 $879,000 34 22 104% 13 Richmond Hill 68 $73,646,892 $1,083,043 $1,069,000 96 62 108% 11 Vaughan 86 $93,156,500 $1,083,215 $1,067,500 124 82 105% 11 Whitchurch-Stouffville 18 $16,518,000 $917,667 $913,500 20 9 110% 12 Durham Region 212 $162,656,788 $767,249 $761,000 251 109 112% 8 Ajax 53 $42,699,600 $805,653 $815,000 62 21 110% 10 Brock 0 $0 $0 - 0 0 - - Clarington 40 $28,007,500 $700,188 $698,250 41 13 117% 6 Oshawa 36 $25,559,204 $709,978 $710,500 44 26 110% 8 Pickering 22 $17,719,000 $805,409 $800,500 31 13 110% 10 Scugog 1 $924,990 $924,990 $924,990 0 5 100% 34 Uxbridge 3 $2,378,900 $792,967 $810,000 3 2 115% 7 Whitby 57 $45,367,594 $795,923 $800,000 70 29 113% 7 Dufferin County 8 $5,855,000 $731,875 $765,000 16 9 106% 7 Orangeville 8 $5,855,000 $731,875 $765,000 16 9 106% 7 Simcoe County 41 $28,559,699 $696,578 $685,000 58 28 105% 9 Adjala-Tosorontio 0 $0 $0 - 0 0 - - Bradford West Gwillimbury 7 $5,739,000 $819,857 $850,000 11 6 105% 13 Essa 7 $4,333,200 $619,029 $625,000 10 4 113% 4 Innisfil 11 $7,425,000 $675,000 $668,000 15 8 102% 8 New Tecumseth 16 $11,062,499 $691,406 $695,000 22 10 103% 10 Municipality Number of Sales Dollar Volume Average Price Median Price New Listings Active Listings Avg. SP/LP Avg. LDOM ATT/ROW/TWNHOUSE, MAY 2021 Toronto Regional Real Estate Board SUMMARY OF EXISTING HOME TRANSACTIONS ALL TRREB AREAS 1 1 2 4 5 1 1 3 11 Market Watch, May 2021 Copyright® 2021 Toronto Regional Real Estate Board
- 12. TRREB Total 1,215 $1,154,229,694 $949,983 $880,000 1,620 867 108% 10 City of Toronto 174 $213,435,265 $1,226,639 $1,112,995 255 147 108% 10 Toronto West 52 $61,267,902 $1,178,229 $1,176,261 61 35 109% 11 Toronto W01 4 $6,165,880 $1,541,470 $1,423,500 1 1 114% 15 Toronto W02 15 $18,867,000 $1,257,800 $1,270,000 15 7 119% 7 Toronto W03 1 $950,000 $950,000 $950,000 4 3 95% 19 Toronto W04 3 $2,935,600 $978,533 $1,023,100 0 0 121% 21 Toronto W05 13 $12,126,900 $932,838 $897,000 15 13 104% 14 Toronto W06 5 $6,140,900 $1,228,180 $1,250,000 7 5 101% 21 Toronto W07 5 $6,596,100 $1,319,220 $1,418,000 6 1 107% 6 Toronto W08 5 $6,595,522 $1,319,104 $1,176,522 6 1 100% 5 Toronto W09 0 $0 $0 - 5 3 - - Toronto W10 1 $890,000 $890,000 $890,000 2 1 101% 7 Toronto Central 51 $81,390,634 $1,595,895 $1,498,888 94 71 105% 12 Toronto C01 19 $30,016,500 $1,579,816 $1,525,000 34 22 112% 10 Toronto C02 7 $14,830,000 $2,118,571 $2,290,000 14 13 103% 9 Toronto C03 1 $1,888,888 $1,888,888 $1,888,888 1 1 95% 5 Toronto C04 4 $7,563,500 $1,890,875 $1,987,500 7 4 95% 17 Toronto C06 0 $0 $0 - 1 1 - - Toronto C07 2 $2,530,888 $1,265,444 $1,265,444 4 5 103% 16 Toronto C08 9 $11,715,000 $1,301,667 $1,175,000 23 17 97% 11 Toronto C09 1 $2,356,000 $2,356,000 $2,356,000 1 0 118% 2 Toronto C10 1 $1,651,000 $1,651,000 $1,651,000 1 0 114% 4 Toronto C11 0 $0 $0 - 0 0 - - Toronto C12 0 $0 $0 - 1 3 - - Toronto C13 4 $4,741,970 $1,185,493 $1,182,990 2 1 101% 28 Toronto C14 3 $4,096,888 $1,365,629 $1,343,000 5 4 105% 9 Toronto C15 0 $0 $0 - 0 0 - - Toronto East 71 $70,776,729 $996,855 $900,000 100 41 112% 9 Toronto E01 15 $20,543,000 $1,369,533 $1,348,500 24 12 120% 7 Toronto E02 6 $6,980,000 $1,163,333 $1,087,500 7 1 113% 6 Toronto E03 4 $3,360,229 $840,057 $870,115 8 4 108% 9 Toronto E04 12 $10,655,500 $887,958 $902,500 19 10 104% 9 Toronto E05 5 $4,652,000 $930,400 $940,000 5 2 111% 9 Toronto E06 0 $0 $0 - 0 0 - - Toronto E07 8 $6,705,000 $838,125 $830,000 4 1 111% 12 Toronto E08 3 $2,779,000 $926,333 $985,000 3 1 109% 9 Toronto E09 3 $2,571,000 $857,000 $871,000 3 0 107% 11 Toronto E10 4 $3,478,800 $869,700 $859,400 6 1 109% 9 Toronto E11 11 $9,052,200 $822,927 $785,000 21 9 109% 8 Municipality Number of Sales Dollar Volume Average Price Median Price New Listings Active Listings Avg. SP/LP Avg. LDOM ATT/ROW/TWNHOUSE, MAY 2021 Toronto Regional Real Estate Board SUMMARY OF EXISTING HOME TRANSACTIONS CITY OF TORONTO MUNICIPAL BREAKDOWN 1 1 2 4 5 1 1 3 12 Market Watch, May 2021 Copyright® 2021 Toronto Regional Real Estate Board
- 13. TRREB Total 967 $736,144,034 $761,266 $720,000 1,510 972 105% 12 Halton Region 118 $95,019,185 $805,247 $729,175 142 69 105% 11 Burlington 60 $44,861,398 $747,690 $725,000 69 28 106% 9 Halton Hills 8 $4,897,250 $612,156 $625,625 6 2 106% 11 Milton 10 $6,906,000 $690,600 $662,500 19 14 104% 11 Oakville 40 $38,354,537 $958,863 $779,000 48 25 104% 15 Peel Region 292 $215,437,667 $737,800 $730,000 442 271 104% 12 Brampton 95 $62,969,401 $662,836 $648,000 129 95 103% 14 Caledon 1 $745,000 $745,000 $745,000 0 2 106% 17 Mississauga 196 $151,723,266 $774,098 $750,000 313 174 104% 11 City of Toronto 338 $270,862,133 $801,367 $735,000 587 418 106% 12 Toronto West 102 $75,165,392 $736,916 $688,510 176 131 106% 11 Toronto Central 118 $111,071,217 $941,282 $792,778 222 181 104% 13 Toronto East 118 $84,625,524 $717,165 $703,445 189 106 109% 12 York Region 106 $85,556,717 $807,139 $783,000 171 129 104% 14 Aurora 13 $11,511,500 $885,500 $786,000 24 15 102% 16 East Gwillimbury 0 $0 $0 - 0 0 - - Georgina 1 $549,900 $549,900 $549,900 3 4 100% 18 King 0 $0 $0 - 0 1 - - Markham 39 $31,015,400 $795,267 $780,000 74 50 105% 12 Newmarket 8 $5,577,999 $697,250 $702,500 14 6 106% 13 Richmond Hill 19 $15,809,018 $832,054 $854,000 24 27 106% 15 Vaughan 21 $17,570,500 $836,690 $800,000 28 24 102% 15 Whitchurch-Stouffville 5 $3,522,400 $704,480 $725,000 4 2 105% 11 Durham Region 108 $66,380,333 $614,633 $620,000 158 77 109% 10 Ajax 12 $7,936,828 $661,402 $645,000 25 10 106% 10 Brock 2 $979,900 $489,950 $489,950 1 0 101% 4 Clarington 7 $4,947,300 $706,757 $665,000 8 2 108% 7 Oshawa 42 $22,517,417 $536,129 $550,000 63 39 112% 11 Pickering 35 $23,418,000 $669,086 $665,000 45 18 106% 11 Scugog 0 $0 $0 - 1 1 - - Uxbridge 1 $705,000 $705,000 $705,000 2 1 101% 6 Whitby 9 $5,875,888 $652,876 $693,000 13 6 115% 7 Dufferin County 4 $2,158,000 $539,500 $526,250 7 5 103% 9 Orangeville 4 $2,158,000 $539,500 $526,250 7 5 103% 9 Simcoe County 1 $729,999 $729,999 $729,999 3 3 100% 13 Adjala-Tosorontio 0 $0 $0 - 0 0 - - Bradford West Gwillimbury 0 $0 $0 - 0 0 - - Essa 0 $0 $0 - 0 0 - - Innisfil 0 $0 $0 - 2 2 - - New Tecumseth 1 $729,999 $729,999 $729,999 1 1 100% 13 Municipality Number of Sales Dollar Volume Average Price Median Price New Listings Active Listings Avg. SP/LP Avg. LDOM CONDO TOWNHOUSE, MAY 2021 Toronto Regional Real Estate Board SUMMARY OF EXISTING HOME TRANSACTIONS ALL TRREB AREAS 1 1 2 4 5 1 1 3 13 Market Watch, May 2021 Copyright® 2021 Toronto Regional Real Estate Board
- 14. TRREB Total 967 $736,144,034 $761,266 $720,000 1,510 972 105% 12 City of Toronto 338 $270,862,133 $801,367 $735,000 587 418 106% 12 Toronto West 102 $75,165,392 $736,916 $688,510 176 131 106% 11 Toronto W01 7 $6,115,725 $873,675 $850,725 7 2 110% 7 Toronto W02 15 $14,361,788 $957,453 $950,000 30 15 111% 6 Toronto W03 5 $3,810,888 $762,178 $778,000 6 3 101% 8 Toronto W04 11 $7,155,347 $650,486 $645,000 23 18 108% 9 Toronto W05 30 $19,310,144 $643,671 $648,750 46 39 106% 13 Toronto W06 10 $7,960,000 $796,000 $856,000 23 20 103% 13 Toronto W07 0 $0 $0 - 1 1 - - Toronto W08 17 $11,976,000 $704,471 $650,000 28 20 105% 11 Toronto W09 3 $2,185,000 $728,333 $680,000 3 3 98% 13 Toronto W10 4 $2,290,500 $572,625 $575,000 9 10 108% 10 Toronto Central 118 $111,071,217 $941,282 $792,778 222 181 104% 13 Toronto C01 32 $30,886,700 $965,209 $802,500 63 44 106% 10 Toronto C02 3 $4,126,000 $1,375,333 $1,554,000 9 14 107% 5 Toronto C03 1 $1,100,000 $1,100,000 $1,100,000 2 4 96% 8 Toronto C04 2 $1,442,000 $721,000 $721,000 0 0 99% 15 Toronto C06 2 $1,590,200 $795,100 $795,100 2 4 103% 10 Toronto C07 9 $6,851,888 $761,321 $750,000 27 27 109% 14 Toronto C08 8 $7,328,900 $916,113 $754,950 24 17 108% 15 Toronto C09 3 $3,802,000 $1,267,333 $1,190,000 1 3 99% 12 Toronto C10 7 $7,363,000 $1,051,857 $865,000 8 3 100% 11 Toronto C11 6 $5,047,000 $841,167 $850,000 8 9 97% 29 Toronto C12 6 $8,334,000 $1,389,000 $1,177,000 10 8 98% 31 Toronto C13 4 $4,173,000 $1,043,250 $1,039,000 5 3 107% 19 Toronto C14 12 $11,075,055 $922,921 $797,778 23 14 107% 12 Toronto C15 23 $17,951,474 $780,499 $760,000 40 31 103% 11 Toronto East 118 $84,625,524 $717,165 $703,445 189 106 109% 12 Toronto E01 11 $10,349,000 $940,818 $907,000 20 8 109% 6 Toronto E02 6 $4,661,088 $776,848 $773,544 12 5 110% 12 Toronto E03 2 $1,249,500 $624,750 $624,750 2 1 97% 11 Toronto E04 14 $10,011,888 $715,135 $710,000 27 16 108% 11 Toronto E05 19 $13,992,790 $736,463 $723,000 27 22 112% 12 Toronto E06 1 $1,199,990 $1,199,990 $1,199,990 0 1 100% 32 Toronto E07 8 $6,278,000 $784,750 $787,500 9 5 113% 12 Toronto E08 7 $4,425,000 $632,143 $614,000 12 8 104% 15 Toronto E09 10 $6,461,000 $646,100 $690,000 16 10 111% 10 Toronto E10 11 $6,814,268 $619,479 $595,000 23 13 105% 13 Toronto E11 29 $19,183,000 $661,483 $655,000 41 17 108% 12 Municipality Number of Sales Dollar Volume Average Price Median Price New Listings Active Listings Avg. SP/LP Avg. LDOM CONDO TOWNHOUSE, MAY 2021 Toronto Regional Real Estate Board SUMMARY OF EXISTING HOME TRANSACTIONS CITY OF TORONTO MUNICIPAL BREAKDOWN 1 1 2 4 5 1 1 3 14 Market Watch, May 2021 Copyright® 2021 Toronto Regional Real Estate Board
- 15. TRREB Total 2,710 $1,848,979,475 $682,280 $617,250 4,727 3,833 103% 13 Halton Region 139 $85,589,273 $615,750 $565,000 208 156 102% 13 Burlington 75 $43,989,818 $586,531 $535,000 88 58 102% 13 Halton Hills 5 $2,530,500 $506,100 $475,000 4 4 99% 8 Milton 14 $8,239,055 $588,504 $567,500 35 20 104% 13 Oakville 45 $30,829,900 $685,109 $598,000 81 74 101% 14 Peel Region 315 $177,679,513 $564,062 $549,000 553 438 101% 14 Brampton 60 $30,272,400 $504,540 $499,000 90 64 101% 15 Caledon 1 $874,900 $874,900 $874,900 2 2 101% 27 Mississauga 254 $146,532,213 $576,898 $555,000 461 372 101% 13 City of Toronto 1,881 $1,348,632,169 $716,976 $639,000 3,351 2,754 103% 13 Toronto West 389 $254,309,402 $653,752 $595,000 645 497 103% 13 Toronto Central 1,235 $946,580,901 $766,462 $678,000 2,302 1,977 103% 13 Toronto East 257 $147,741,866 $574,871 $550,000 404 280 105% 12 York Region 302 $198,307,729 $656,648 $628,100 517 410 102% 15 Aurora 9 $6,238,500 $693,167 $630,000 12 12 101% 16 East Gwillimbury 0 $0 $0 - 0 0 - - Georgina 2 $941,900 $470,950 $470,950 14 18 99% 66 King 4 $2,592,000 $648,000 $661,500 2 2 97% 26 Markham 111 $75,410,411 $679,373 $630,000 186 130 103% 14 Newmarket 5 $2,624,000 $524,800 $536,000 6 5 103% 7 Richmond Hill 71 $45,212,168 $636,791 $620,000 123 87 103% 13 Vaughan 90 $58,911,750 $654,575 $629,500 167 154 101% 16 Whitchurch-Stouffville 10 $6,377,000 $637,700 $649,000 7 2 103% 15 Durham Region 59 $31,342,091 $531,222 $530,000 77 55 109% 8 Ajax 5 $2,435,900 $487,180 $515,900 10 7 110% 9 Brock 0 $0 $0 - 0 0 - - Clarington 13 $6,811,191 $523,938 $530,000 18 11 114% 7 Oshawa 13 $5,917,500 $455,192 $405,000 14 20 112% 12 Pickering 21 $12,307,500 $586,071 $550,000 27 13 106% 7 Scugog 0 $0 $0 - 0 0 - - Uxbridge 0 $0 $0 - 2 2 - - Whitby 7 $3,870,000 $552,857 $540,000 6 2 105% 7 Dufferin County 4 $1,368,900 $342,225 $358,950 3 1 102% 12 Orangeville 4 $1,368,900 $342,225 $358,950 3 1 102% 12 Simcoe County 10 $6,059,800 $605,980 $552,500 18 19 101% 26 Adjala-Tosorontio 0 $0 $0 - 0 0 - - Bradford West Gwillimbury 2 $937,000 $468,500 $468,500 2 1 115% 6 Essa 0 $0 $0 - 0 0 - - Innisfil 6 $3,782,800 $630,467 $592,500 10 12 98% 36 New Tecumseth 2 $1,340,000 $670,000 $670,000 6 6 103% 19 Municipality Number of Sales Dollar Volume Average Price Median Price New Listings Active Listings Avg. SP/LP Avg. LDOM CONDO APT, MAY 2021 Toronto Regional Real Estate Board SUMMARY OF EXISTING HOME TRANSACTIONS ALL TRREB AREAS 1 1 2 4 5 1 1 3 15 Market Watch, May 2021 Copyright® 2021 Toronto Regional Real Estate Board
- 16. TRREB Total 2,710 $1,848,979,475 $682,280 $617,250 4,727 3,833 103% 13 City of Toronto 1,881 $1,348,632,169 $716,976 $639,000 3,351 2,754 103% 13 Toronto West 389 $254,309,402 $653,752 $595,000 645 497 103% 13 Toronto W01 38 $27,893,591 $734,042 $670,000 44 19 106% 11 Toronto W02 22 $16,037,299 $728,968 $622,500 35 21 103% 10 Toronto W03 10 $6,633,400 $663,340 $727,500 7 5 100% 11 Toronto W04 31 $16,690,488 $538,403 $540,000 56 38 104% 12 Toronto W05 28 $13,609,300 $486,046 $509,500 46 55 100% 16 Toronto W06 107 $82,372,776 $769,839 $700,000 201 168 103% 15 Toronto W07 2 $2,160,800 $1,080,400 $1,080,400 5 9 98% 13 Toronto W08 92 $58,522,139 $636,110 $582,925 156 113 102% 13 Toronto W09 19 $10,418,000 $548,316 $500,000 35 27 101% 18 Toronto W10 40 $19,971,609 $499,290 $510,000 60 42 102% 14 Toronto Central 1,235 $946,580,901 $766,462 $678,000 2,302 1,977 103% 13 Toronto C01 510 $404,836,354 $793,797 $700,000 922 768 103% 13 Toronto C02 39 $43,955,721 $1,127,070 $831,000 106 160 99% 14 Toronto C03 9 $6,697,000 $744,111 $635,000 29 27 99% 17 Toronto C04 17 $14,682,318 $863,666 $750,000 33 33 101% 16 Toronto C06 20 $12,300,947 $615,047 $608,450 29 20 104% 12 Toronto C07 50 $33,733,388 $674,668 $669,500 102 86 102% 13 Toronto C08 245 $196,568,636 $802,321 $700,000 490 424 103% 12 Toronto C09 13 $14,306,800 $1,100,523 $951,000 31 33 99% 14 Toronto C10 53 $37,960,088 $716,228 $692,800 126 112 104% 11 Toronto C11 31 $16,790,223 $541,620 $505,000 62 47 101% 15 Toronto C12 12 $12,689,200 $1,057,433 $955,000 10 10 101% 21 Toronto C13 49 $31,834,588 $649,685 $595,000 54 40 101% 22 Toronto C14 87 $57,382,500 $659,569 $630,000 160 120 105% 11 Toronto C15 100 $62,843,138 $628,431 $600,000 148 97 104% 11 Toronto East 257 $147,741,866 $574,871 $550,000 404 280 105% 12 Toronto E01 25 $20,596,800 $823,872 $693,500 43 25 106% 14 Toronto E02 12 $8,742,388 $728,532 $638,194 26 20 102% 8 Toronto E03 13 $7,027,500 $540,577 $516,000 23 16 104% 7 Toronto E04 35 $17,991,830 $514,052 $505,000 47 24 104% 12 Toronto E05 38 $21,879,100 $575,766 $566,000 57 45 105% 12 Toronto E06 8 $5,332,990 $666,624 $645,500 13 15 106% 21 Toronto E07 39 $21,587,851 $553,535 $553,000 59 40 108% 11 Toronto E08 20 $10,862,707 $543,135 $507,500 37 28 104% 12 Toronto E09 43 $23,236,800 $540,391 $541,000 69 45 107% 10 Toronto E10 10 $3,933,400 $393,340 $369,000 9 6 101% 24 Toronto E11 14 $6,550,500 $467,893 $465,500 21 16 103% 13 Municipality Number of Sales Dollar Volume Average Price Median Price New Listings Active Listings Avg. SP/LP Avg. LDOM CONDO APT, MAY 2021 Toronto Regional Real Estate Board SUMMARY OF EXISTING HOME TRANSACTIONS CITY OF TORONTO MUNICIPAL BREAKDOWN 1 1 2 4 5 1 1 3 16 Market Watch, May 2021 Copyright® 2021 Toronto Regional Real Estate Board
- 17. TRREB Total 82 $78,255,288 $954,333 $917,500 100 37 111% 10 Halton Region 4 $4,651,788 $1,162,947 $1,086,000 8 2 113% 5 Burlington 1 $780,000 $780,000 $780,000 1 1 111% 6 Halton Hills 0 $0 $0 - 0 0 - - Milton 0 $0 $0 - 0 0 - - Oakville 3 $3,871,788 $1,290,596 $1,220,000 7 1 113% 4 Peel Region 8 $7,910,000 $988,750 $992,500 15 7 105% 8 Brampton 4 $3,667,500 $916,875 $910,000 9 4 100% 11 Caledon 0 $0 $0 - 1 1 - - Mississauga 4 $4,242,500 $1,060,625 $1,070,000 5 2 109% 5 City of Toronto 12 $11,235,000 $936,250 $936,500 12 4 110% 15 Toronto West 0 $0 $0 - 0 0 - - Toronto Central 0 $0 $0 - 1 1 - - Toronto East 12 $11,235,000 $936,250 $936,500 11 3 110% 15 York Region 22 $26,216,300 $1,191,650 $1,194,000 28 14 110% 13 Aurora 1 $920,000 $920,000 $920,000 1 0 107% 7 East Gwillimbury 0 $0 $0 - 0 0 - - Georgina 0 $0 $0 - 0 0 - - King 1 $1,450,000 $1,450,000 $1,450,000 2 1 97% 13 Markham 13 $15,955,800 $1,227,369 $1,208,000 14 5 112% 12 Newmarket 0 $0 $0 - 0 0 - - Richmond Hill 6 $6,902,500 $1,150,417 $1,167,000 6 3 108% 15 Vaughan 0 $0 $0 - 3 4 - - Whitchurch-Stouffville 1 $988,000 $988,000 $988,000 2 1 124% 3 Durham Region 29 $22,835,700 $787,438 $765,000 31 7 119% 6 Ajax 4 $3,381,500 $845,375 $875,000 4 1 123% 6 Brock 0 $0 $0 - 0 0 - - Clarington 15 $11,720,800 $781,387 $765,000 14 2 121% 5 Oshawa 4 $2,748,000 $687,000 $690,000 7 3 121% 9 Pickering 2 $1,597,500 $798,750 $798,750 2 1 104% 15 Scugog 0 $0 $0 - 0 0 - - Uxbridge 0 $0 $0 - 0 0 - - Whitby 4 $3,387,900 $846,975 $843,000 4 0 114% 4 Dufferin County 0 $0 $0 - 0 0 - - Orangeville 0 $0 $0 - 0 0 - - Simcoe County 7 $5,406,500 $772,357 $741,500 6 3 101% 12 Adjala-Tosorontio 0 $0 $0 - 0 0 - - Bradford West Gwillimbury 1 $810,000 $810,000 $810,000 2 1 101% 1 Essa 4 $2,949,000 $737,250 $703,500 3 1 100% 16 Innisfil 1 $727,500 $727,500 $727,500 0 0 104% 2 New Tecumseth 1 $920,000 $920,000 $920,000 1 1 99% 22 Municipality Number of Sales Dollar Volume Average Price Median Price New Listings Active Listings Avg. SP/LP Avg. LDOM LINK, MAY 2021 Toronto Regional Real Estate Board SUMMARY OF EXISTING HOME TRANSACTIONS ALL TRREB AREAS 1 1 2 4 5 1 1 3 17 Market Watch, May 2021 Copyright® 2021 Toronto Regional Real Estate Board
- 18. TRREB Total 82 $78,255,288 $954,333 $917,500 100 37 111% 10 City of Toronto 12 $11,235,000 $936,250 $936,500 12 4 110% 15 Toronto West 0 $0 $0 - 0 0 - - Toronto W01 0 $0 $0 - 0 0 - - Toronto W02 0 $0 $0 - 0 0 - - Toronto W03 0 $0 $0 - 0 0 - - Toronto W04 0 $0 $0 - 0 0 - - Toronto W05 0 $0 $0 - 0 0 - - Toronto W06 0 $0 $0 - 0 0 - - Toronto W07 0 $0 $0 - 0 0 - - Toronto W08 0 $0 $0 - 0 0 - - Toronto W09 0 $0 $0 - 0 0 - - Toronto W10 0 $0 $0 - 0 0 - - Toronto Central 0 $0 $0 - 1 1 - - Toronto C01 0 $0 $0 - 0 0 - - Toronto C02 0 $0 $0 - 0 0 - - Toronto C03 0 $0 $0 - 0 0 - - Toronto C04 0 $0 $0 - 0 0 - - Toronto C06 0 $0 $0 - 0 0 - - Toronto C07 0 $0 $0 - 0 0 - - Toronto C08 0 $0 $0 - 0 0 - - Toronto C09 0 $0 $0 - 0 0 - - Toronto C10 0 $0 $0 - 0 0 - - Toronto C11 0 $0 $0 - 0 0 - - Toronto C12 0 $0 $0 - 0 0 - - Toronto C13 0 $0 $0 - 0 0 - - Toronto C14 0 $0 $0 - 0 0 - - Toronto C15 0 $0 $0 - 1 1 - - Toronto East 12 $11,235,000 $936,250 $936,500 11 3 110% 15 Toronto E01 0 $0 $0 - 0 0 - - Toronto E02 0 $0 $0 - 0 0 - - Toronto E03 0 $0 $0 - 0 0 - - Toronto E04 0 $0 $0 - 0 0 - - Toronto E05 1 $953,000 $953,000 $953,000 1 1 119% 9 Toronto E06 0 $0 $0 - 0 0 - - Toronto E07 9 $8,677,000 $964,111 $968,000 8 2 110% 17 Toronto E08 0 $0 $0 - 0 0 - - Toronto E09 0 $0 $0 - 0 0 - - Toronto E10 0 $0 $0 - 0 0 - - Toronto E11 2 $1,605,000 $802,500 $802,500 2 0 102% 8 Municipality Number of Sales Dollar Volume Average Price Median Price New Listings Active Listings Avg. SP/LP Avg. LDOM LINK, MAY 2021 Toronto Regional Real Estate Board SUMMARY OF EXISTING HOME TRANSACTIONS CITY OF TORONTO MUNICIPAL BREAKDOWN 1 1 2 4 5 1 1 3 18 Market Watch, May 2021 Copyright® 2021 Toronto Regional Real Estate Board
- 19. TRREB Total 4 $3,559,900 $889,975 $817,500 19 39 100% 17 Halton Region 1 $474,900 $474,900 $474,900 0 0 100% 18 Burlington 1 $474,900 $474,900 $474,900 0 0 100% 18 Halton Hills 0 $0 $0 - 0 0 - - Milton 0 $0 $0 - 0 0 - - Oakville 0 $0 $0 - 0 0 - - Peel Region 0 $0 $0 - 2 2 - - Brampton 0 $0 $0 - 0 0 - - Caledon 0 $0 $0 - 0 0 - - Mississauga 0 $0 $0 - 2 2 - - City of Toronto 3 $3,085,000 $1,028,333 $975,000 14 18 100% 17 Toronto West 0 $0 $0 - 5 4 - - Toronto Central 3 $3,085,000 $1,028,333 $975,000 8 13 100% 17 Toronto East 0 $0 $0 - 1 1 - - York Region 0 $0 $0 - 2 18 - - Aurora 0 $0 $0 - 0 0 - - East Gwillimbury 0 $0 $0 - 0 0 - - Georgina 0 $0 $0 - 0 0 - - King 0 $0 $0 - 0 0 - - Markham 0 $0 $0 - 0 0 - - Newmarket 0 $0 $0 - 0 0 - - Richmond Hill 0 $0 $0 - 1 1 - - Vaughan 0 $0 $0 - 0 16 - - Whitchurch-Stouffville 0 $0 $0 - 1 1 - - Durham Region 0 $0 $0 - 1 1 - - Ajax 0 $0 $0 - 0 0 - - Brock 0 $0 $0 - 0 0 - - Clarington 0 $0 $0 - 0 0 - - Oshawa 0 $0 $0 - 0 0 - - Pickering 0 $0 $0 - 1 1 - - Scugog 0 $0 $0 - 0 0 - - Uxbridge 0 $0 $0 - 0 0 - - Whitby 0 $0 $0 - 0 0 - - Dufferin County 0 $0 $0 - 0 0 - - Orangeville 0 $0 $0 - 0 0 - - Simcoe County 0 $0 $0 - 0 0 - - Adjala-Tosorontio 0 $0 $0 - 0 0 - - Bradford West Gwillimbury 0 $0 $0 - 0 0 - - Essa 0 $0 $0 - 0 0 - - Innisfil 0 $0 $0 - 0 0 - - New Tecumseth 0 $0 $0 - 0 0 - - Municipality Number of Sales Dollar Volume Average Price Median Price New Listings Active Listings Avg. SP/LP Avg. LDOM CO-OP APT, MAY 2021 Toronto Regional Real Estate Board SUMMARY OF EXISTING HOME TRANSACTIONS ALL TRREB AREAS 1 1 2 4 5 1 1 3 19 Market Watch, May 2021 Copyright® 2021 Toronto Regional Real Estate Board
- 20. TRREB Total 4 $3,559,900 $889,975 $817,500 19 39 100% 17 City of Toronto 3 $3,085,000 $1,028,333 $975,000 14 18 100% 17 Toronto West 0 $0 $0 - 5 4 - - Toronto W01 0 $0 $0 - 0 0 - - Toronto W02 0 $0 $0 - 0 0 - - Toronto W03 0 $0 $0 - 0 0 - - Toronto W04 0 $0 $0 - 0 0 - - Toronto W05 0 $0 $0 - 0 0 - - Toronto W06 0 $0 $0 - 4 3 - - Toronto W07 0 $0 $0 - 0 0 - - Toronto W08 0 $0 $0 - 1 1 - - Toronto W09 0 $0 $0 - 0 0 - - Toronto W10 0 $0 $0 - 0 0 - - Toronto Central 3 $3,085,000 $1,028,333 $975,000 8 13 100% 17 Toronto C01 1 $975,000 $975,000 $975,000 2 2 98% 24 Toronto C02 1 $660,000 $660,000 $660,000 1 1 102% 12 Toronto C03 0 $0 $0 - 1 1 - - Toronto C04 0 $0 $0 - 0 2 - - Toronto C06 0 $0 $0 - 0 0 - - Toronto C07 0 $0 $0 - 0 0 - - Toronto C08 0 $0 $0 - 0 0 - - Toronto C09 1 $1,450,000 $1,450,000 $1,450,000 4 7 100% 15 Toronto C10 0 $0 $0 - 0 0 - - Toronto C11 0 $0 $0 - 0 0 - - Toronto C12 0 $0 $0 - 0 0 - - Toronto C13 0 $0 $0 - 0 0 - - Toronto C14 0 $0 $0 - 0 0 - - Toronto C15 0 $0 $0 - 0 0 - - Toronto East 0 $0 $0 - 1 1 - - Toronto E01 0 $0 $0 - 0 0 - - Toronto E02 0 $0 $0 - 1 1 - - Toronto E03 0 $0 $0 - 0 0 - - Toronto E04 0 $0 $0 - 0 0 - - Toronto E05 0 $0 $0 - 0 0 - - Toronto E06 0 $0 $0 - 0 0 - - Toronto E07 0 $0 $0 - 0 0 - - Toronto E08 0 $0 $0 - 0 0 - - Toronto E09 0 $0 $0 - 0 0 - - Toronto E10 0 $0 $0 - 0 0 - - Toronto E11 0 $0 $0 - 0 0 - - Municipality Number of Sales Dollar Volume Average Price Median Price New Listings Active Listings Avg. SP/LP Avg. LDOM CO-OP APT, MAY 2021 Toronto Regional Real Estate Board SUMMARY OF EXISTING HOME TRANSACTIONS CITY OF TORONTO MUNICIPAL BREAKDOWN 1 1 2 4 5 1 1 3 20 Market Watch, May 2021 Copyright® 2021 Toronto Regional Real Estate Board
- 21. TRREB Total 15 $14,804,588 $986,973 $830,000 26 16 106% 8 Halton Region 1 $2,215,000 $2,215,000 $2,215,000 1 0 123% 5 Burlington 0 $0 $0 - 0 0 - - Halton Hills 0 $0 $0 - 0 0 - - Milton 0 $0 $0 - 0 0 - - Oakville 1 $2,215,000 $2,215,000 $2,215,000 1 0 123% 5 Peel Region 3 $3,180,388 $1,060,129 $851,500 9 8 102% 3 Brampton 1 $830,000 $830,000 $830,000 5 6 104% 1 Caledon 1 $1,498,888 $1,498,888 $1,498,888 1 0 100% 0 Mississauga 1 $851,500 $851,500 $851,500 3 2 103% 8 City of Toronto 1 $931,000 $931,000 $931,000 2 1 117% 9 Toronto West 0 $0 $0 - 0 0 - - Toronto Central 1 $931,000 $931,000 $931,000 2 1 117% 9 Toronto East 0 $0 $0 - 0 0 - - York Region 2 $2,486,500 $1,243,250 $1,243,250 3 2 104% 8 Aurora 0 $0 $0 - 0 0 - - East Gwillimbury 0 $0 $0 - 0 0 - - Georgina 0 $0 $0 - 0 0 - - King 0 $0 $0 - 0 0 - - Markham 2 $2,486,500 $1,243,250 $1,243,250 3 2 104% 8 Newmarket 0 $0 $0 - 0 0 - - Richmond Hill 0 $0 $0 - 0 0 - - Vaughan 0 $0 $0 - 0 0 - - Whitchurch-Stouffville 0 $0 $0 - 0 0 - - Durham Region 2 $1,245,000 $622,500 $622,500 3 1 100% 9 Ajax 2 $1,245,000 $622,500 $622,500 3 1 100% 9 Brock 0 $0 $0 - 0 0 - - Clarington 0 $0 $0 - 0 0 - - Oshawa 0 $0 $0 - 0 0 - - Pickering 0 $0 $0 - 0 0 - - Scugog 0 $0 $0 - 0 0 - - Uxbridge 0 $0 $0 - 0 0 - - Whitby 0 $0 $0 - 0 0 - - Dufferin County 0 $0 $0 - 0 0 - - Orangeville 0 $0 $0 - 0 0 - - Simcoe County 6 $4,746,700 $791,117 $772,500 8 4 102% 12 Adjala-Tosorontio 0 $0 $0 - 0 0 - - Bradford West Gwillimbury 0 $0 $0 - 0 0 - - Essa 0 $0 $0 - 0 0 - - Innisfil 0 $0 $0 - 0 0 - - New Tecumseth 6 $4,746,700 $791,117 $772,500 8 4 102% 12 Municipality Number of Sales Dollar Volume Average Price Median Price New Listings Active Listings Avg. SP/LP Avg. LDOM DET CONDO, MAY 2021 Toronto Regional Real Estate Board SUMMARY OF EXISTING HOME TRANSACTIONS ALL TRREB AREAS 1 1 2 4 5 1 1 3 21 Market Watch, May 2021 Copyright® 2021 Toronto Regional Real Estate Board
- 22. TRREB Total 15 $14,804,588 $986,973 $830,000 26 16 106% 8 City of Toronto 1 $931,000 $931,000 $931,000 2 1 117% 9 Toronto West 0 $0 $0 - 0 0 - - Toronto W01 0 $0 $0 - 0 0 - - Toronto W02 0 $0 $0 - 0 0 - - Toronto W03 0 $0 $0 - 0 0 - - Toronto W04 0 $0 $0 - 0 0 - - Toronto W05 0 $0 $0 - 0 0 - - Toronto W06 0 $0 $0 - 0 0 - - Toronto W07 0 $0 $0 - 0 0 - - Toronto W08 0 $0 $0 - 0 0 - - Toronto W09 0 $0 $0 - 0 0 - - Toronto W10 0 $0 $0 - 0 0 - - Toronto Central 1 $931,000 $931,000 $931,000 2 1 117% 9 Toronto C01 1 $931,000 $931,000 $931,000 1 0 117% 9 Toronto C02 0 $0 $0 - 0 0 - - Toronto C03 0 $0 $0 - 0 0 - - Toronto C04 0 $0 $0 - 0 0 - - Toronto C06 0 $0 $0 - 0 0 - - Toronto C07 0 $0 $0 - 0 0 - - Toronto C08 0 $0 $0 - 0 0 - - Toronto C09 0 $0 $0 - 1 1 - - Toronto C10 0 $0 $0 - 0 0 - - Toronto C11 0 $0 $0 - 0 0 - - Toronto C12 0 $0 $0 - 0 0 - - Toronto C13 0 $0 $0 - 0 0 - - Toronto C14 0 $0 $0 - 0 0 - - Toronto C15 0 $0 $0 - 0 0 - - Toronto East 0 $0 $0 - 0 0 - - Toronto E01 0 $0 $0 - 0 0 - - Toronto E02 0 $0 $0 - 0 0 - - Toronto E03 0 $0 $0 - 0 0 - - Toronto E04 0 $0 $0 - 0 0 - - Toronto E05 0 $0 $0 - 0 0 - - Toronto E06 0 $0 $0 - 0 0 - - Toronto E07 0 $0 $0 - 0 0 - - Toronto E08 0 $0 $0 - 0 0 - - Toronto E09 0 $0 $0 - 0 0 - - Toronto E10 0 $0 $0 - 0 0 - - Toronto E11 0 $0 $0 - 0 0 - - Municipality Number of Sales Dollar Volume Average Price Median Price New Listings Active Listings Avg. SP/LP Avg. LDOM DET CONDO, MAY 2021 Toronto Regional Real Estate Board SUMMARY OF EXISTING HOME TRANSACTIONS CITY OF TORONTO MUNICIPAL BREAKDOWN 1 1 2 4 5 1 1 3 22 Market Watch, May 2021 Copyright® 2021 Toronto Regional Real Estate Board
- 23. TRREB Total 7 $3,826,000 $546,571 $544,000 13 12 99% 22 Halton Region 0 $0 $0 - 0 0 - - Burlington 0 $0 $0 - 0 0 - - Halton Hills 0 $0 $0 - 0 0 - - Milton 0 $0 $0 - 0 0 - - Oakville 0 $0 $0 - 0 0 - - Peel Region 0 $0 $0 - 0 0 - - Brampton 0 $0 $0 - 0 0 - - Caledon 0 $0 $0 - 0 0 - - Mississauga 0 $0 $0 - 0 0 - - City of Toronto 7 $3,826,000 $546,571 $544,000 13 12 99% 22 Toronto West 2 $748,000 $374,000 $374,000 2 2 107% 29 Toronto Central 4 $2,348,000 $587,000 $544,500 10 10 98% 20 Toronto East 1 $730,000 $730,000 $730,000 1 0 96% 17 York Region 0 $0 $0 - 0 0 - - Aurora 0 $0 $0 - 0 0 - - East Gwillimbury 0 $0 $0 - 0 0 - - Georgina 0 $0 $0 - 0 0 - - King 0 $0 $0 - 0 0 - - Markham 0 $0 $0 - 0 0 - - Newmarket 0 $0 $0 - 0 0 - - Richmond Hill 0 $0 $0 - 0 0 - - Vaughan 0 $0 $0 - 0 0 - - Whitchurch-Stouffville 0 $0 $0 - 0 0 - - Durham Region 0 $0 $0 - 0 0 - - Ajax 0 $0 $0 - 0 0 - - Brock 0 $0 $0 - 0 0 - - Clarington 0 $0 $0 - 0 0 - - Oshawa 0 $0 $0 - 0 0 - - Pickering 0 $0 $0 - 0 0 - - Scugog 0 $0 $0 - 0 0 - - Uxbridge 0 $0 $0 - 0 0 - - Whitby 0 $0 $0 - 0 0 - - Dufferin County 0 $0 $0 - 0 0 - - Orangeville 0 $0 $0 - 0 0 - - Simcoe County 0 $0 $0 - 0 0 - - Adjala-Tosorontio 0 $0 $0 - 0 0 - - Bradford West Gwillimbury 0 $0 $0 - 0 0 - - Essa 0 $0 $0 - 0 0 - - Innisfil 0 $0 $0 - 0 0 - - New Tecumseth 0 $0 $0 - 0 0 - - Municipality Number of Sales Dollar Volume Average Price Median Price New Listings Active Listings Avg. SP/LP Avg. LDOM CO-OWNERSHIP APT, MAY 2021 Toronto Regional Real Estate Board SUMMARY OF EXISTING HOME TRANSACTIONS ALL TRREB AREAS 1 1 2 4 5 1 1 3 23 Market Watch, May 2021 Copyright® 2021 Toronto Regional Real Estate Board
- 24. TRREB Total 7 $3,826,000 $546,571 $544,000 13 12 99% 22 City of Toronto 7 $3,826,000 $546,571 $544,000 13 12 99% 22 Toronto West 2 $748,000 $374,000 $374,000 2 2 107% 29 Toronto W01 0 $0 $0 - 0 0 - - Toronto W02 0 $0 $0 - 0 0 - - Toronto W03 0 $0 $0 - 0 0 - - Toronto W04 0 $0 $0 - 0 0 - - Toronto W05 1 $283,000 $283,000 $283,000 2 2 94% 40 Toronto W06 1 $465,000 $465,000 $465,000 0 0 116% 18 Toronto W07 0 $0 $0 - 0 0 - - Toronto W08 0 $0 $0 - 0 0 - - Toronto W09 0 $0 $0 - 0 0 - - Toronto W10 0 $0 $0 - 0 0 - - Toronto Central 4 $2,348,000 $587,000 $544,500 10 10 98% 20 Toronto C01 0 $0 $0 - 0 0 - - Toronto C02 0 $0 $0 - 2 2 - - Toronto C03 0 $0 $0 - 1 1 - - Toronto C04 1 $544,000 $544,000 $544,000 3 2 99% 1 Toronto C06 0 $0 $0 - 0 0 - - Toronto C07 0 $0 $0 - 0 0 - - Toronto C08 2 $955,000 $477,500 $477,500 0 2 96% 33 Toronto C09 1 $849,000 $849,000 $849,000 1 0 100% 11 Toronto C10 0 $0 $0 - 2 2 - - Toronto C11 0 $0 $0 - 0 0 - - Toronto C12 0 $0 $0 - 0 0 - - Toronto C13 0 $0 $0 - 0 0 - - Toronto C14 0 $0 $0 - 1 1 - - Toronto C15 0 $0 $0 - 0 0 - - Toronto East 1 $730,000 $730,000 $730,000 1 0 96% 17 Toronto E01 0 $0 $0 - 0 0 - - Toronto E02 1 $730,000 $730,000 $730,000 1 0 96% 17 Toronto E03 0 $0 $0 - 0 0 - - Toronto E04 0 $0 $0 - 0 0 - - Toronto E05 0 $0 $0 - 0 0 - - Toronto E06 0 $0 $0 - 0 0 - - Toronto E07 0 $0 $0 - 0 0 - - Toronto E08 0 $0 $0 - 0 0 - - Toronto E09 0 $0 $0 - 0 0 - - Toronto E10 0 $0 $0 - 0 0 - - Toronto E11 0 $0 $0 - 0 0 - - Municipality Number of Sales Dollar Volume Average Price Median Price New Listings Active Listings Avg. SP/LP Avg. LDOM CO-OWNERSHIP APT, MAY 2021 Toronto Regional Real Estate Board SUMMARY OF EXISTING HOME TRANSACTIONS CITY OF TORONTO MUNICIPAL BREAKDOWN 1 1 2 4 5 1 1 3 24 Market Watch, May 2021 Copyright® 2021 Toronto Regional Real Estate Board
- 25. 342.3 $1,045,800 18.81% 344.7 $1,289,600 25.07% 356.3 $1,003,700 23.37% 342.9 $738,100 19.60% 322.6 $638,900 6.61% 366.2 $1,127,900 25.80% 367.5 $1,341,100 28.95% 377.7 $956,000 28.47% 372.0 $716,700 23.63% 346.2 $655,100 14.26% 378.8 $1,092,900 26.65% 387.0 $1,332,000 31.63% 409.0 $997,100 31.72% 377.7 $705,800 24.65% 353.0 $582,700 14.35% 359.0 $1,058,900 27.44% 350.4 $1,142,900 27.70% 370.2 $824,900 29.17% 389.8 $620,600 26.44% 346.2 $528,600 14.86% 353.2 $1,075,100 27.65% 354.6 $1,306,100 29.51% 365.0 $879,900 28.12% 359.0 $615,800 23.24% 327.8 $674,400 14.30% 362.7 $1,224,800 23.58% 362.6 $1,470,300 26.56% 376.6 $1,049,800 27.19% 363.2 $824,800 22.04% 343.2 $685,600 13.91% 338.1 $958,200 18.80% 334.4 $1,184,300 23.08% 345.7 $883,400 22.85% 339.8 $718,500 18.36% 332.3 $568,200 6.81% 343.1 $873,900 21.75% 335.4 $988,200 22.63% 349.4 $816,000 22.94% 348.3 $629,800 22.38% 322.5 $475,600 9.96% 318.2 $1,162,800 34.94% 321.2 $1,221,000 36.04% 354.8 $876,500 31.46% 300.0 $649,400 23.66% - - - 335.5 $990,500 15.13% 336.0 $1,342,000 21.52% 337.8 $931,600 21.55% 336.7 $744,200 16.71% 334.3 $586,900 6.26% 335.4 $1,105,900 10.66% 342.7 $1,548,400 18.91% 362.3 $1,224,000 16.87% 330.5 $783,900 12.45% 323.7 $660,400 4.69% 335.9 $1,144,400 20.74% 345.2 $1,334,600 22.50% 341.8 $987,900 21.94% 309.1 $799,900 26.01% 288.2 $625,700 11.53% 332.6 $1,100,100 23.97% 334.5 $1,256,800 23.84% 347.9 $897,100 22.89% 307.2 $832,200 38.01% 290.6 $623,500 14.01% 326.2 $1,116,200 35.52% 327.0 $1,166,700 33.74% 353.9 $740,300 37.81% - - - - - - 353.8 $686,500 37.61% 360.9 $696,200 37.22% 357.8 $705,300 38.04% - - - - - - 338.2 $1,574,100 22.45% 343.1 $1,608,000 22.89% 325.6 $998,600 24.99% - - - 271.8 $671,900 13.68% 339.3 $1,192,700 18.47% 359.9 $1,506,800 19.53% 351.1 $1,045,200 20.78% 294.8 $795,600 25.02% 292.5 $673,700 11.13% 315.9 $930,300 24.81% 317.4 $1,069,800 25.06% 317.8 $748,500 25.56% 337.8 $699,100 32.06% 290.7 $497,500 14.49% 347.7 $1,249,300 17.90% 371.3 $1,586,000 18.32% 342.2 $1,040,400 21.30% 290.2 $735,700 17.16% 296.3 $599,500 13.09% 324.9 $1,185,900 17.59% 323.3 $1,373,600 18.47% 335.0 $1,017,100 20.20% 322.2 $891,000 20.04% 277.0 $639,700 10.45% 355.9 $1,239,900 25.23% 354.4 $1,307,200 26.44% 359.4 $896,700 23.25% 389.0 $690,500 40.43% 290.6 $581,500 11.81% 353.5 $825,400 34.10% 344.0 $897,700 34.64% 367.8 $733,500 35.22% 375.9 $591,400 33.11% 342.6 $568,500 25.54% 345.6 $852,300 29.10% 343.9 $922,600 29.43% 359.0 $774,700 30.59% 340.2 $639,300 29.11% 307.7 $494,200 24.83% 332.4 $560,600 41.57% 332.2 $565,900 41.36% 347.2 $700,300 53.90% - - - - - - 352.4 $744,300 38.58% 342.1 $823,900 38.78% 355.9 $679,900 40.73% 367.0 $592,800 31.21% 296.6 $437,100 25.73% 369.2 $702,100 36.24% 353.1 $753,600 36.07% 402.8 $674,100 38.71% 408.4 $517,600 37.28% 342.3 $387,200 25.02% 354.5 $945,600 29.24% 336.0 $1,046,700 30.28% 359.0 $837,700 30.26% 357.6 $610,200 27.76% 436.8 $822,800 27.46% 334.2 $858,000 37.59% 328.8 $871,600 37.80% 335.3 $623,300 41.96% - - - - - - 319.8 $1,065,500 36.26% 321.2 $1,109,400 37.74% 313.2 $726,300 37.07% 316.5 $576,300 25.30% 267.5 $638,800 20.93% 347.0 $901,500 33.10% 345.6 $994,000 33.38% 358.5 $789,800 33.82% 370.7 $622,900 37.55% 275.2 $510,900 23.85% 372.6 $822,300 29.55% 392.6 $894,700 30.82% 373.8 $700,500 31.62% 336.2 $444,500 32.99% 335.7 $492,500 4.84% 372.6 $822,300 29.55% 392.6 $894,700 30.82% 373.8 $700,500 31.62% 336.2 $444,500 32.99% 335.7 $492,500 4.84% 337.6 $737,500 34.07% 328.9 $754,600 37.21% 378.6 $707,100 38.28% 305.6 $482,500 27.23% 307.8 $486,800 14.30% 319.6 $854,500 34.97% 319.9 $856,500 34.87% - - - - - - - - - 349.6 $875,200 30.01% 326.4 $931,300 32.15% 384.9 $811,000 33.00% 338.2 $549,200 26.24% 288.4 $486,500 14.08% 359.2 $719,100 37.68% 346.5 $733,200 46.39% 390.1 $615,600 53.28% 345.6 $551,200 27.81% - - - 337.6 $665,800 36.46% 336.1 $683,300 37.41% 393.5 $601,700 42.99% 268.9 $226,100 24.38% 295.8 $581,200 13.29% - - - - - - - - - - - - - - - 315.9 $742,100 31.24% 311.4 $810,700 34.51% 355.8 $647,900 38.71% 300.7 $607,700 24.36% 323.9 $505,200 17.14% Composite Single Family Detached Single Family Attached Townhouse Apartment Index Benchmark Yr./Yr. % Chg. Index Benchmark Yr./Yr. % Chg. Index Benchmark Yr./Yr. % Chg. Index Benchmark Yr./Yr. % Chg. Index Benchmark Yr./Yr. % Chg. Toronto Regional Real Estate Board FOCUS ON THE MLS HOME PRICE INDEX ALL TRREB AREAS INDEX AND BENCHMARK PRICE, MAY 2021 TRREB Total Halton Region Burlington Halton Hills Milton Oakville Peel Region Brampton Caledon Mississauga City of Toronto York Region Aurora East Gwillimbury Georgina King Markham Newmarket Richmond Hill Vaughan Whitchurch-Stouffville Durham Region Ajax Brock Clarington Oshawa Pickering Scugog Uxbridge Whitby Dufferin County Orangeville Simcoe County Adjala-Tosorontio Bradford West Gwillimbury Essa Innisfil Barrie New Tecumseth 25 Market Watch, May 2021 Copyright® 2021 Toronto Regional Real Estate Board
- 26. 342.3 $1,045,800 18.81% 344.7 $1,289,600 25.07% 356.3 $1,003,700 23.37% 342.9 $738,100 19.60% 322.6 $638,900 6.61% 335.4 $1,105,900 10.66% 342.7 $1,548,400 18.91% 362.3 $1,224,000 16.87% 330.5 $783,900 12.45% 323.7 $660,400 4.69% 323.5 $1,380,900 11.13% 344.0 $1,916,100 12.42% 368.1 $1,463,100 13.96% 276.3 $831,300 10.26% 309.9 $700,700 9.27% 382.3 $1,362,100 13.71% 366.6 $1,602,400 15.94% 411.1 $1,222,500 15.54% 402.5 $783,700 10.67% 361.3 $775,600 9.65% 378.8 $976,700 17.35% 387.4 $1,048,500 18.43% 389.6 $998,000 18.31% 284.7 $698,100 10.26% 356.4 $609,000 12.50% 348.3 $894,000 11.60% 332.7 $1,052,900 15.84% 334.5 $950,700 15.23% 295.2 $679,500 10.94% 376.8 $555,900 7.29% 323.8 $769,200 16.68% 326.9 $1,096,300 18.06% 310.9 $903,100 18.66% 309.2 $561,500 17.61% 350.0 $462,400 14.04% 290.5 $850,800 16.20% 381.6 $1,205,800 24.71% 341.9 $1,151,300 24.96% 339.2 $1,005,800 8.96% 238.8 $599,000 10.40% 313.1 $1,384,500 21.31% 333.7 $1,530,300 23.41% 322.0 $1,338,600 24.04% 245.3 $901,700 15.49% 189.5 $768,400 6.04% 295.6 $1,253,000 13.34% 306.8 $1,720,200 23.26% 332.1 $1,248,800 25.70% 327.4 $787,400 13.48% 280.8 $584,700 5.68% 321.1 $837,800 17.02% 327.4 $1,269,700 23.31% 350.6 $967,100 29.52% 253.0 $702,700 10.14% 327.9 $432,000 10.33% 351.8 $803,600 13.05% 331.7 $995,100 17.71% 335.5 $858,500 16.53% 397.7 $715,900 26.37% 364.3 $519,000 7.91% 351.2 $881,100 1.89% 421.5 $1,651,400 5.85% 418.5 $1,529,300 6.60% 335.6 $956,600 7.56% 345.0 $718,200 0.91% 326.3 $1,644,000 14.05% 316.0 $2,667,200 17.95% 337.1 $1,889,200 19.54% 320.0 $1,609,100 2.99% 319.2 $909,400 11.34% 377.4 $2,186,900 15.98% 361.4 $2,450,100 18.53% 376.0 $1,450,900 21.96% - - - 396.4 $1,036,900 9.87% 297.1 $1,916,200 10.61% 306.8 $2,245,900 12.05% 313.8 $1,467,500 15.16% - - - 255.2 $682,700 3.19% 325.9 $1,313,100 9.99% 334.3 $1,488,400 18.97% 306.0 $1,128,000 13.50% 300.2 $805,100 8.73% 320.3 $688,900 3.49% 334.0 $1,141,600 6.91% 362.5 $1,725,800 14.46% 286.8 $1,081,600 13.85% 301.4 $849,500 8.77% 323.6 $674,300 2.11% 308.2 $800,300 1.48% 327.4 $1,917,000 6.44% 339.2 $1,618,200 11.62% 339.8 $878,700 12.93% 304.9 $653,100 0.49% 261.4 $1,875,300 15.87% 267.0 $3,442,400 21.81% 267.9 $2,535,700 18.17% 304.7 $1,799,600 5.32% 247.7 $820,600 12.39% 323.7 $1,279,500 8.44% 313.1 $1,933,100 13.85% 304.1 $1,502,400 16.69% 292.2 $979,400 3.07% 331.5 $791,600 6.76% 360.2 $1,306,700 11.97% 331.7 $2,388,200 21.06% 362.3 $1,680,000 21.82% 292.8 $507,200 24.44% 377.7 $548,400 6.76% 284.3 $2,456,100 13.49% 283.5 $3,073,800 17.59% 335.5 $1,379,400 18.26% 245.3 $981,400 16.98% 308.6 $967,600 3.91% 320.4 $1,199,800 9.65% 328.0 $1,826,000 20.01% 310.8 $969,300 24.87% 293.5 $848,500 16.42% 314.0 $641,500 0.71% 316.6 $1,074,700 4.01% 361.1 $2,172,300 13.27% 277.2 $1,431,200 15.26% 342.4 $922,100 4.74% 303.5 $764,300 1.27% 324.2 $1,049,900 7.74% 342.1 $1,606,200 12.31% 287.6 $935,000 15.59% 330.5 $791,100 12.34% 319.7 $736,000 4.75% 411.6 $1,281,100 14.08% 423.0 $1,490,100 15.64% 430.4 $1,357,400 16.39% 494.3 $904,100 16.44% 317.4 $710,000 2.55% 365.5 $1,364,500 15.19% 321.4 $1,454,500 18.16% 389.1 $1,302,100 15.80% 386.4 $1,112,900 14.83% 321.7 $914,100 7.38% 360.0 $1,119,900 15.98% 369.4 $1,255,700 17.05% 349.4 $1,166,200 16.51% - - - 328.3 $490,700 10.58% 349.0 $860,800 17.55% 335.1 $987,900 20.58% 346.7 $835,500 18.49% 304.0 $646,400 12.47% 394.1 $601,000 16.98% 309.2 $821,600 13.97% 331.4 $1,167,100 20.20% 321.7 $886,500 21.08% 333.1 $724,400 16.67% 274.2 $562,800 4.70% 361.7 $1,005,900 23.57% 374.2 $1,068,900 26.98% 375.3 $892,600 28.57% 322.6 $712,900 12.56% 307.2 $632,400 10.15% 342.3 $839,100 14.14% 346.3 $1,135,100 17.43% 335.2 $876,400 18.15% 339.9 $736,300 16.36% 339.9 $582,100 11.19% 353.3 $814,500 20.83% 351.6 $1,095,900 25.57% 318.7 $826,200 27.43% 312.7 $573,300 18.31% 367.1 $500,900 13.62% 339.2 $809,900 13.90% 339.5 $964,000 21.42% 325.1 $795,100 19.96% 358.2 $644,900 11.52% 337.2 $632,500 7.70% 351.8 $986,600 19.42% 340.5 $1,091,000 23.10% 341.9 $886,600 25.01% 389.0 $634,600 12.10% 327.6 $528,500 8.73% 368.4 $785,700 16.40% 358.1 $996,000 19.29% 369.5 $837,000 22.72% 285.1 $559,500 17.37% 455.3 $577,100 14.60% Composite Single Family Detached Single Family Attached Townhouse Apartment Index Benchmark Yr./Yr. % Chg. Index Benchmark Yr./Yr. % Chg. Index Benchmark Yr./Yr. % Chg. Index Benchmark Yr./Yr. % Chg. Index Benchmark Yr./Yr. % Chg. Toronto Regional Real Estate Board FOCUS ON THE MLS HOME PRICE INDEX CITY OF TORONTO INDEX AND BENCHMARK PRICE, MAY 2021 TRREB Total City of Toronto Toronto W01 Toronto W02 Toronto W03 Toronto W04 Toronto W05 Toronto W06 Toronto W07 Toronto W08 Toronto W09 Toronto W10 Toronto C01 Toronto C02 Toronto C03 Toronto C04 Toronto C06 Toronto C07 Toronto C08 Toronto C09 Toronto C10 Toronto C11 Toronto C12 Toronto C13 Toronto C14 Toronto C15 Toronto E01 Toronto E02 Toronto E03 Toronto E04 Toronto E05 Toronto E06 Toronto E07 Toronto E08 Toronto E09 Toronto E10 Toronto E11 26 Market Watch, May 2021 Copyright® 2021 Toronto Regional Real Estate Board
- 27. 2009 86,980 $395,234 2010 85,860 $431,262 2011 89,110 $464,989 2012 85,488 $497,073 2013 87,047 $522,951 2014 92,776 $566,611 2015 101,214 $622,116 2016 113,040 $729,821 2017 92,340 $822,496 2018 78,017 $787,800 2019 87,749 $819,057 Year Sales Average Price Toronto Regional Real Estate Board January 4,546 838,087 February 7,193 910,068 March 7,944 902,737 April 2,957 820,226 May 4,594 863,563 June 8,645 931,131 July 11,033 943,594 August 10,738 951,219 September 11,033 960,613 October 10,503 968,535 November 8,728 955,889 December 7,156 932,277 January 6,889 $966,108 February 10,941 $1,045,203 March 15,646 $1,097,299 April 13,650 $1,090,784 May 11,951 $1,108,453 June - - July - - August - - September - - October - - November - - December - - Annual 95,070 $929,629 HISTORIC ANNUAL STATISTICS1,6,7 Year to Date 59,077 $1,073,104 NOTES *For historic annual sales and average price data over a longer time frame go to: http://www.torontorealestateboard.com/market_news/market_watch/historic_stats/ pdf/TREB_historic_statistics.pdf Ajax Aurora Bradford West Gwillimbury Brampton Brock Burlington C01 C02 C03 C04 C06 C07 C08 C10 C11 C12 C13 C14 C15 Caledon Clarington E01 E02 E03 E04 E06 E07 E08 E09 E10 E11 East Gwillimbury Essa Georgina Halton Hills Innisfil King Markham Milton Mississauga New Tecumseth Newmarket Oakville Oshawa Pickering Richmond Hill Scugog Uxbridge Vaughan W02 W03 W04 W05 W06 W07 W08 W09 W10 Whitchurch-Stouffville Adjala-Tosorontio Orangeville Whitby Dufferin Durham Halton Peel Simcoe Toronto York 27 Market Watch, May 2021 Copyright® 2021 Toronto Regional Real Estate Board 1 - Sales, dollar volume, average sale prices and median sale prices are based on firm transactions entered into the TRREB MLS® system between the first and last day of the month/period being reported. 2 - New listings entered into the TRREB MLS® system between the first and last day of the month/period being reported. 3 - Active listings at the end of the last day of the month/period being reported. 4 - Ratio of the average selling price to the average listing price for firm transactions entered into the TRREB MLS® system between the first and last day of the month/period being reported. 5 - Average Listing Days on Market (Avg. LDOM) refers to the average number of days sold listings were on the market. Average Property Days on Market (Avg. PDOM) refers to the average number of days a property was on the market before selling irrespective of whether the property was listed more than once by the same combination of seller and brokerage during the original listing contract period. 6 - Active listings at the end of the last day of the month/period being reported. 7 - Past monthly and year-to-date figures are revised on a monthly basis. 8 - SNLR = Sales-to-New Listings Ratio. Calculated using a 12-month moving average (sales/new listings). 9 - Mos. Inv. = Months of Inventory. Calculated using a 12-month moving average (active listings/sales). 2021 MONTHLY STATISTICS1,7 2020 MONTHLY STATISTICS1,7