SlideShare ist ein Scribd-Unternehmen logo
1 von 27
Downloaden Sie, um offline zu lesen
Sources and Notes
i - Statistics Canada, Quarter-over-quarter
growth, annualized.
ii - Statistics Canada, Year-over-year
growth for the most recently reported
month.
iii - Bank of Canada, Rate from most recent
Bank of Canada announcement.
iv - Bank of Canada, Rates for most
recently completed month.
% Chg
Inflation (Yr./Yr. CPI Growth)
Toronto Employment Growth
1 Year
3 Year
5 Year
­ 6.34%
­ 6.14%
­ 6.49%
Real GDP Growth
416 905 Total
Detached
Semi-Detached
Townhouse
Condo Apt -48.1%
-49.4%
-44.6%
-38.0%
-45.7%
-46.9%
-47.5%
-48.8%
Market Watch, February 2023
TRREB MLS Sales Activity
February 2023 February 2022
$1,334,062
$1,095,617
TRREB MLS Average Price
2023 2022
Sales
New Listings
Active Listings
Average Price
Avg. LDOM
Avg. PDOM 11
9
$1,334,062
0
0
9,028
33
22
$1,095,617
1
2,139
4,783
Market Watch For All TRREB Member Inquiries:
416-443-8152
nk
For All Media/Public Inquiries:
416-443-8158
Copyright 2023 Toronto Regional Real Estate Board
February 2023
Economic Indicators ®
200.0%
144.4%
-17.9%
-47.0%
-47.0%
-47.0%
Year-Over-Year Summary
February 2023 February 2022
9,028
4,783
14,153
8,367 -40.9%
6,984
9,643
GTA REALTORS Release February Stats
TORONTO, ONTARIO, MARCH 3, 2023 – February sales in the Greater Toronto Area (GTA) were down
substantially from the pre-rate hike levels of early 2022. However, the number of new listings also dropped
substantially year-over-year. The result was that the average selling price and MLS® HPI continued to level off
after trending lower through the spring and summer of last year.
“It has been almost a year since the Bank of Canada started raising interest rates. Home prices have dropped
over the last year from the record peak in February 2022, mitigating the impact of higher borrowing costs. Many
homebuyers have also decided to purchase a lower priced home to help offset higher borrowing costs. The
share of home purchases below one million dollars is up substantially compared to this time last year,” said
Toronto Regional Real Estate Board (TRREB) President Paul Baron.
GTA REALTORS® reported 4,783 sales through TRREB’s MLS® System in February 2023 – down 47 per cent
compared to February 2022, the last full month before the onset of interest rate hikes. The number of new
listings entered into the system was down by a similar annual rate of 40.9 per cent to 8,367.
“New listings continued to drop year-over-year in the GTA. Recently released Ipsos polling suggests buying
intentions have picked up for 2023. This increased demand will run up against a constrained supply of listings
and lead to increased competition between buyers. This will eventually lead to renewed price growth in many
segments of the market, especially those catering to first-time buyers facing increased rental costs,” said
TRREB Chief Market Analyst Jason Mercer.
The average selling price for February 2023 was $1,095,617 – down 17.9 per cent compared to February 2022.
Some of this decline is attributable to the fact that the share of sales below $1,000,000 was 57 per cent in
February 2023 versus only 38 per cent a year earlier. On a monthly basis, the average price followed the regular
seasonal trend, increasing relative to January 2023. The MLS® Home Price Index (HPI) Composite Benchmark
was down year-over-year by a similar annual rate of 17.7 per cent, but was also up on a monthly basis.
“As we move toward a June mayoral by-election in Toronto, housing supply will once again be front and centre
in the policy debate. New and innovative solutions, including the City of Toronto’s initiative to allow duplexes,
triplexes and fourplexes in all neighbourhoods citywide, need to come to fruition if we are to achieve an
adequate and diverse housing supply that will support record population growth in the years to come,” said
TRREB Chief Executive Officer John DiMichele.
®
Sales & Average Price by Major Home Type
416 905 Total
Detached
Semi-Detached
Townhouse
Condo Apt 1,455
821
399
2,075
503
660
255
1,593
952
161
144
482
416 905 Total
$705,472
$934,834
$1,069,266
$1,439,735
$662,323
$917,634
$950,049
$1,357,245
$728,271
$1,005,342
$1,280,380
$1,712,364
Sales Average Price
YoY % change
February 2023
416 905 Total
-11.4%
-11.3%
-14.9%
-17.5%
-12.4%
-18.0%
-25.9%
-21.5%
Q4 2022 0.0% ½
January 2023 0.3% ·
January 2023 6.0% ½
Toronto Unemployment Rate (SA)
January 2023 5.9% ½
February 2023 4.5% ­
Bank of Canada Overnight Rate
February 2023 6.7% ·
Prime Rate
Mortgage Rates February 2023
38.1%
®
1
-47.3%
-47.4%
-46.5%
-46.6%
-11.8%
-16.7%
-21.4%
-19.9%
Market Watch, February 2023
Toronto Regional Real Estate Board
SALES BY PRICE RANGE AND HOUSE TYPE February 2023
Copyright 2023 Toronto Regional Real Estate Board
2
Year-to-Date 2023
Detached Semi-Detached Att/Row/Townhouse Condo Townhouse Condo Apartment Link Co-Op Apartment Detached Condo Co-Ownership Apt Total
$0 to $99,999
$100,000 to $199,999
$200,000 to $299,999
$300,000 to $399,999
$400,000 to $499,999
$500,000 to $599,999
$600,000 to $699,999
$700,000 to $799,999
$800,000 to $899,999
$900,000 to $999,999
$1,000,000 to $1,249,999
$1,250,000 to $1,499,999
$1,500,000 to $1,749,999
$1,750,000 to $1,999,999
$2,000,000+ 485
240
467
856
1,244
884
793
820
929
851
254
39
14
0
1
0
0
0
0
0
0
0
0
0
2
3
2
1
0
0
0
0
0
2
1
0
0
4
0
0
0
0
0
0
0
0
0
0
0
0
0
0
1
1
1
0
4
0
0
0
0
0
0
11
12
4
4
4
1
2
0
0
0
0
0
25
14
20
32
78
107
164
313
642
746
223
26
10
0
1
0
2
5
16
38
44
90
184
137
52
12
0
0
0
0
11
5
20
82
162
203
133
95
24
3
1
0
0
0
0
13
13
23
55
176
154
112
53
36
4
0
0
0
0
0
436
206
399
658
777
372
290
166
88
41
15
7
3
0
0
Total Sales
Share of Total Sales (%)
Average Price $1,073,138
100.0%
7,877
$425,189
0.1%
8
$969,143
0.1%
7
$501,055
0.1%
7
$1,063,064
0.5%
38
$697,765
30.5%
2,401
$782,097
7.4%
580
$1,022,815
9.4%
739
$1,050,614
8.1%
639
$1,400,482
43.9%
3,458
Detached Semi-Detached Att/Row/Townhouse Condo Townhouse Condo Apartment Link Co-Op Apartment Detached Condo Co-Ownership Apt Total
$0 to $99,999
$100,000 to $199,999
$200,000 to $299,999
$300,000 to $399,999
$400,000 to $499,999
$500,000 to $599,999
$600,000 to $699,999
$700,000 to $799,999
$800,000 to $899,999
$900,000 to $999,999
$1,000,000 to $1,249,999
$1,250,000 to $1,499,999
$1,500,000 to $1,749,999
$1,750,000 to $1,999,999
$2,000,000+ 323
160
284
555
748
545
465
482
563
483
141
23
11
0
0
0
0
0
0
0
0
0
0
0
1
2
0
0
0
0
0
0
0
1
0
0
0
1
0
0
0
0
0
0
0
0
0
0
0
0
0
0
1
0
0
0
3
0
0
0
0
0
0
8
8
4
3
1
0
0
0
0
0
0
0
15
9
12
22
47
71
111
192
400
430
120
18
8
0
0
0
0
2
14
24
29
56
115
79
30
9
0
0
0
0
9
4
13
64
102
136
75
46
11
2
1
0
0
0
0
11
12
10
41
108
93
62
32
27
3
0
0
0
0
0
288
135
247
405
459
212
158
94
46
17
9
2
3
0
0
Total Sales
Share of Total Sales (%)
Average Price $1,095,617
100.0%
4,783
$478,504
0.1%
3
$1,044,500
0.0%
2
$476,472
0.1%
4
$1,118,949
0.5%
24
$705,472
30.4%
1,455
$785,448
7.5%
358
$1,050,342
9.7%
463
$1,069,266
8.3%
399
$1,439,735
43.4%
2,075
SALES BY PRICE RANGE AND HOUSE TYPE
Sales Dollar Volume Average Price Median Price New Listings SNLR Trend Active Listings Mos Inv (Trend) Avg. SP/LP Avg. LDOM Avg. PDOM
Abc
Abc
Abc
Abc
Abc
Abc
Abc
Abc
Abc
Abc
Abc
Abc
Abc
Abc
Abc
Abc
Abc
Abc
Abc
Abc
Abc
Abc
Abc
Abc
Abc
Abc
Abc
Abc
Abc
Abc
Abc
Abc
Abc
Abc
Abc
Abc
Abc
Abc
Abc
Abc
Abc
All TRREB Areas
Halton Region
Burlington
Halton Hills
Milton
Oakville
Peel Region
Brampton
Caledon
Mississauga
City of Toronto
Toronto West
Toronto Central
Toronto East
York Region
Aurora
East Gwillimbury
Georgina
King
Markham
Newmarket
Richmond Hill
Vaughan
Stouffville
Durham Region
Ajax
Brock
Clarington
Oshawa
Pickering
Scugog
Uxbridge
Whitby
Dufferin County
Orangeville
Simcoe County
Adjala-Tosorontio
Bradford
Essa
Innisfil
New Tecumseth
4,783
525
525
176
46
126
126
177
832
382
382
67
383
1,745
1,745
469
883
393
393
910
55
34
34
49
23
216
216
75
167
167
254
254
37
601
601
77
77
14
106
106
168
168
91
20
20
15
15
110
26
26
26
26
144
8
8
33
33
21
41
41
41
$5,240,334,140
$641,599,821
$641,599,821
$184,417,830
$47,221,807
$132,964,277
$132,964,277
$276,995,907
$858,861,629
$392,769,158
$392,769,158
$79,337,799
$386,754,672
$1,868,970,354
$1,868,970,354
$464,441,692
$1,006,369,609
$398,159,053
$398,159,053
$1,185,475,534
$67,292,456
$41,847,688
$41,847,688
$46,332,500
$49,356,276
$268,131,603
$268,131,603
$88,112,692
$231,962,390
$231,962,390
$342,940,853
$342,940,853
$49,499,076
$533,957,340
$533,957,340
$77,533,106
$77,533,106
$10,381,500
$94,099,434
$94,099,434
$128,861,706
$128,861,706
$78,748,007
$18,619,050
$18,619,050
$18,401,900
$18,401,900
$107,312,637
$21,133,000
$21,133,000
$21,133,000
$21,133,000
$130,336,462
$7,938,000
$7,938,000
$34,515,100
$34,515,100
$17,571,675
$34,829,000
$34,829,000
$35,482,687
$1,095,617
$1,222,095
$1,222,095
$1,047,829
$1,026,561
$1,055,272
$1,055,272
$1,564,949
$1,032,286
$1,028,192
$1,028,192
$1,184,146
$1,009,803
$1,071,043
$1,071,043
$990,281
$1,139,716
$1,013,127
$1,013,127
$1,302,720
$1,223,499
$1,230,814
$1,230,814
$945,561
$2,145,925
$1,241,350
$1,241,350
$1,174,836
$1,388,996
$1,388,996
$1,350,161
$1,350,161
$1,337,813
$888,448
$888,448
$1,006,923
$1,006,923
$741,536
$887,731
$887,731
$767,034
$767,034
$865,363
$930,953
$930,953
$1,226,793
$1,226,793
$975,569
$812,808
$812,808
$812,808
$812,808
$905,114
$992,250
$992,250
$1,045,912
$1,045,912
$836,746
$849,488
$849,488
$865,431
$940,000
$1,065,000
$1,065,000
$930,000
$932,500
$975,365
$975,365
$1,360,000
$950,000
$955,000
$955,000
$1,093,000
$880,000
$850,000
$850,000
$862,500
$800,000
$950,000
$950,000
$1,215,000
$1,135,000
$1,147,500
$1,147,500
$895,000
$2,040,000
$1,222,500
$1,222,500
$1,201,000
$1,300,000
$1,300,000
$1,225,000
$1,225,000
$1,260,000
$850,000
$850,000
$949,500
$949,500
$667,500
$825,000
$825,000
$749,000
$749,000
$861,000
$799,000
$799,000
$1,005,000
$1,005,000
$961,500
$742,000
$742,000
$742,000
$742,000
$867,500
$835,000
$835,000
$962,500
$962,500
$757,500
$845,000
$845,000
$775,000
8,367
870
870
271
92
172
172
335
1,404
610
610
113
681
3,314
3,314
863
1,800
651
651
1,494
89
71
71
77
48
311
311
103
291
291
416
416
88
896
896
116
116
23
148
148
281
281
113
28
28
30
30
157
48
48
48
48
341
25
25
75
75
34
129
129
78
46.6%
48.2%
48.2%
51.3%
45.0%
48.5%
48.5%
46.1%
43.9%
43.2%
43.2%
36.4%
45.8%
46.8%
46.8%
47.6%
44.1%
51.7%
51.7%
45.8%
48.8%
42.1%
42.1%
42.8%
33.4%
51.4%
51.4%
53.4%
44.5%
44.5%
42.2%
42.2%
44.1%
52.4%
52.4%
52.7%
52.7%
41.1%
54.9%
54.9%
52.4%
52.4%
50.8%
52.2%
52.2%
52.6%
52.6%
52.5%
51.9%
51.9%
51.9%
51.9%
37.9%
33.7%
33.7%
40.2%
40.2%
44.4%
32.4%
32.4%
41.1%
9,643
983
983
340
107
137
137
399
1,589
635
635
186
768
4,110
4,110
1,047
2,412
651
651
1,663
86
78
78
97
84
308
308
100
314
314
482
482
114
777
777
84
84
36
136
136
244
244
97
28
28
34
34
118
48
48
48
48
473
37
37
72
72
43
209
209
112
2.2
2.1
2.1
2.0
2.2
1.7
1.7
2.4
2.2
2.1
2.1
3.5
2.2
2.3
2.3
2.3
2.7
1.7
1.7
2.3
2.0
2.7
2.7
2.5
4.8
1.8
1.8
1.6
2.5
2.5
2.6
2.6
2.7
1.4
1.4
1.3
1.3
3.1
1.3
1.3
1.4
1.4
1.6
2.1
2.1
1.9
1.9
1.3
1.9
1.9
1.9
1.9
3.1
4.8
4.8
2.4
2.4
2.4
4.0
4.0
2.9
100%
98%
98%
98%
98%
100%
100%
98%
98%
98%
98%
96%
98%
100%
100%
99%
99%
103%
103%
102%
101%
100%
100%
99%
93%
106%
106%
101%
104%
104%
101%
101%
102%
102%
102%
103%
103%
96%
99%
99%
102%
102%
102%
96%
96%
101%
101%
103%
99%
99%
99%
99%
97%
97%
97%
97%
97%
98%
97%
97%
98%
22
21
21
25
22
14
14
22
24
23
23
31
24
24
24
25
25
19
19
21
20
20
20
25
52
17
17
22
19
19
22
22
18
17
17
14
14
29
19
19
16
16
16
26
26
22
22
14
23
23
23
23
27
44
44
23
23
30
33
33
20
33
31
31
35
34
22
22
33
35
32
32
44
36
35
35
34
37
32
32
31
26
32
32
33
79
25
25
30
33
33
33
33
24
25
25
22
22
35
33
33
23
23
26
33
33
32
32
17
39
39
39
39
35
44
44
32
32
42
44
44
24
Toronto Regional Real Estate Board
SUMMARY OF EXISTING HOME TRANSACTIONS All Home Types, February 2023
Market Watch, February 2023
Copyright 2023 Toronto Regional Real Estate Board
3
ALL TRREB AREAS
Sales Dollar Volume Average Price Median Price New Listings SNLR Trend Active Listings Mos Inv (Trend) Avg. SP/LP Avg. LDOM Avg. PDOM
Abc
Abc
Abc
Abc
Abc
Abc
Abc
Abc
Abc
Abc
Abc
Abc
Abc
Abc
Abc
Abc
Abc
Abc
Abc
Abc
Abc
Abc
Abc
Abc
Abc
Abc
Abc
Abc
Abc
Abc
Abc
Abc
Abc
Abc
Abc
Abc
Abc
Abc
Abc
Abc
All TRREB Areas
All TRREB Areas
City of Toronto
City of Toronto
Toronto West
Toronto W01
Toronto W02
Toronto W02
Toronto W03
Toronto W03
Toronto W04
Toronto W05
Toronto W06
Toronto W06
Toronto W07
Toronto W07
Toronto W08
Toronto W09
Toronto W10
Toronto W10
Toronto Central
Toronto Central
Toronto C01
Toronto C02
Toronto C03
Toronto C03
Toronto C04
Toronto C04
Toronto C06
Toronto C07
Toronto C08
Toronto C08
Toronto C09
Toronto C09
Toronto C10
Toronto C11
Toronto C12
Toronto C12
Toronto C13
Toronto C13
Toronto C14
Toronto C15
Toronto East
Toronto East
Toronto E01
Toronto E01
Toronto E02
Toronto E03
Toronto E04
Toronto E04
Toronto E05
Toronto E05
Toronto E06
Toronto E07
Toronto E08
Toronto E08
Toronto E09
Toronto E09
Toronto E10
Toronto E11
4,783
4,783
1,745
1,745
469
37
46
46
39
39
53
64
87
87
14
14
75
23
31
31
883
883
257
55
29
29
33
33
19
64
129
129
15
15
48
25
18
18
41
41
66
84
393
393
41
41
28
57
40
40
32
32
17
40
33
33
45
45
22
38
$5,240,334,140
$5,240,334,140
$1,868,970,354
$1,868,970,354
$464,441,692
$41,036,027
$58,193,718
$58,193,718
$36,219,788
$36,219,788
$45,206,995
$49,888,900
$79,824,814
$79,824,814
$20,674,800
$20,674,800
$90,859,800
$20,592,500
$21,944,350
$21,944,350
$1,006,369,609
$1,006,369,609
$238,146,113
$93,671,706
$39,791,606
$39,791,606
$67,579,054
$67,579,054
$18,730,875
$74,906,688
$97,175,506
$97,175,506
$31,543,800
$31,543,800
$47,579,897
$42,449,800
$43,733,500
$43,733,500
$51,825,212
$51,825,212
$71,239,764
$87,996,088
$398,159,053
$398,159,053
$47,773,553
$47,773,553
$39,418,283
$68,035,444
$35,832,386
$35,832,386
$30,345,000
$30,345,000
$22,906,112
$31,051,987
$32,374,800
$32,374,800
$38,288,800
$38,288,800
$24,164,900
$27,967,788
$1,095,617
$1,095,617
$1,071,043
$1,071,043
$990,281
$1,109,082
$1,265,081
$1,265,081
$928,713
$928,713
$852,962
$779,514
$917,527
$917,527
$1,476,771
$1,476,771
$1,211,464
$895,326
$707,882
$707,882
$1,139,716
$1,139,716
$926,639
$1,703,122
$1,372,124
$1,372,124
$2,047,850
$2,047,850
$985,836
$1,170,417
$753,298
$753,298
$2,102,920
$2,102,920
$991,248
$1,697,992
$2,429,639
$2,429,639
$1,264,030
$1,264,030
$1,079,390
$1,047,572
$1,013,127
$1,013,127
$1,165,209
$1,165,209
$1,407,796
$1,193,604
$895,810
$895,810
$948,281
$948,281
$1,347,418
$776,300
$981,055
$981,055
$850,862
$850,862
$1,098,405
$735,994
$940,000
$940,000
$850,000
$850,000
$862,500
$962,000
$1,140,000
$1,140,000
$960,000
$960,000
$845,000
$794,000
$810,000
$810,000
$1,249,000
$1,249,000
$778,000
$815,000
$580,000
$580,000
$800,000
$800,000
$712,000
$1,150,000
$910,000
$910,000
$1,961,111
$1,961,111
$706,000
$920,000
$687,000
$687,000
$2,052,800
$2,052,800
$736,250
$1,220,000
$1,487,500
$1,487,500
$972,000
$972,000
$777,500
$822,500
$950,000
$950,000
$1,131,000
$1,131,000
$1,269,522
$1,150,000
$937,500
$937,500
$764,000
$764,000
$1,091,500
$630,000
$1,000,000
$1,000,000
$870,000
$870,000
$1,015,000
$742,000
8,367
8,367
3,314
3,314
863
75
94
94
45
45
89
111
159
159
26
26
174
39
51
51
1,800
1,800
533
106
66
66
79
79
42
112
299
299
37
37
94
46
45
45
67
67
129
145
651
651
65
65
56
89
85
85
61
61
42
62
56
56
57
57
46
32
46.6%
46.6%
46.8%
46.8%
47.6%
51.5%
52.8%
52.8%
47.2%
47.2%
47.3%
47.3%
44.0%
44.0%
55.0%
55.0%
47.9%
48.0%
43.5%
43.5%
44.1%
44.1%
43.7%
41.0%
44.7%
44.7%
48.3%
48.3%
39.2%
45.0%
40.4%
40.4%
53.5%
53.5%
45.3%
47.9%
36.0%
36.0%
48.9%
48.9%
44.6%
48.8%
51.7%
51.7%
54.6%
54.6%
52.2%
51.4%
53.6%
53.6%
52.7%
52.7%
49.4%
49.4%
50.4%
50.4%
49.8%
49.8%
51.9%
51.8%
9,643
9,643
4,110
4,110
1,047
79
81
81
52
52
118
146
200
200
27
27
217
53
74
74
2,412
2,412
735
176
75
75
110
110
57
128
418
418
40
40
123
40
80
80
75
75
177
178
651
651
59
59
60
76
85
85
57
57
42
62
68
68
59
59
49
34
2.2
2.2
2.3
2.3
2.3
1.8
1.6
1.6
2.3
2.3
2.4
2.6
2.6
2.6
1.6
1.6
2.2
2.3
2.7
2.7
2.7
2.7
2.8
3.3
2.6
2.6
2.1
2.1
2.9
2.6
3.0
3.0
2.2
2.2
2.5
2.2
5.6
5.6
2.3
2.3
2.8
2.3
1.7
1.7
1.3
1.3
1.4
1.6
1.6
1.6
1.8
1.8
1.9
2.1
2.1
2.1
1.8
1.8
1.6
1.8
100%
100%
100%
100%
99%
101%
104%
104%
99%
99%
100%
99%
99%
99%
99%
99%
98%
97%
98%
98%
99%
99%
98%
95%
98%
98%
100%
100%
100%
99%
99%
99%
100%
100%
101%
99%
99%
99%
102%
102%
98%
99%
103%
103%
104%
104%
105%
104%
108%
108%
105%
105%
91%
106%
100%
100%
105%
105%
101%
102%
22
22
24
24
25
21
20
20
23
23
25
28
23
23
13
13
29
31
28
28
25
25
28
28
15
15
16
16
25
21
27
27
13
13
19
22
23
23
15
15
30
25
19
19
19
19
8
19
20
20
15
15
29
24
18
18
18
18
23
23
33
33
35
35
34
27
26
26
32
32
35
37
34
34
19
19
36
34
48
48
37
37
40
39
19
19
24
24
45
38
35
35
17
17
30
32
41
41
25
25
49
40
32
32
34
34
13
41
30
30
24
24
32
34
36
36
28
28
36
36
Toronto Regional Real Estate Board
SUMMARY OF EXISTING HOME TRANSACTIONS All Home Types, February 2023
Market Watch, February 2023
Copyright 2023 Toronto Regional Real Estate Board
4
City of Toronto Municipal Breakdown
Sales Dollar Volume Average Price Median Price New Listings Avg. SP/LP Avg. LDOM Avg. PDOM
All TRREB Areas
Halton Region
Halton Region
Burlington
Halton Hills
Milton
Milton
Oakville
Peel Region
Brampton
Brampton
Caledon
Mississauga
City of Toronto
City of Toronto
Toronto West
Toronto Central
Toronto East
Toronto East
York Region
Aurora
East Gwillimbury
East Gwillimbury
Georgina
King
Markham
Markham
Newmarket
Richmond Hill
Richmond Hill
Vaughan
Vaughan
Stouffville
Durham Region
Durham Region
Ajax
Ajax
Brock
Clarington
Clarington
Oshawa
Oshawa
Pickering
Scugog
Scugog
Uxbridge
Uxbridge
Whitby
Dufferin County
Dufferin County
Orangeville
Orangeville
Simcoe County
Adjala-Tosorontio
Adjala-Tosorontio
Bradford
Bradford
Essa
Innisfil
Innisfil
New Tecumseth
7,877
874
874
303
83
189
189
299
1,406
667
667
95
644
2,851
2,851
783
1,416
652
652
1,453
87
50
50
82
32
362
362
114
278
278
386
386
62
995
995
133
133
20
172
172
279
279
147
29
29
29
29
186
47
47
47
47
251
15
15
55
55
32
73
73
76
$8,453,111,806
$1,033,436,756
$1,033,436,756
$303,259,254
$85,086,057
$199,559,274
$199,559,274
$445,532,171
$1,428,590,189
$677,796,265
$677,796,265
$123,621,799
$627,172,125
$2,960,574,404
$2,960,574,404
$761,423,904
$1,555,063,734
$644,086,766
$644,086,766
$1,884,044,890
$115,236,956
$64,181,688
$64,181,688
$72,009,000
$67,671,276
$452,958,419
$452,958,419
$133,731,056
$376,234,364
$376,234,364
$518,876,055
$518,876,055
$83,146,076
$883,360,917
$883,360,917
$129,688,507
$129,688,507
$13,853,500
$148,310,234
$148,310,234
$214,912,537
$214,912,537
$131,385,258
$27,139,050
$27,139,050
$34,259,595
$34,259,595
$183,812,236
$38,575,109
$38,575,109
$38,575,109
$38,575,109
$224,529,541
$16,318,000
$16,318,000
$58,004,800
$58,004,800
$26,371,675
$60,329,000
$60,329,000
$63,506,066
$1,073,138
$1,182,422
$1,182,422
$1,000,856
$1,025,133
$1,055,869
$1,055,869
$1,490,074
$1,016,067
$1,016,186
$1,016,186
$1,301,282
$973,870
$1,038,434
$1,038,434
$972,444
$1,098,209
$987,863
$987,863
$1,296,659
$1,324,563
$1,283,634
$1,283,634
$878,159
$2,114,727
$1,251,266
$1,251,266
$1,173,079
$1,353,361
$1,353,361
$1,344,238
$1,344,238
$1,341,066
$887,800
$887,800
$975,102
$975,102
$692,675
$862,269
$862,269
$770,296
$770,296
$893,777
$935,829
$935,829
$1,181,365
$1,181,365
$988,238
$820,747
$820,747
$820,747
$820,747
$894,540
$1,087,867
$1,087,867
$1,054,633
$1,054,633
$824,115
$826,425
$826,425
$835,606
$925,000
$1,015,500
$1,015,500
$899,000
$940,000
$975,000
$975,000
$1,280,000
$930,000
$940,300
$940,300
$1,100,200
$851,000
$829,000
$829,000
$840,000
$780,000
$930,750
$930,750
$1,200,000
$1,195,000
$1,156,900
$1,156,900
$834,000
$1,592,500
$1,230,000
$1,230,000
$1,181,500
$1,253,400
$1,253,400
$1,205,000
$1,205,000
$1,267,500
$848,000
$848,000
$931,000
$931,000
$657,750
$809,000
$809,000
$750,000
$750,000
$861,000
$810,000
$810,000
$1,026,000
$1,026,000
$960,500
$760,000
$760,000
$760,000
$760,000
$860,000
$995,000
$995,000
$970,000
$970,000
$751,250
$810,000
$810,000
$773,750
16,060
1,648
1,648
543
173
316
316
616
2,763
1,200
1,200
248
1,315
6,324
6,324
1,642
3,448
1,234
1,234
2,838
161
122
122
154
90
602
602
202
559
559
798
798
150
1,760
1,760
234
234
49
282
282
529
529
237
61
61
62
62
306
84
84
84
84
643
38
38
136
136
61
252
252
156
99%
98%
98%
97%
97%
100%
100%
97%
98%
98%
98%
96%
98%
99%
99%
99%
98%
102%
102%
101%
99%
98%
98%
98%
93%
105%
105%
100%
103%
103%
99%
99%
101%
101%
101%
102%
102%
96%
99%
99%
101%
101%
101%
98%
98%
98%
98%
101%
97%
97%
97%
97%
97%
96%
96%
96%
96%
97%
97%
97%
98%
25
26
26
28
28
18
18
28
25
23
23
31
26
26
26
28
27
22
22
23
21
22
22
30
50
20
20
21
21
21
24
24
27
19
19
15
15
33
21
21
18
18
20
27
27
23
23
15
30
30
30
30
30
49
49
24
24
30
37
37
24
36
36
36
38
41
26
26
39
38
35
35
46
40
39
39
40
40
34
34
33
27
30
30
39
74
28
28
30
35
35
36
36
37
27
27
24
24
37
34
34
25
25
29
35
35
36
36
21
45
45
45
45
42
57
57
38
38
42
51
51
31
Toronto Regional Real Estate Board
SUMMARY OF EXISTING HOME TRANSACTIONS All Home Types, Year-to-Date 2023
Market Watch, February 2023
Copyright 2023 Toronto Regional Real Estate Board
5
ALL TRREB AREAS
Sales Dollar Volume Average Price Median Price New Listings Avg. SP/LP Avg. LDOM Avg. PDOM
All TRREB Areas
All TRREB Areas
City of Toronto
City of Toronto
Toronto West
Toronto W01
Toronto W02
Toronto W02
Toronto W03
Toronto W03
Toronto W04
Toronto W05
Toronto W06
Toronto W06
Toronto W07
Toronto W07
Toronto W08
Toronto W09
Toronto W10
Toronto W10
Toronto Central
Toronto Central
Toronto C01
Toronto C02
Toronto C03
Toronto C03
Toronto C04
Toronto C04
Toronto C06
Toronto C07
Toronto C08
Toronto C08
Toronto C09
Toronto C09
Toronto C10
Toronto C11
Toronto C12
Toronto C12
Toronto C13
Toronto C13
Toronto C14
Toronto C15
Toronto East
Toronto East
Toronto E01
Toronto E01
Toronto E02
Toronto E03
Toronto E04
Toronto E04
Toronto E05
Toronto E05
Toronto E06
Toronto E07
Toronto E08
Toronto E08
Toronto E09
Toronto E09
Toronto E10
Toronto E11
7,877
7,877
2,851
2,851
783
53
67
67
64
64
94
102
141
141
23
23
142
38
59
59
1,416
1,416
421
83
52
52
67
67
30
104
188
188
22
22
74
45
24
24
65
65
105
136
652
652
63
63
53
85
73
73
63
63
29
61
53
53
75
75
39
58
$8,453,111,806
$8,453,111,806
$2,960,574,404
$2,960,574,404
$761,423,904
$58,407,026
$83,173,718
$83,173,718
$56,793,676
$56,793,676
$80,783,583
$78,373,600
$125,847,002
$125,847,002
$36,799,500
$36,799,500
$164,458,911
$32,687,038
$44,099,850
$44,099,850
$1,555,063,734
$1,555,063,734
$375,418,542
$140,645,636
$69,314,598
$69,314,598
$127,838,942
$127,838,942
$30,004,393
$116,645,788
$143,000,505
$143,000,505
$49,497,300
$49,497,300
$68,626,897
$64,653,300
$53,033,500
$53,033,500
$75,464,612
$75,464,612
$110,393,901
$130,525,820
$644,086,766
$644,086,766
$72,901,553
$72,901,553
$67,262,479
$99,831,444
$64,687,885
$64,687,885
$56,623,576
$56,623,576
$33,430,292
$49,083,987
$49,123,000
$49,123,000
$63,652,076
$63,652,076
$41,465,400
$46,025,074
$1,073,138
$1,073,138
$1,038,434
$1,038,434
$972,444
$1,102,019
$1,241,399
$1,241,399
$887,401
$887,401
$859,400
$768,369
$892,532
$892,532
$1,599,978
$1,599,978
$1,158,161
$860,185
$747,455
$747,455
$1,098,209
$1,098,209
$891,731
$1,694,526
$1,332,973
$1,332,973
$1,908,044
$1,908,044
$1,000,146
$1,121,594
$760,641
$760,641
$2,249,877
$2,249,877
$927,391
$1,436,740
$2,209,729
$2,209,729
$1,160,994
$1,160,994
$1,051,370
$959,749
$987,863
$987,863
$1,157,168
$1,157,168
$1,269,103
$1,174,488
$886,135
$886,135
$898,787
$898,787
$1,152,769
$804,656
$926,849
$926,849
$848,694
$848,694
$1,063,215
$793,536
$925,000
$925,000
$829,000
$829,000
$840,000
$977,500
$1,120,000
$1,120,000
$881,500
$881,500
$824,444
$720,000
$795,000
$795,000
$1,248,000
$1,248,000
$745,500
$815,000
$753,000
$753,000
$780,000
$780,000
$705,000
$1,255,000
$954,500
$954,500
$1,810,000
$1,810,000
$827,000
$830,900
$680,000
$680,000
$2,066,400
$2,066,400
$730,000
$950,000
$1,510,000
$1,510,000
$870,000
$870,000
$770,000
$719,000
$930,750
$930,750
$1,100,000
$1,100,000
$1,230,000
$1,120,000
$925,000
$925,000
$725,000
$725,000
$925,000
$650,000
$905,000
$905,000
$850,000
$850,000
$1,020,000
$770,000
16,060
16,060
6,324
6,324
1,642
126
154
154
105
105
180
209
322
322
46
46
315
72
113
113
3,448
3,448
1,025
222
123
123
148
148
78
213
581
581
54
54
191
80
72
72
129
129
241
291
1,234
1,234
134
134
111
163
145
145
116
116
68
101
113
113
124
124
82
77
99%
99%
99%
99%
99%
100%
102%
102%
99%
99%
99%
97%
98%
98%
97%
97%
98%
96%
98%
98%
98%
98%
98%
95%
98%
98%
97%
97%
98%
99%
99%
99%
98%
98%
101%
99%
97%
97%
101%
101%
98%
99%
102%
102%
102%
102%
103%
102%
105%
105%
103%
103%
94%
104%
100%
100%
104%
104%
98%
101%
25
25
26
26
28
24
21
21
24
24
32
36
23
23
19
19
30
36
31
31
27
27
30
31
16
16
28
28
29
23
28
28
24
24
23
26
23
23
22
22
31
27
22
22
18
18
14
21
19
19
23
23
28
28
22
22
23
23
25
26
36
36
39
39
40
30
27
27
37
37
48
48
35
35
34
34
43
45
48
48
40
40
42
43
23
23
37
37
48
38
36
36
26
26
34
42
42
42
32
32
51
42
34
34
32
32
22
39
27
27
37
37
32
38
36
36
34
34
40
39
Toronto Regional Real Estate Board
SUMMARY OF EXISTING HOME TRANSACTIONS All Home Types, Year-to-Date 2023
Market Watch, February 2023
Copyright 2023 Toronto Regional Real Estate Board
6
City of Toronto Municipal Breakdown
Sales Dollar Volume Average Price Median Price New Listings Active Listings Avg. SP/LP Avg. LDOM
Abc
Abc
Abc
Abc
Abc
Abc
Abc
Abc
Abc
Abc
Abc
Abc
Abc
Abc
Abc
Abc
Abc
Abc
Abc
Abc
Abc
Abc
Abc
Abc
Abc
Abc
Abc
Abc
Abc
Abc
Abc
Abc
Abc
Abc
Abc
Abc
Abc
Abc
Abc
Abc
Abc
All TRREB Areas
Halton Region
Halton Region
Burlington
Halton Hills
Milton
Milton
Oakville
Peel Region
Brampton
Brampton
Caledon
Mississauga
City of Toronto
City of Toronto
Toronto West
Toronto Central
Toronto East
Toronto East
York Region
Aurora
East Gwillimbury
East Gwillimbury
Georgina
King
Markham
Markham
Newmarket
Richmond Hill
Richmond Hill
Vaughan
Vaughan
Stouffville
Durham Region
Durham Region
Ajax
Ajax
Brock
Clarington
Clarington
Oshawa
Oshawa
Pickering
Scugog
Scugog
Uxbridge
Uxbridge
Whitby
Dufferin County
Dufferin County
Orangeville
Orangeville
Simcoe County
Adjala-Tosorontio
Adjala-Tosorontio
Bradford
Bradford
Essa
Innisfil
Innisfil
New Tecumseth
2,075
265
265
79
33
56
56
97
364
198
198
44
122
482
482
159
152
171
171
467
30
23
23
42
18
83
83
53
76
76
116
116
26
373
373
46
46
12
72
72
108
108
33
17
17
12
12
73
12
12
12
12
112
8
8
23
23
17
34
34
30
$2,987,451,029
$405,766,778
$405,766,778
$109,231,174
$36,329,807
$73,821,691
$73,821,691
$186,384,106
$490,545,597
$243,981,454
$243,981,454
$58,212,500
$188,351,643
$825,359,413
$825,359,413
$232,563,260
$367,498,273
$225,297,880
$225,297,880
$778,773,153
$46,970,288
$30,857,600
$30,857,600
$40,974,500
$43,946,276
$142,446,852
$142,446,852
$69,869,792
$144,395,821
$144,395,821
$220,988,836
$220,988,836
$38,323,188
$368,021,026
$368,021,026
$52,267,585
$52,267,585
$8,981,500
$70,402,801
$70,402,801
$91,667,566
$91,667,566
$36,858,875
$16,504,050
$16,504,050
$15,598,900
$15,598,900
$75,739,749
$12,347,500
$12,347,500
$12,347,500
$12,347,500
$106,637,562
$7,938,000
$7,938,000
$25,752,700
$25,752,700
$15,274,175
$29,807,000
$29,807,000
$27,865,687
$1,439,735
$1,531,195
$1,531,195
$1,382,673
$1,100,903
$1,318,244
$1,318,244
$1,921,486
$1,347,653
$1,232,230
$1,232,230
$1,323,011
$1,543,866
$1,712,364
$1,712,364
$1,462,662
$2,417,752
$1,317,531
$1,317,531
$1,667,608
$1,565,676
$1,341,635
$1,341,635
$975,583
$2,441,460
$1,716,227
$1,716,227
$1,318,298
$1,899,945
$1,899,945
$1,905,076
$1,905,076
$1,473,969
$986,652
$986,652
$1,136,252
$1,136,252
$748,458
$977,817
$977,817
$848,774
$848,774
$1,116,936
$970,826
$970,826
$1,299,908
$1,299,908
$1,037,531
$1,028,958
$1,028,958
$1,028,958
$1,028,958
$952,121
$992,250
$992,250
$1,119,683
$1,119,683
$898,481
$876,676
$876,676
$928,856
$1,257,000
$1,355,000
$1,355,000
$1,251,000
$1,065,000
$1,227,500
$1,227,500
$1,738,000
$1,270,000
$1,202,953
$1,202,953
$1,255,000
$1,364,000
$1,346,500
$1,346,500
$1,200,000
$2,035,400
$1,180,800
$1,180,800
$1,533,000
$1,505,500
$1,290,000
$1,290,000
$943,500
$2,169,250
$1,628,888
$1,628,888
$1,286,000
$1,732,500
$1,732,500
$1,672,500
$1,672,500
$1,309,000
$931,900
$931,900
$1,074,500
$1,074,500
$667,500
$880,000
$880,000
$838,750
$838,750
$1,065,000
$800,000
$800,000
$1,215,000
$1,215,000
$999,000
$935,000
$935,000
$935,000
$935,000
$907,500
$835,000
$835,000
$1,115,000
$1,115,000
$803,875
$889,500
$889,500
$836,944
3,646
472
472
128
75
82
82
187
655
328
328
84
243
867
867
264
312
291
291
791
56
57
57
64
41
123
123
66
147
147
179
179
58
552
552
73
73
20
84
84
177
177
51
26
26
21
21
100
30
30
30
30
279
25
25
62
62
25
113
113
54
4,091
539
539
151
92
79
79
217
808
369
369
167
272
920
920
303
392
225
225
954
64
68
68
85
75
137
137
65
160
160
216
216
84
470
470
48
48
35
78
78
141
141
43
26
26
26
26
73
32
32
32
32
368
37
37
59
59
36
165
165
71
99%
98%
98%
97%
97%
99%
99%
98%
97%
97%
97%
94%
97%
100%
100%
99%
98%
103%
103%
101%
101%
99%
99%
99%
92%
106%
106%
101%
102%
102%
100%
100%
101%
101%
101%
102%
102%
96%
99%
99%
102%
102%
101%
96%
96%
101%
101%
102%
99%
99%
99%
99%
97%
97%
97%
97%
97%
98%
97%
97%
98%
21
20
20
25
26
14
14
18
26
26
26
38
23
19
19
21
20
15
15
22
20
23
23
26
62
14
14
21
20
20
22
22
19
16
16
12
12
32
21
21
15
15
15
24
24
20
20
11
27
27
27
27
26
44
44
21
21
30
32
32
16
Toronto Regional Real Estate Board
SUMMARY OF EXISTING HOME TRANSACTIONS Detached, February 2023
Market Watch, February 2023
Copyright 2023 Toronto Regional Real Estate Board
7
ALL TRREB AREAS
Sales Dollar Volume Average Price Median Price New Listings Active Listings Avg. SP/LP Avg. LDOM
Abc
Abc
Abc
Abc
Abc
Abc
Abc
Abc
Abc
Abc
Abc
Abc
Abc
Abc
Abc
Abc
Abc
Abc
Abc
Abc
Abc
Abc
Abc
Abc
Abc
Abc
Abc
Abc
Abc
Abc
Abc
Abc
Abc
Abc
Abc
Abc
Abc
Abc
Abc
Abc
All TRREB Areas
All TRREB Areas
City of Toronto
City of Toronto
Toronto West
Toronto W01
Toronto W02
Toronto W02
Toronto W03
Toronto W03
Toronto W04
Toronto W05
Toronto W06
Toronto W06
Toronto W07
Toronto W07
Toronto W08
Toronto W09
Toronto W10
Toronto W10
Toronto Central
Toronto Central
Toronto C01
Toronto C02
Toronto C03
Toronto C03
Toronto C04
Toronto C04
Toronto C06
Toronto C07
Toronto C08
Toronto C08
Toronto C09
Toronto C09
Toronto C10
Toronto C11
Toronto C12
Toronto C12
Toronto C13
Toronto C13
Toronto C14
Toronto C15
Toronto East
Toronto East
Toronto E01
Toronto E01
Toronto E02
Toronto E03
Toronto E04
Toronto E04
Toronto E05
Toronto E05
Toronto E06
Toronto E07
Toronto E08
Toronto E08
Toronto E09
Toronto E09
Toronto E10
Toronto E11
2,075
2,075
482
482
159
8
16
16
21
21
25
14
18
18
10
10
28
10
9
9
152
152
3
7
10
10
20
20
8
29
0
0
5
5
6
10
8
8
14
14
12
20
171
171
8
8
11
32
16
16
14
14
12
9
18
18
24
24
15
12
$2,987,451,029
$2,987,451,029
$825,359,413
$825,359,413
$232,563,260
$14,901,027
$28,893,000
$28,893,000
$21,739,888
$21,739,888
$28,513,195
$14,565,000
$25,088,500
$25,088,500
$17,504,800
$17,504,800
$58,374,000
$13,297,000
$9,686,850
$9,686,850
$367,498,273
$367,498,273
$11,350,000
$28,252,000
$23,815,906
$23,815,906
$52,509,554
$52,509,554
$11,901,875
$50,121,388
$15,116,800
$15,116,800
$12,696,250
$29,246,000
$32,810,000
$32,810,000
$30,619,000
$30,619,000
$30,662,000
$38,397,500
$225,297,880
$225,297,880
$13,250,100
$13,250,100
$18,540,583
$45,361,200
$18,396,886
$18,396,886
$18,603,400
$18,603,400
$18,785,111
$11,074,000
$24,113,800
$24,113,800
$26,015,800
$26,015,800
$19,558,000
$11,599,000
$1,439,735
$1,439,735
$1,712,364
$1,712,364
$1,462,662
$1,862,628
$1,805,813
$1,805,813
$1,035,233
$1,035,233
$1,140,528
$1,040,357
$1,393,806
$1,393,806
$1,750,480
$1,750,480
$2,084,786
$1,329,700
$1,076,317
$1,076,317
$2,417,752
$2,417,752
$3,783,333
$4,036,000
$2,381,591
$2,381,591
$2,625,478
$2,625,478
$1,487,734
$1,728,324
$3,023,360
$3,023,360
$2,116,042
$2,924,600
$4,101,250
$4,101,250
$2,187,071
$2,187,071
$2,555,167
$1,919,875
$1,317,531
$1,317,531
$1,656,263
$1,656,263
$1,685,508
$1,417,538
$1,149,805
$1,149,805
$1,328,814
$1,328,814
$1,565,426
$1,230,444
$1,339,656
$1,339,656
$1,083,992
$1,083,992
$1,303,867
$966,583
$1,257,000
$1,257,000
$1,346,500
$1,346,500
$1,200,000
$2,029,500
$1,585,000
$1,585,000
$1,020,000
$1,020,000
$1,088,000
$1,038,500
$1,191,250
$1,191,250
$1,286,000
$1,286,000
$1,757,500
$1,300,000
$1,100,000
$1,100,000
$2,035,400
$2,035,400
$4,600,000
$1,677,000
$2,077,000
$2,077,000
$2,427,500
$2,427,500
$1,552,500
$1,525,000
$2,628,000
$2,628,000
$2,113,125
$3,193,000
$3,800,000
$3,800,000
$2,250,000
$2,250,000
$2,053,000
$1,744,500
$1,180,800
$1,180,800
$1,750,000
$1,750,000
$1,330,000
$1,360,900
$1,125,000
$1,125,000
$1,308,900
$1,308,900
$1,255,556
$1,215,000
$1,156,400
$1,156,400
$1,097,500
$1,097,500
$1,200,000
$936,500
3,646
3,646
867
867
264
17
32
32
18
18
37
22
34
34
15
15
57
16
16
16
312
312
11
7
29
29
52
52
11
40
2
2
15
15
18
11
32
32
21
21
34
29
291
291
16
16
19
56
36
36
19
19
30
22
31
31
26
26
28
8
4,091
4,091
920
920
303
12
18
18
26
26
46
33
47
47
15
15
60
21
25
25
392
392
13
16
38
38
59
59
18
37
3
3
15
15
14
5
68
68
25
25
54
27
225
225
13
13
16
48
32
32
11
11
22
15
26
26
13
13
24
5
99%
99%
100%
100%
99%
103%
104%
104%
98%
98%
100%
98%
98%
98%
99%
99%
97%
96%
97%
97%
98%
98%
99%
91%
98%
98%
99%
99%
100%
99%
103%
103%
103%
99%
98%
98%
102%
102%
97%
97%
103%
103%
105%
105%
103%
103%
111%
111%
107%
107%
90%
113%
101%
101%
107%
107%
101%
103%
21
21
19
19
21
9
15
15
26
26
22
18
30
30
14
14
21
24
26
26
20
20
5
57
10
10
14
14
30
18
3
3
4
15
26
26
16
16
34
22
15
15
22
22
8
17
23
23
9
9
34
12
8
8
12
12
13
9
Toronto Regional Real Estate Board
SUMMARY OF EXISTING HOME TRANSACTIONS Detached, February 2023
Market Watch, February 2023
Copyright 2023 Toronto Regional Real Estate Board
8
City of Toronto Municipal Breakdown
Sales Dollar Volume Average Price Median Price New Listings Active Listings Avg. SP/LP Avg. LDOM
Abc
Abc
Abc
Abc
Abc
Abc
Abc
Abc
Abc
Abc
Abc
Abc
Abc
Abc
Abc
Abc
Abc
Abc
Abc
Abc
Abc
Abc
Abc
Abc
Abc
Abc
Abc
Abc
Abc
Abc
Abc
Abc
Abc
Abc
Abc
Abc
Abc
Abc
Abc
Abc
Abc
All TRREB Areas
Halton Region
Halton Region
Burlington
Halton Hills
Milton
Milton
Oakville
Peel Region
Brampton
Brampton
Caledon
Mississauga
City of Toronto
City of Toronto
Toronto West
Toronto Central
Toronto East
Toronto East
York Region
Aurora
East Gwillimbury
East Gwillimbury
Georgina
King
Markham
Markham
Newmarket
Richmond Hill
Richmond Hill
Vaughan
Vaughan
Stouffville
Durham Region
Durham Region
Ajax
Ajax
Brock
Clarington
Clarington
Oshawa
Oshawa
Pickering
Scugog
Scugog
Uxbridge
Uxbridge
Whitby
Dufferin County
Dufferin County
Orangeville
Orangeville
Simcoe County
Adjala-Tosorontio
Adjala-Tosorontio
Bradford
Bradford
Essa
Innisfil
Innisfil
New Tecumseth
399
25
25
7
3
7
7
8
119
72
72
5
42
144
144
45
45
54
54
51
2
3
3
1
0
9
9
7
12
12
15
15
2
47
47
4
4
0
7
7
24
24
6
0
0
1
1
5
5
5
5
5
8
0
0
5
5
1
0
0
2
$426,637,137
$26,171,000
$26,171,000
$6,817,500
$2,632,000
$7,096,000
$7,096,000
$9,625,500
$114,517,524
$65,932,597
$65,932,597
$5,185,200
$43,399,727
$184,374,714
$184,374,714
$48,584,518
$70,598,034
$65,192,162
$65,192,162
$55,421,621
$1,843,888
$3,155,000
$3,155,000
$773,000
$10,929,000
$10,929,000
$5,735,900
$14,068,000
$14,068,000
$16,744,833
$16,744,833
$2,172,000
$36,318,278
$36,318,278
$3,480,555
$3,480,555
$5,398,500
$5,398,500
$16,524,000
$16,524,000
$5,210,323
$932,000
$932,000
$4,772,900
$3,117,500
$3,117,500
$3,117,500
$3,117,500
$6,716,500
$4,661,500
$4,661,500
$560,000
$1,495,000
$1,069,266
$1,046,840
$1,046,840
$973,929
$877,333
$1,013,714
$1,013,714
$1,203,188
$962,332
$915,731
$915,731
$1,037,040
$1,033,327
$1,280,380
$1,280,380
$1,079,656
$1,568,845
$1,207,262
$1,207,262
$1,086,698
$921,944
$1,051,667
$1,051,667
$773,000
$1,214,333
$1,214,333
$819,414
$1,172,333
$1,172,333
$1,116,322
$1,116,322
$1,086,000
$772,729
$772,729
$870,139
$870,139
$771,214
$771,214
$688,500
$688,500
$868,387
$932,000
$932,000
$954,580
$623,500
$623,500
$623,500
$623,500
$839,563
$932,300
$932,300
$560,000
$747,500
$980,000
$1,061,000
$1,061,000
$972,500
$894,000
$985,000
$985,000
$1,196,250
$955,000
$908,500
$908,500
$1,025,000
$989,889
$1,133,000
$1,133,000
$975,000
$1,350,000
$1,140,500
$1,140,500
$1,084,000
$921,944
$1,055,000
$1,055,000
$773,000
$1,232,000
$1,232,000
$800,000
$1,130,000
$1,130,000
$1,088,000
$1,088,000
$1,086,000
$728,000
$728,000
$893,000
$893,000
$860,000
$860,000
$677,000
$677,000
$860,550
$932,000
$932,000
$975,000
$615,000
$615,000
$615,000
$615,000
$872,500
$935,000
$935,000
$560,000
$747,500
587
32
32
10
3
12
12
7
180
108
108
8
64
222
222
81
73
68
68
79
5
6
6
3
0
14
14
8
24
24
17
17
2
61
61
5
5
0
3
3
31
31
10
1
1
2
2
9
3
3
3
3
10
0
0
6
6
3
0
0
1
445
19
19
7
2
7
7
3
130
78
78
5
47
198
198
81
74
43
43
53
3
4
4
2
0
9
9
5
17
17
12
12
1
30
30
4
4
0
2
2
10
10
6
1
1
1
1
6
2
2
2
2
13
0
0
9
9
2
0
0
2
102%
103%
103%
104%
103%
103%
103%
102%
101%
101%
101%
106%
101%
102%
102%
101%
99%
106%
106%
105%
101%
101%
101%
97%
113%
113%
103%
111%
111%
100%
100%
99%
106%
106%
106%
106%
101%
101%
107%
107%
114%
99%
99%
103%
96%
96%
96%
96%
102%
101%
101%
102%
104%
15
9
9
10
4
7
7
13
14
13
13
14
17
19
19
19
30
11
11
14
8
12
12
0
14
14
6
12
12
20
20
23
9
9
11
11
9
9
8
8
7
27
27
18
16
16
16
16
26
26
26
6
36
Toronto Regional Real Estate Board
SUMMARY OF EXISTING HOME TRANSACTIONS Semi-Detached, February 2023
Market Watch, February 2023
Copyright 2023 Toronto Regional Real Estate Board
9
ALL TRREB AREAS
Sales Dollar Volume Average Price Median Price New Listings Active Listings Avg. SP/LP Avg. LDOM
Abc
Abc
Abc
Abc
Abc
Abc
Abc
Abc
Abc
Abc
Abc
Abc
Abc
Abc
Abc
Abc
Abc
Abc
Abc
Abc
Abc
Abc
Abc
Abc
Abc
Abc
Abc
Abc
Abc
Abc
Abc
Abc
Abc
Abc
Abc
Abc
Abc
Abc
Abc
Abc
All TRREB Areas
All TRREB Areas
City of Toronto
City of Toronto
Toronto West
Toronto W01
Toronto W02
Toronto W02
Toronto W03
Toronto W03
Toronto W04
Toronto W05
Toronto W06
Toronto W06
Toronto W07
Toronto W07
Toronto W08
Toronto W09
Toronto W10
Toronto W10
Toronto Central
Toronto Central
Toronto C01
Toronto C02
Toronto C03
Toronto C03
Toronto C04
Toronto C04
Toronto C06
Toronto C07
Toronto C08
Toronto C08
Toronto C09
Toronto C09
Toronto C10
Toronto C11
Toronto C12
Toronto C12
Toronto C13
Toronto C13
Toronto C14
Toronto C15
Toronto East
Toronto East
Toronto E01
Toronto E01
Toronto E02
Toronto E03
Toronto E04
Toronto E04
Toronto E05
Toronto E05
Toronto E06
Toronto E07
Toronto E08
Toronto E08
Toronto E09
Toronto E09
Toronto E10
Toronto E11
399
399
144
144
45
3
10
10
8
8
2
18
1
1
0
0
1
2
0
0
45
45
15
5
6
6
5
5
1
1
0
0
1
1
4
3
0
0
2
2
0
2
54
54
14
14
9
14
5
5
0
0
2
3
1
1
0
0
1
5
$426,637,137
$426,637,137
$184,374,714
$184,374,714
$48,584,518
$4,435,000
$13,210,218
$13,210,218
$8,389,900
$8,389,900
$2,030,000
$16,419,400
$1,060,000
$1,060,000
$1,250,000
$1,790,000
$70,598,034
$70,598,034
$26,229,000
$9,747,000
$7,424,000
$7,424,000
$6,375,000
$6,375,000
$948,000
$940,000
$4,500,000
$4,500,000
$5,818,734
$4,404,800
$1,954,000
$1,954,000
$2,257,500
$65,192,162
$65,192,162
$19,751,906
$19,751,906
$12,659,500
$17,431,455
$4,118,000
$4,118,000
$2,061,001
$3,148,800
$935,000
$935,000
$735,000
$4,351,500
$1,069,266
$1,069,266
$1,280,380
$1,280,380
$1,079,656
$1,478,333
$1,321,022
$1,321,022
$1,048,738
$1,048,738
$1,015,000
$912,189
$1,060,000
$1,060,000
$1,250,000
$895,000
$1,568,845
$1,568,845
$1,748,600
$1,949,400
$1,237,333
$1,237,333
$1,275,000
$1,275,000
$948,000
$940,000
$4,500,000
$4,500,000
$1,454,684
$1,468,267
$977,000
$977,000
$1,128,750
$1,207,262
$1,207,262
$1,410,850
$1,410,850
$1,406,611
$1,245,104
$823,600
$823,600
$1,030,501
$1,049,600
$935,000
$935,000
$735,000
$870,300
$980,000
$980,000
$1,133,000
$1,133,000
$975,000
$1,475,000
$1,290,010
$1,290,010
$977,500
$977,500
$1,015,000
$915,000
$1,060,000
$1,060,000
$1,250,000
$895,000
$1,350,000
$1,350,000
$1,635,000
$1,999,000
$972,000
$972,000
$1,275,000
$1,275,000
$948,000
$940,000
$4,500,000
$4,500,000
$1,346,250
$1,555,000
$977,000
$977,000
$1,128,750
$1,140,500
$1,140,500
$1,420,000
$1,420,000
$1,338,000
$1,183,200
$765,000
$765,000
$1,030,501
$1,077,000
$935,000
$935,000
$735,000
$891,500
587
587
222
222
81
8
24
24
14
14
2
27
2
2
0
0
3
1
0
0
73
73
24
9
8
8
6
6
2
6
2
2
2
2
7
1
1
1
1
1
0
4
68
68
21
21
16
20
3
3
0
0
1
1
0
0
1
1
1
4
445
445
198
198
81
10
20
20
17
17
2
23
4
4
1
1
2
0
2
2
74
74
25
15
6
6
3
3
2
8
4
4
2
2
3
0
1
1
1
1
0
4
43
43
14
14
8
12
0
0
0
0
1
3
0
0
1
1
1
3
102%
102%
102%
102%
101%
108%
104%
104%
100%
100%
93%
99%
97%
97%
104%
100%
99%
99%
96%
100%
98%
98%
107%
107%
95%
94%
94%
94%
109%
97%
102%
102%
100%
106%
106%
105%
105%
109%
109%
106%
106%
95%
103%
99%
99%
100%
105%
15
15
19
19
19
6
19
19
15
15
25
23
42
42
3
3
30
30
48
19
25
25
14
14
58
4
17
17
6
45
19
19
18
11
11
13
13
6
7
5
5
28
27
17
17
4
10
Toronto Regional Real Estate Board
SUMMARY OF EXISTING HOME TRANSACTIONS Semi-Detached, February 2023
Market Watch, February 2023
Copyright 2023 Toronto Regional Real Estate Board
10
City of Toronto Municipal Breakdown
Sales Dollar Volume Average Price Median Price New Listings Active Listings Avg. SP/LP Avg. LDOM
Abc
Abc
Abc
Abc
Abc
Abc
Abc
Abc
Abc
Abc
Abc
Abc
Abc
Abc
Abc
Abc
Abc
Abc
Abc
Abc
Abc
Abc
Abc
Abc
Abc
Abc
Abc
Abc
Abc
Abc
Abc
Abc
Abc
Abc
Abc
Abc
Abc
Abc
Abc
Abc
Abc
All TRREB Areas
Halton Region
Halton Region
Burlington
Halton Hills
Milton
Milton
Oakville
Peel Region
Brampton
Brampton
Caledon
Mississauga
City of Toronto
City of Toronto
Toronto West
Toronto Central
Toronto East
Toronto East
York Region
Aurora
East Gwillimbury
East Gwillimbury
Georgina
King
Markham
Markham
Newmarket
Richmond Hill
Richmond Hill
Vaughan
Vaughan
Stouffville
Durham Region
Durham Region
Ajax
Ajax
Brock
Clarington
Clarington
Oshawa
Oshawa
Pickering
Scugog
Scugog
Uxbridge
Uxbridge
Whitby
Dufferin County
Dufferin County
Orangeville
Orangeville
Simcoe County
Adjala-Tosorontio
Adjala-Tosorontio
Bradford
Bradford
Essa
Innisfil
Innisfil
New Tecumseth
463
96
96
15
8
40
40
33
83
51
51
15
17
57
57
14
29
14
14
134
6
8
8
3
1
34
34
6
29
29
40
40
7
74
74
13
13
1
12
12
7
7
16
1
1
2
2
22
3
3
3
3
16
0
0
4
4
3
3
3
6
$486,308,365
$97,566,687
$97,566,687
$13,479,999
$7,005,000
$36,832,086
$36,832,086
$40,249,602
$76,112,348
$45,466,400
$45,466,400
$13,570,199
$17,075,749
$75,811,063
$75,811,063
$16,681,527
$44,725,747
$14,403,789
$14,403,789
$158,586,355
$6,378,000
$7,835,088
$7,835,088
$2,343,000
$1,460,000
$41,954,364
$41,954,364
$6,346,000
$37,626,888
$37,626,888
$47,069,127
$47,069,127
$7,573,888
$64,508,512
$64,508,512
$12,623,300
$12,623,300
$775,000
$8,799,923
$8,799,923
$5,668,000
$5,668,000
$13,974,689
$810,000
$810,000
$1,871,000
$1,871,000
$19,986,600
$2,239,000
$2,239,000
$2,239,000
$2,239,000
$11,484,400
$3,420,900
$3,420,900
$1,737,500
$2,150,000
$2,150,000
$4,176,000
$1,050,342
$1,016,320
$1,016,320
$898,667
$875,625
$920,802
$920,802
$1,219,685
$917,016
$891,498
$891,498
$904,680
$1,004,456
$1,330,019
$1,330,019
$1,191,538
$1,542,267
$1,028,842
$1,028,842
$1,183,480
$1,063,000
$979,386
$979,386
$781,000
$1,460,000
$1,233,952
$1,233,952
$1,057,667
$1,297,479
$1,297,479
$1,176,728
$1,176,728
$1,081,984
$871,737
$871,737
$971,023
$971,023
$775,000
$733,327
$733,327
$809,714
$809,714
$873,418
$810,000
$810,000
$935,500
$935,500
$908,482
$746,333
$746,333
$746,333
$746,333
$717,775
$855,225
$855,225
$579,167
$716,667
$716,667
$696,000
$968,000
$939,000
$939,000
$898,000
$875,000
$935,000
$935,000
$1,180,000
$916,000
$905,000
$905,000
$925,000
$970,000
$1,150,000
$1,150,000
$1,112,500
$1,282,000
$968,000
$968,000
$1,150,000
$1,029,500
$974,000
$974,000
$795,000
$1,460,000
$1,200,000
$1,200,000
$980,500
$1,300,000
$1,300,000
$1,156,000
$1,156,000
$1,065,000
$879,444
$879,444
$945,000
$945,000
$775,000
$770,250
$770,250
$810,000
$810,000
$893,750
$810,000
$810,000
$935,500
$935,500
$905,000
$749,000
$749,000
$749,000
$749,000
$703,000
$864,000
$864,000
$620,000
$695,000
$695,000
$693,000
654
120
120
17
11
52
52
40
96
65
65
18
13
94
94
30
42
22
22
197
10
8
8
5
1
48
48
10
45
45
56
56
14
108
108
19
19
1
24
24
18
18
16
1
1
3
3
26
7
7
7
7
32
0
0
4
4
6
9
9
13
516
77
77
15
8
23
23
31
76
55
55
11
10
85
85
29
41
15
15
144
4
6
6
3
2
40
40
9
31
31
42
42
7
86
86
18
18
0
17
17
23
23
5
1
1
3
3
19
6
6
6
6
42
0
0
2
2
5
18
18
17
104%
100%
100%
98%
98%
101%
101%
101%
99%
100%
100%
99%
97%
103%
103%
108%
100%
106%
106%
110%
108%
102%
102%
102%
97%
112%
112%
103%
115%
115%
107%
107%
108%
104%
104%
103%
103%
97%
101%
101%
102%
102%
106%
98%
98%
99%
99%
105%
98%
98%
98%
98%
97%
98%
98%
97%
97%
97%
97%
17
17
17
14
13
14
14
23
17
15
15
16
24
17
17
13
18
16
16
15
8
14
14
31
23
12
12
13
9
9
22
22
15
19
19
24
24
13
12
12
32
32
14
16
16
30
30
19
10
10
10
10
31
26
26
35
27
27
33
Toronto Regional Real Estate Board
SUMMARY OF EXISTING HOME TRANSACTIONS Att/Row/Townhouse, February 2023
Market Watch, February 2023
Copyright 2023 Toronto Regional Real Estate Board
11
ALL TRREB AREAS
Sales Dollar Volume Average Price Median Price New Listings Active Listings Avg. SP/LP Avg. LDOM
Abc
Abc
Abc
Abc
Abc
Abc
Abc
Abc
Abc
Abc
Abc
Abc
Abc
Abc
Abc
Abc
Abc
Abc
Abc
Abc
Abc
Abc
Abc
Abc
Abc
Abc
Abc
Abc
Abc
Abc
Abc
Abc
Abc
Abc
Abc
Abc
Abc
Abc
Abc
Abc
All TRREB Areas
All TRREB Areas
City of Toronto
City of Toronto
Toronto West
Toronto W01
Toronto W02
Toronto W02
Toronto W03
Toronto W03
Toronto W04
Toronto W05
Toronto W06
Toronto W06
Toronto W07
Toronto W07
Toronto W08
Toronto W09
Toronto W10
Toronto W10
Toronto Central
Toronto Central
Toronto C01
Toronto C02
Toronto C03
Toronto C03
Toronto C04
Toronto C04
Toronto C06
Toronto C07
Toronto C08
Toronto C08
Toronto C09
Toronto C09
Toronto C10
Toronto C11
Toronto C12
Toronto C12
Toronto C13
Toronto C13
Toronto C14
Toronto C15
Toronto East
Toronto East
Toronto E01
Toronto E01
Toronto E02
Toronto E03
Toronto E04
Toronto E04
Toronto E05
Toronto E05
Toronto E06
Toronto E07
Toronto E08
Toronto E08
Toronto E09
Toronto E09
Toronto E10
Toronto E11
463
463
57
57
14
2
2
2
2
2
1
2
2
2
1
1
1
0
1
1
29
29
11
4
0
0
0
0
0
1
4
4
1
1
3
1
0
0
4
4
0
0
14
14
4
4
2
0
5
5
0
0
0
1
0
0
0
0
1
1
$486,308,365
$486,308,365
$75,811,063
$75,811,063
$16,681,527
$2,480,000
$2,951,600
$2,951,600
$1,970,000
$1,970,000
$892,000
$2,225,000
$2,557,927
$2,557,927
$1,300,000
$1,300,000
$1,342,000
$963,000
$963,000
$44,725,747
$44,725,747
$17,034,748
$9,670,000
$1,183,000
$5,240,000
$5,240,000
$2,100,000
$2,100,000
$3,700,000
$1,150,000
$4,647,999
$4,647,999
$14,403,789
$14,403,789
$3,886,489
$3,886,489
$3,150,000
$4,746,500
$4,746,500
$800,800
$900,000
$920,000
$1,050,342
$1,050,342
$1,330,019
$1,330,019
$1,191,538
$1,240,000
$1,475,800
$1,475,800
$985,000
$985,000
$892,000
$1,112,500
$1,278,964
$1,278,964
$1,300,000
$1,300,000
$1,342,000
$963,000
$963,000
$1,542,267
$1,542,267
$1,548,613
$2,417,500
$1,183,000
$1,310,000
$1,310,000
$2,100,000
$2,100,000
$1,233,333
$1,150,000
$1,162,000
$1,162,000
$1,028,842
$1,028,842
$971,622
$971,622
$1,575,000
$949,300
$949,300
$800,800
$900,000
$920,000
$968,000
$968,000
$1,150,000
$1,150,000
$1,112,500
$1,240,000
$1,475,800
$1,475,800
$985,000
$985,000
$892,000
$1,112,500
$1,278,964
$1,278,964
$1,300,000
$1,300,000
$1,342,000
$963,000
$963,000
$1,282,000
$1,282,000
$1,282,000
$2,300,000
$1,183,000
$1,200,000
$1,200,000
$2,100,000
$2,100,000
$1,100,000
$1,150,000
$1,223,000
$1,223,000
$968,000
$968,000
$1,040,000
$1,040,000
$1,575,000
$991,000
$991,000
$800,800
$900,000
$920,000
654
654
94
94
30
2
7
7
0
0
1
2
7
7
2
2
4
2
3
3
42
42
15
6
0
0
1
1
0
0
10
10
2
2
1
2
0
0
5
5
0
0
22
22
6
6
5
0
5
5
1
1
0
1
0
0
0
0
2
2
516
516
85
85
29
1
8
8
0
0
1
4
4
4
2
2
4
2
3
3
41
41
14
4
3
3
1
1
1
2
13
13
1
1
0
0
0
0
1
1
1
0
15
15
5
5
2
0
2
2
1
1
0
0
0
0
0
0
2
3
104%
104%
103%
103%
108%
106%
128%
128%
107%
107%
112%
102%
109%
109%
98%
98%
96%
98%
98%
100%
100%
102%
96%
99%
100%
100%
105%
105%
98%
97%
103%
103%
106%
106%
104%
104%
105%
108%
108%
115%
100%
115%
17
17
17
17
13
11
7
7
10
10
7
23
10
10
17
17
29
14
14
18
18
12
25
70
30
30
4
4
12
17
14
14
16
16
28
28
7
15
15
7
11
8
Toronto Regional Real Estate Board
SUMMARY OF EXISTING HOME TRANSACTIONS Att/Row/Townhouse, February 2023
Market Watch, February 2023
Copyright 2023 Toronto Regional Real Estate Board
12
City of Toronto Municipal Breakdown
Sales Dollar Volume Average Price Median Price New Listings Active Listings Avg. SP/LP Avg. LDOM
Abc
Abc
Abc
Abc
Abc
Abc
Abc
Abc
Abc
Abc
Abc
Abc
Abc
Abc
Abc
Abc
Abc
Abc
Abc
Abc
Abc
Abc
Abc
Abc
Abc
Abc
Abc
Abc
Abc
Abc
Abc
Abc
Abc
Abc
Abc
Abc
Abc
Abc
Abc
Abc
Abc
All TRREB Areas
Halton Region
Halton Region
Burlington
Halton Hills
Milton
Milton
Oakville
Peel Region
Brampton
Brampton
Caledon
Mississauga
City of Toronto
City of Toronto
Toronto West
Toronto Central
Toronto East
Toronto East
York Region
Aurora
East Gwillimbury
East Gwillimbury
Georgina
King
Markham
Markham
Newmarket
Richmond Hill
Richmond Hill
Vaughan
Vaughan
Stouffville
Durham Region
Durham Region
Ajax
Ajax
Brock
Clarington
Clarington
Oshawa
Oshawa
Pickering
Scugog
Scugog
Uxbridge
Uxbridge
Whitby
Dufferin County
Dufferin County
Orangeville
Orangeville
Simcoe County
Adjala-Tosorontio
Adjala-Tosorontio
Bradford
Bradford
Essa
Innisfil
Innisfil
New Tecumseth
358
51
51
31
1
7
7
12
98
29
29
0
69
104
104
41
32
31
31
52
10
0
0
1
0
22
22
5
6
6
6
6
2
48
48
6
6
1
6
6
15
15
16
0
0
0
0
4
1
1
1
1
4
0
0
1
1
0
0
0
3
$281,190,457
$38,368,316
$38,368,316
$22,806,317
$650,000
$5,220,000
$5,220,000
$9,691,999
$75,380,006
$19,953,901
$19,953,901
$55,426,105
$86,049,058
$86,049,058
$31,234,500
$31,643,600
$23,170,958
$23,170,958
$45,922,420
$7,766,280
$495,000
$20,849,799
$20,849,799
$3,934,000
$5,577,791
$5,577,791
$5,869,550
$5,869,550
$1,430,000
$32,244,657
$32,244,657
$4,267,275
$4,267,275
$625,000
$4,531,322
$4,531,322
$9,203,640
$9,203,640
$10,958,420
$2,659,000
$600,000
$600,000
$600,000
$600,000
$2,626,000
$680,000
$680,000
$1,946,000
$785,448
$752,320
$752,320
$735,688
$650,000
$745,714
$745,714
$807,667
$769,184
$688,066
$688,066
$803,277
$827,395
$827,395
$761,817
$988,863
$747,450
$747,450
$883,123
$776,628
$495,000
$947,718
$947,718
$786,800
$929,632
$929,632
$978,258
$978,258
$715,000
$671,764
$671,764
$711,213
$711,213
$625,000
$755,220
$755,220
$613,576
$613,576
$684,901
$664,750
$600,000
$600,000
$600,000
$600,000
$656,500
$680,000
$680,000
$648,667
$752,000
$720,000
$720,000
$699,000
$650,000
$720,000
$720,000
$760,500
$761,500
$705,000
$705,000
$783,000
$777,500
$777,500
$725,000
$949,000
$750,000
$750,000
$817,000
$776,990
$495,000
$956,500
$956,500
$795,000
$868,950
$868,950
$928,275
$928,275
$715,000
$651,000
$651,000
$707,638
$707,638
$625,000
$653,500
$653,500
$610,000
$610,000
$672,500
$663,500
$600,000
$600,000
$600,000
$600,000
$640,000
$680,000
$680,000
$600,000
621
79
79
46
1
7
7
25
164
47
47
1
116
200
200
67
75
58
58
106
10
0
0
3
1
30
30
10
15
15
32
32
5
68
68
11
11
2
6
6
22
22
20
0
0
2
2
5
0
0
0
0
4
0
0
0
0
0
1
1
3
656
73
73
38
2
5
5
28
177
57
57
1
119
236
236
90
83
63
63
107
6
0
0
4
2
25
25
7
22
22
37
37
4
55
55
7
7
1
4
4
17
17
18
0
0
2
2
6
0
0
0
0
8
0
0
0
0
0
6
6
2
101%
99%
99%
99%
96%
99%
99%
100%
99%
99%
99%
99%
103%
103%
101%
104%
103%
103%
103%
100%
103%
104%
104%
106%
107%
107%
96%
96%
108%
101%
101%
106%
106%
104%
98%
98%
101%
101%
101%
105%
98%
98%
98%
98%
97%
97%
97%
97%
22
24
24
25
27
12
12
29
21
23
23
21
24
24
33
16
21
21
19
27
22
19
19
27
15
15
10
10
5
15
15
8
8
11
21
21
17
17
13
22
75
75
75
75
24
41
41
19
Toronto Regional Real Estate Board
SUMMARY OF EXISTING HOME TRANSACTIONS Condo Townhouse, February 2023
Market Watch, February 2023
Copyright 2023 Toronto Regional Real Estate Board
13
ALL TRREB AREAS
Sales Dollar Volume Average Price Median Price New Listings Active Listings Avg. SP/LP Avg. LDOM
Abc
Abc
Abc
Abc
Abc
Abc
Abc
Abc
Abc
Abc
Abc
Abc
Abc
Abc
Abc
Abc
Abc
Abc
Abc
Abc
Abc
Abc
Abc
Abc
Abc
Abc
Abc
Abc
Abc
Abc
Abc
Abc
Abc
Abc
Abc
Abc
Abc
Abc
Abc
Abc
All TRREB Areas
All TRREB Areas
City of Toronto
City of Toronto
Toronto West
Toronto W01
Toronto W02
Toronto W02
Toronto W03
Toronto W03
Toronto W04
Toronto W05
Toronto W06
Toronto W06
Toronto W07
Toronto W07
Toronto W08
Toronto W09
Toronto W10
Toronto W10
Toronto Central
Toronto Central
Toronto C01
Toronto C02
Toronto C03
Toronto C03
Toronto C04
Toronto C04
Toronto C06
Toronto C07
Toronto C08
Toronto C08
Toronto C09
Toronto C09
Toronto C10
Toronto C11
Toronto C12
Toronto C12
Toronto C13
Toronto C13
Toronto C14
Toronto C15
Toronto East
Toronto East
Toronto E01
Toronto E01
Toronto E02
Toronto E03
Toronto E04
Toronto E04
Toronto E05
Toronto E05
Toronto E06
Toronto E07
Toronto E08
Toronto E08
Toronto E09
Toronto E09
Toronto E10
Toronto E11
358
358
104
104
41
2
7
7
2
2
3
10
6
6
0
0
5
2
4
4
32
32
10
0
0
0
0
0
0
0
1
1
0
0
1
2
3
3
0
0
5
10
31
31
4
4
2
0
3
3
3
3
1
4
0
0
6
6
2
6
$281,190,457
$281,190,457
$86,049,058
$86,049,058
$31,234,500
$2,409,500
$6,190,000
$6,190,000
$1,170,000
$1,170,000
$1,936,500
$6,313,500
$5,356,000
$5,356,000
$3,653,000
$1,590,000
$2,616,000
$2,616,000
$31,643,600
$31,643,600
$8,981,100
$715,000
$715,000
$1,368,000
$2,130,000
$3,837,500
$3,837,500
$4,799,000
$9,813,000
$23,170,958
$23,170,958
$3,347,058
$3,347,058
$1,415,000
$2,615,000
$2,615,000
$2,248,000
$2,248,000
$860,000
$3,236,000
$3,981,000
$3,981,000
$1,389,900
$4,079,000
$785,448
$785,448
$827,395
$827,395
$761,817
$1,204,750
$884,286
$884,286
$585,000
$585,000
$645,500
$631,350
$892,667
$892,667
$730,600
$795,000
$654,000
$654,000
$988,863
$988,863
$898,110
$715,000
$715,000
$1,368,000
$1,065,000
$1,279,167
$1,279,167
$959,800
$981,300
$747,450
$747,450
$836,765
$836,765
$707,500
$871,667
$871,667
$749,333
$749,333
$860,000
$809,000
$663,500
$663,500
$694,950
$679,833
$752,000
$752,000
$777,500
$777,500
$725,000
$1,204,750
$900,000
$900,000
$585,000
$585,000
$650,000
$668,250
$900,500
$900,500
$713,000
$795,000
$641,500
$641,500
$949,000
$949,000
$860,000
$715,000
$715,000
$1,368,000
$1,065,000
$1,230,000
$1,230,000
$1,029,000
$895,000
$750,000
$750,000
$793,529
$793,529
$707,500
$865,000
$865,000
$760,000
$760,000
$860,000
$800,500
$700,000
$700,000
$694,950
$670,000
621
621
200
200
67
2
7
7
3
3
16
15
7
7
0
0
8
1
8
8
75
75
22
6
0
0
3
3
0
3
4
4
0
0
3
1
2
2
1
1
9
21
58
58
5
5
3
2
3
3
13
13
1
5
3
3
6
6
8
9
656
656
236
236
90
5
4
4
2
2
22
23
9
9
0
0
14
0
11
11
83
83
11
10
0
0
6
6
4
7
6
6
1
1
3
1
3
3
2
2
11
18
63
63
3
3
2
1
6
6
9
9
2
5
7
7
6
6
10
12
101%
101%
103%
103%
101%
101%
102%
102%
107%
107%
104%
100%
100%
100%
98%
98%
99%
99%
104%
104%
104%
119%
119%
106%
97%
104%
104%
100%
106%
103%
103%
100%
100%
101%
107%
107%
111%
111%
93%
105%
103%
103%
100%
103%
22
22
24
24
33
81
18
18
9
9
17
48
27
27
48
37
13
13
16
16
13
7
7
3
14
13
13
23
20
21
21
33
33
9
21
21
12
12
16
22
11
11
27
31
Toronto Regional Real Estate Board
SUMMARY OF EXISTING HOME TRANSACTIONS Condo Townhouse, February 2023
Market Watch, February 2023
Copyright 2023 Toronto Regional Real Estate Board
14
City of Toronto Municipal Breakdown
Sales Dollar Volume Average Price Median Price New Listings Active Listings Avg. SP/LP Avg. LDOM
Abc
Abc
Abc
Abc
Abc
Abc
Abc
Abc
Abc
Abc
Abc
Abc
Abc
Abc
Abc
Abc
Abc
Abc
Abc
Abc
Abc
Abc
Abc
Abc
Abc
Abc
Abc
Abc
Abc
Abc
Abc
Abc
Abc
Abc
Abc
Abc
Abc
Abc
Abc
Abc
Abc
All TRREB Areas
Halton Region
Halton Region
Burlington
Halton Hills
Milton
Milton
Oakville
Peel Region
Brampton
Brampton
Caledon
Mississauga
City of Toronto
City of Toronto
Toronto West
Toronto Central
Toronto East
Toronto East
York Region
Aurora
East Gwillimbury
East Gwillimbury
Georgina
King
Markham
Markham
Newmarket
Richmond Hill
Richmond Hill
Vaughan
Vaughan
Stouffville
Durham Region
Durham Region
Ajax
Ajax
Brock
Clarington
Clarington
Oshawa
Oshawa
Pickering
Scugog
Scugog
Uxbridge
Uxbridge
Whitby
Dufferin County
Dufferin County
Orangeville
Orangeville
Simcoe County
Adjala-Tosorontio
Adjala-Tosorontio
Bradford
Bradford
Essa
Innisfil
Innisfil
New Tecumseth
1,455
84
84
41
1
16
16
26
161
31
31
1
129
952
952
209
620
123
123
193
7
0
0
1
3
61
61
4
41
41
76
76
0
56
56
7
7
0
8
8
14
14
20
2
2
0
0
5
5
5
5
5
4
0
0
0
0
0
4
4
0
$1,026,461,979
$70,451,040
$70,451,040
$29,718,840
$605,000
$9,994,500
$9,994,500
$30,132,700
$96,311,154
$16,654,806
$16,654,806
$679,900
$78,976,448
$693,313,593
$693,313,593
$134,995,887
$488,223,442
$70,094,264
$70,094,264
$130,579,990
$4,334,000
$388,000
$2,515,000
$43,153,188
$43,153,188
$2,227,000
$26,920,002
$26,920,002
$51,042,800
$51,042,800
$30,105,202
$30,105,202
$3,976,614
$3,976,614
$4,086,000
$4,086,000
$5,798,500
$5,798,500
$11,745,700
$1,305,000
$1,305,000
$3,193,388
$2,829,000
$2,829,000
$2,829,000
$2,829,000
$2,872,000
$2,872,000
$2,872,000
$705,472
$838,703
$838,703
$724,850
$605,000
$624,656
$624,656
$1,158,950
$598,206
$537,252
$537,252
$679,900
$612,221
$728,271
$728,271
$645,913
$787,457
$569,872
$569,872
$676,580
$619,143
$388,000
$838,333
$707,429
$707,429
$556,750
$656,585
$656,585
$671,616
$671,616
$537,593
$537,593
$568,088
$568,088
$510,750
$510,750
$414,179
$414,179
$587,285
$652,500
$652,500
$638,678
$565,800
$565,800
$565,800
$565,800
$718,000
$718,000
$718,000
$630,000
$637,500
$637,500
$604,600
$605,000
$601,000
$601,000
$767,500
$580,000
$536,500
$536,500
$679,900
$587,500
$648,000
$648,000
$603,000
$683,500
$555,000
$555,000
$640,000
$600,000
$388,000
$920,000
$678,800
$678,800
$553,500
$630,000
$630,000
$634,450
$634,450
$547,500
$547,500
$520,000
$520,000
$510,550
$510,550
$430,000
$430,000
$580,000
$652,500
$652,500
$579,500
$529,000
$529,000
$529,000
$529,000
$670,000
$670,000
$670,000
2,797
158
158
63
2
19
19
74
303
59
59
2
242
1,912
1,912
418
1,285
209
209
307
8
0
0
2
4
86
86
9
58
58
131
131
9
99
99
6
6
0
27
27
32
32
16
0
0
2
2
16
7
7
7
7
11
0
0
3
3
0
6
6
2
3,864
269
269
125
3
23
23
118
394
73
73
2
319
2,640
2,640
533
1,806
301
301
395
9
0
0
3
4
92
92
14
81
81
174
174
18
128
128
5
5
0
32
32
51
51
24
0
0
2
2
14
7
7
7
7
31
0
0
2
2
0
20
20
9
98%
98%
98%
98%
96%
98%
98%
97%
98%
99%
99%
97%
98%
98%
98%
98%
98%
99%
99%
98%
95%
97%
95%
99%
99%
96%
99%
99%
98%
98%
99%
99%
102%
102%
100%
100%
100%
100%
98%
95%
95%
97%
99%
99%
99%
99%
96%
96%
96%
27
31
31
33
29
22
22
35
30
39
39
33
28
27
27
28
26
29
29
25
21
20
15
24
24
69
26
26
24
24
24
24
13
13
24
24
28
28
24
49
49
24
16
16
16
16
48
48
48
Toronto Regional Real Estate Board
SUMMARY OF EXISTING HOME TRANSACTIONS Condo Apartment, February 2023
Market Watch, February 2023
Copyright 2023 Toronto Regional Real Estate Board
15
ALL TRREB AREAS
Sales Dollar Volume Average Price Median Price New Listings Active Listings Avg. SP/LP Avg. LDOM
Abc
Abc
Abc
Abc
Abc
Abc
Abc
Abc
Abc
Abc
Abc
Abc
Abc
Abc
Abc
Abc
Abc
Abc
Abc
Abc
Abc
Abc
Abc
Abc
Abc
Abc
Abc
Abc
Abc
Abc
Abc
Abc
Abc
Abc
Abc
Abc
Abc
Abc
Abc
Abc
All TRREB Areas
All TRREB Areas
City of Toronto
City of Toronto
Toronto West
Toronto W01
Toronto W02
Toronto W02
Toronto W03
Toronto W03
Toronto W04
Toronto W05
Toronto W06
Toronto W06
Toronto W07
Toronto W07
Toronto W08
Toronto W09
Toronto W10
Toronto W10
Toronto Central
Toronto Central
Toronto C01
Toronto C02
Toronto C03
Toronto C03
Toronto C04
Toronto C04
Toronto C06
Toronto C07
Toronto C08
Toronto C08
Toronto C09
Toronto C09
Toronto C10
Toronto C11
Toronto C12
Toronto C12
Toronto C13
Toronto C13
Toronto C14
Toronto C15
Toronto East
Toronto East
Toronto E01
Toronto E01
Toronto E02
Toronto E03
Toronto E04
Toronto E04
Toronto E05
Toronto E05
Toronto E06
Toronto E07
Toronto E08
Toronto E08
Toronto E09
Toronto E09
Toronto E10
Toronto E11
1,455
1,455
952
952
209
22
10
10
6
6
22
20
60
60
3
3
40
9
17
17
620
620
218
38
12
12
8
8
10
33
124
124
8
8
34
9
7
7
20
20
49
50
123
123
11
11
4
11
11
11
15
15
2
23
14
14
15
15
3
14
$1,026,461,979
$1,026,461,979
$693,313,593
$693,313,593
$134,995,887
$16,810,500
$6,566,900
$6,566,900
$2,950,000
$2,950,000
$11,835,300
$10,366,000
$45,762,387
$45,762,387
$1,870,000
$1,870,000
$26,240,800
$3,915,500
$8,678,500
$8,678,500
$488,223,442
$488,223,442
$174,551,265
$45,462,706
$8,101,700
$8,101,700
$8,694,500
$8,694,500
$5,881,000
$22,662,300
$91,220,506
$91,220,506
$9,827,000
$9,827,000
$23,996,913
$5,519,000
$7,086,000
$7,086,000
$14,158,700
$14,158,700
$35,778,764
$35,283,088
$70,094,264
$70,094,264
$7,538,000
$7,538,000
$3,653,200
$5,242,789
$5,956,000
$5,956,000
$9,493,600
$9,493,600
$1,200,000
$12,792,387
$7,326,000
$7,326,000
$8,292,000
$8,292,000
$1,582,000
$7,018,288
$705,472
$705,472
$728,271
$728,271
$645,913
$764,114
$656,690
$656,690
$491,667
$491,667
$537,968
$518,300
$762,706
$762,706
$623,333
$623,333
$656,020
$435,056
$510,500
$510,500
$787,457
$787,457
$800,694
$1,196,387
$675,142
$675,142
$1,086,813
$1,086,813
$588,100
$686,736
$735,649
$735,649
$1,228,375
$1,228,375
$705,792
$613,222
$1,012,286
$1,012,286
$707,935
$707,935
$730,179
$705,662
$569,872
$569,872
$685,273
$685,273
$913,300
$476,617
$541,455
$541,455
$632,907
$632,907
$600,000
$556,191
$523,286
$523,286
$552,800
$552,800
$527,333
$501,306
$630,000
$630,000
$648,000
$648,000
$603,000
$692,500
$642,000
$642,000
$507,500
$507,500
$560,500
$535,000
$665,000
$665,000
$630,000
$630,000
$630,000
$438,000
$525,000
$525,000
$683,500
$683,500
$679,000
$940,000
$595,000
$595,000
$672,500
$672,500
$571,000
$677,000
$676,500
$676,500
$1,014,500
$1,014,500
$662,500
$601,000
$950,000
$950,000
$683,850
$683,850
$738,000
$642,000
$555,000
$555,000
$630,000
$630,000
$901,600
$465,000
$545,000
$545,000
$628,800
$628,800
$600,000
$550,000
$523,500
$523,500
$555,000
$555,000
$506,000
$492,450
2,797
2,797
1,912
1,912
418
46
24
24
10
10
33
44
108
108
9
9
101
19
24
24
1,285
1,285
460
78
29
29
15
15
29
63
281
281
16
16
65
31
10
10
38
38
82
88
209
209
17
17
12
11
38
38
28
28
10
33
22
22
24
24
5
9
3,864
3,864
2,640
2,640
533
51
31
31
7
7
47
61
130
130
9
9
134
30
33
33
1,806
1,806
671
131
28
28
38
38
32
73
392
392
17
17
103
34
8
8
46
46
106
127
301
301
24
24
31
15
45
45
36
36
17
39
35
35
39
39
9
11
98%
98%
98%
98%
98%
98%
98%
98%
97%
97%
97%
97%
98%
98%
100%
100%
99%
96%
100%
100%
98%
98%
98%
97%
97%
97%
96%
96%
99%
100%
99%
99%
97%
97%
98%
99%
98%
98%
101%
101%
99%
99%
99%
99%
99%
99%
105%
97%
102%
102%
99%
99%
98%
101%
97%
97%
98%
98%
98%
98%
27
27
27
27
28
24
33
33
30
30
30
30
20
20
8
8
32
44
32
32
26
26
29
25
14
14
22
22
17
24
27
27
20
20
25
25
23
23
14
14
30
27
29
29
17
17
15
38
23
23
21
21
12
30
30
30
30
30
84
37
Toronto Regional Real Estate Board
SUMMARY OF EXISTING HOME TRANSACTIONS Condo Apartment, February 2023
Market Watch, February 2023
Copyright 2023 Toronto Regional Real Estate Board
16
City of Toronto Municipal Breakdown
Sales Dollar Volume Average Price Median Price New Listings Active Listings Avg. SP/LP Avg. LDOM
Abc
Abc
Abc
Abc
Abc
Abc
Abc
Abc
Abc
Abc
Abc
Abc
Abc
Abc
Abc
Abc
Abc
Abc
Abc
Abc
Abc
Abc
Abc
Abc
Abc
Abc
Abc
Abc
Abc
Abc
Abc
Abc
Abc
Abc
Abc
Abc
Abc
Abc
Abc
Abc
Abc
All TRREB Areas
Halton Region
Halton Region
Burlington
Halton Hills
Milton
Milton
Oakville
Peel Region
Brampton
Brampton
Caledon
Mississauga
City of Toronto
City of Toronto
Toronto West
Toronto Central
Toronto East
Toronto East
York Region
Aurora
East Gwillimbury
East Gwillimbury
Georgina
King
Markham
Markham
Newmarket
Richmond Hill
Richmond Hill
Vaughan
Vaughan
Stouffville
Durham Region
Durham Region
Ajax
Ajax
Brock
Clarington
Clarington
Oshawa
Oshawa
Pickering
Scugog
Scugog
Uxbridge
Uxbridge
Whitby
Dufferin County
Dufferin County
Orangeville
Orangeville
Simcoe County
Adjala-Tosorontio
Adjala-Tosorontio
Bradford
Bradford
Essa
Innisfil
Innisfil
New Tecumseth
24
3
3
2
0
0
0
1
5
1
1
2
2
2
2
0
2
0
0
11
0
0
0
0
1
7
7
0
2
2
1
1
0
3
3
1
1
0
1
1
0
0
0
0
0
0
0
1
0
0
0
0
0
0
0
0
0
0
0
0
0
$26,854,772
$2,916,000
$2,916,000
$2,004,000
$912,000
$4,895,000
$780,000
$780,000
$1,690,000
$2,425,000
$2,245,000
$2,245,000
$2,245,000
$14,039,107
$1,435,000
$8,798,400
$8,798,400
$2,580,000
$2,580,000
$1,225,707
$1,225,707
$2,759,665
$2,759,665
$917,777
$917,777
$880,888
$880,888
$961,000
$1,118,949
$972,000
$972,000
$1,002,000
$912,000
$979,000
$780,000
$780,000
$845,000
$1,212,500
$1,122,500
$1,122,500
$1,122,500
$1,276,282
$1,435,000
$1,256,914
$1,256,914
$1,290,000
$1,290,000
$1,225,707
$1,225,707
$919,888
$919,888
$917,777
$917,777
$880,888
$880,888
$961,000
$1,125,000
$995,000
$995,000
$1,002,000
$912,000
$860,000
$780,000
$780,000
$845,000
$1,212,500
$1,122,500
$1,122,500
$1,122,500
$1,300,000
$1,435,000
$1,300,000
$1,300,000
$1,290,000
$1,290,000
$1,225,707
$1,225,707
$917,777
$917,777
$917,777
$917,777
$880,888
$880,888
$961,000
36
7
7
5
0
0
0
2
3
2
2
0
1
3
3
0
3
0
0
14
0
0
0
0
1
10
10
0
2
2
1
1
0
7
7
1
1
0
4
4
1
1
0
0
0
0
0
1
1
1
1
1
1
0
0
0
0
0
0
0
1
24
4
4
2
0
0
0
2
1
1
1
0
0
3
3
0
3
0
0
9
0
0
0
0
1
5
5
0
3
3
0
0
0
5
5
0
0
0
3
3
1
1
1
0
0
0
0
0
1
1
1
1
1
0
0
0
0
0
0
0
1
106%
103%
103%
102%
106%
105%
111%
111%
97%
110%
99%
99%
99%
106%
90%
111%
111%
97%
97%
123%
123%
110%
110%
108%
108%
110%
110%
113%
13
11
11
2
28
20
4
4
25
24
15
15
15
13
19
12
12
21
21
5
5
3
3
4
4
0
0
4
Toronto Regional Real Estate Board
SUMMARY OF EXISTING HOME TRANSACTIONS Link, February 2023
Market Watch, February 2023
Copyright 2023 Toronto Regional Real Estate Board
17
ALL TRREB AREAS
Sales Dollar Volume Average Price Median Price New Listings Active Listings Avg. SP/LP Avg. LDOM
Abc
Abc
Abc
Abc
Abc
Abc
Abc
Abc
Abc
Abc
Abc
Abc
Abc
Abc
Abc
Abc
Abc
Abc
Abc
Abc
Abc
Abc
Abc
Abc
Abc
Abc
Abc
Abc
Abc
Abc
Abc
Abc
Abc
Abc
Abc
Abc
Abc
Abc
Abc
Abc
All TRREB Areas
All TRREB Areas
City of Toronto
City of Toronto
Toronto West
Toronto W01
Toronto W02
Toronto W02
Toronto W03
Toronto W03
Toronto W04
Toronto W05
Toronto W06
Toronto W06
Toronto W07
Toronto W07
Toronto W08
Toronto W09
Toronto W10
Toronto W10
Toronto Central
Toronto Central
Toronto C01
Toronto C02
Toronto C03
Toronto C03
Toronto C04
Toronto C04
Toronto C06
Toronto C07
Toronto C08
Toronto C08
Toronto C09
Toronto C09
Toronto C10
Toronto C11
Toronto C12
Toronto C12
Toronto C13
Toronto C13
Toronto C14
Toronto C15
Toronto East
Toronto East
Toronto E01
Toronto E01
Toronto E02
Toronto E03
Toronto E04
Toronto E04
Toronto E05
Toronto E05
Toronto E06
Toronto E07
Toronto E08
Toronto E08
Toronto E09
Toronto E09
Toronto E10
Toronto E11
24
24
2
2
0
0
0
0
0
0
0
0
0
0
0
0
0
0
0
0
2
2
0
0
0
0
0
0
0
0
0
0
0
0
0
0
0
0
0
0
0
2
0
0
0
0
0
0
0
0
0
0
0
0
0
0
0
0
0
0
$26,854,772
$26,854,772
$2,245,000
$2,245,000
$2,245,000
$2,245,000
$2,245,000
$1,118,949
$1,118,949
$1,122,500
$1,122,500
$1,122,500
$1,122,500
$1,122,500
$1,125,000
$1,125,000
$1,122,500
$1,122,500
$1,122,500
$1,122,500
$1,122,500
36
36
3
3
0
0
0
0
0
0
0
0
0
0
0
0
0
0
0
0
3
3
0
0
0
0
0
0
0
0
0
0
0
0
0
0
0
0
0
0
0
3
0
0
0
0
0
0
0
0
0
0
0
0
0
0
0
0
0
0
24
24
3
3
0
0
0
0
0
0
0
0
0
0
0
0
0
0
0
0
3
3
0
0
0
0
0
0
0
1
0
0
0
0
0
0
0
0
0
0
0
2
0
0
0
0
0
0
0
0
0
0
0
0
0
0
0
0
0
0
106%
106%
99%
99%
99%
99%
99%
13
13
15
15
15
15
15
Toronto Regional Real Estate Board
SUMMARY OF EXISTING HOME TRANSACTIONS Link, February 2023
Market Watch, February 2023
Copyright 2023 Toronto Regional Real Estate Board
18
City of Toronto Municipal Breakdown
Sales Dollar Volume Average Price Median Price New Listings Active Listings Avg. SP/LP Avg. LDOM
Abc
Abc
Abc
Abc
Abc
Abc
Abc
Abc
Abc
Abc
Abc
Abc
Abc
Abc
Abc
Abc
Abc
Abc
Abc
Abc
Abc
Abc
Abc
Abc
Abc
Abc
Abc
Abc
Abc
Abc
Abc
Abc
Abc
Abc
Abc
Abc
Abc
Abc
Abc
Abc
Abc
All TRREB Areas
Halton Region
Halton Region
Burlington
Halton Hills
Milton
Milton
Oakville
Peel Region
Brampton
Brampton
Caledon
Mississauga
City of Toronto
City of Toronto
Toronto West
Toronto Central
Toronto East
Toronto East
York Region
Aurora
East Gwillimbury
East Gwillimbury
Georgina
King
Markham
Markham
Newmarket
Richmond Hill
Richmond Hill
Vaughan
Vaughan
Stouffville
Durham Region
Durham Region
Ajax
Ajax
Brock
Clarington
Clarington
Oshawa
Oshawa
Pickering
Scugog
Scugog
Uxbridge
Uxbridge
Whitby
Dufferin County
Dufferin County
Orangeville
Orangeville
Simcoe County
Adjala-Tosorontio
Adjala-Tosorontio
Bradford
Bradford
Essa
Innisfil
Innisfil
New Tecumseth
4
1
1
1
0
0
0
0
1
0
0
0
1
1
1
1
0
0
0
1
0
0
0
0
0
0
0
0
1
1
0
0
0
0
0
0
0
0
0
0
0
0
0
0
0
0
0
0
0
0
0
0
0
0
0
0
0
0
0
0
0
$1,905,888
$360,000
$360,000
$360,000
$370,000
$370,000
$382,000
$382,000
$382,000
$793,888
$793,888
$793,888
$476,472
$360,000
$360,000
$360,000
$370,000
$370,000
$382,000
$382,000
$382,000
$793,888
$793,888
$793,888
$376,000
$360,000
$360,000
$360,000
$370,000
$370,000
$382,000
$382,000
$382,000
$793,888
$793,888
$793,888
9
1
1
1
0
0
0
0
0
0
0
0
0
8
8
2
3
3
3
0
0
0
0
0
0
0
0
0
0
0
0
0
0
0
0
0
0
0
0
0
0
0
0
0
0
0
0
0
0
0
0
0
0
0
0
0
0
0
0
0
0
22
1
1
1
0
0
0
0
0
0
0
0
0
18
18
9
5
4
4
1
0
0
0
0
0
0
0
0
0
0
1
1
0
2
2
1
1
0
0
0
1
1
0
0
0
0
0
0
0
0
0
0
0
0
0
0
0
0
0
0
0
97%
92%
92%
92%
96%
96%
99%
99%
99%
98%
98%
98%
24
12
12
12
55
55
7
7
7
23
23
23
Toronto Regional Real Estate Board
SUMMARY OF EXISTING HOME TRANSACTIONS Co-Op Apartment, February 2023
Market Watch, February 2023
Copyright 2023 Toronto Regional Real Estate Board
19
ALL TRREB AREAS
Sales Dollar Volume Average Price Median Price New Listings Active Listings Avg. SP/LP Avg. LDOM
Abc
Abc
Abc
Abc
Abc
Abc
Abc
Abc
Abc
Abc
Abc
Abc
Abc
Abc
Abc
Abc
Abc
Abc
Abc
Abc
Abc
Abc
Abc
Abc
Abc
Abc
Abc
Abc
Abc
Abc
Abc
Abc
Abc
Abc
Abc
Abc
Abc
Abc
Abc
Abc
All TRREB Areas
All TRREB Areas
City of Toronto
City of Toronto
Toronto West
Toronto W01
Toronto W02
Toronto W02
Toronto W03
Toronto W03
Toronto W04
Toronto W05
Toronto W06
Toronto W06
Toronto W07
Toronto W07
Toronto W08
Toronto W09
Toronto W10
Toronto W10
Toronto Central
Toronto Central
Toronto C01
Toronto C02
Toronto C03
Toronto C03
Toronto C04
Toronto C04
Toronto C06
Toronto C07
Toronto C08
Toronto C08
Toronto C09
Toronto C09
Toronto C10
Toronto C11
Toronto C12
Toronto C12
Toronto C13
Toronto C13
Toronto C14
Toronto C15
Toronto East
Toronto East
Toronto E01
Toronto E01
Toronto E02
Toronto E03
Toronto E04
Toronto E04
Toronto E05
Toronto E05
Toronto E06
Toronto E07
Toronto E08
Toronto E08
Toronto E09
Toronto E09
Toronto E10
Toronto E11
4
4
1
1
1
0
1
1
0
0
0
0
0
0
0
0
0
0
0
0
0
0
0
0
0
0
0
0
0
0
0
0
0
0
0
0
0
0
0
0
0
0
0
0
0
0
0
0
0
0
0
0
0
0
0
0
0
0
0
0
$1,905,888
$1,905,888
$382,000
$382,000
$382,000
$382,000
$382,000
$476,472
$476,472
$382,000
$382,000
$382,000
$382,000
$382,000
$376,000
$376,000
$382,000
$382,000
$382,000
$382,000
$382,000
9
9
8
8
2
0
0
0
0
0
0
0
1
1
0
0
1
0
0
0
3
3
0
0
0
0
1
1
0
0
0
0
2
2
0
0
0
0
0
0
0
0
3
3
0
0
1
0
0
0
0
0
0
0
0
0
0
0
2
0
22
22
18
18
9
0
0
0
0
0
0
0
6
6
0
0
3
0
0
0
5
5
0
0
0
0
1
1
0
0
0
0
4
4
0
0
0
0
0
0
0
0
4
4
0
0
1
0
0
0
0
0
0
0
0
0
0
0
3
0
97%
97%
99%
99%
99%
99%
99%
24
24
7
7
7
7
7
Toronto Regional Real Estate Board
SUMMARY OF EXISTING HOME TRANSACTIONS Co-Op Apartment, February 2023
Market Watch, February 2023
Copyright 2023 Toronto Regional Real Estate Board
20
City of Toronto Municipal Breakdown
Sales Dollar Volume Average Price Median Price New Listings Active Listings Avg. SP/LP Avg. LDOM
Abc
Abc
Abc
Abc
Abc
Abc
Abc
Abc
Abc
Abc
Abc
Abc
Abc
Abc
Abc
Abc
Abc
Abc
Abc
Abc
Abc
Abc
Abc
Abc
Abc
Abc
Abc
Abc
Abc
Abc
Abc
Abc
Abc
Abc
Abc
Abc
Abc
Abc
Abc
Abc
Abc
All TRREB Areas
Halton Region
Halton Region
Burlington
Halton Hills
Milton
Milton
Oakville
Peel Region
Brampton
Brampton
Caledon
Mississauga
City of Toronto
City of Toronto
Toronto West
Toronto Central
Toronto East
Toronto East
York Region
Aurora
East Gwillimbury
East Gwillimbury
Georgina
King
Markham
Markham
Newmarket
Richmond Hill
Richmond Hill
Vaughan
Vaughan
Stouffville
Durham Region
Durham Region
Ajax
Ajax
Brock
Clarington
Clarington
Oshawa
Oshawa
Pickering
Scugog
Scugog
Uxbridge
Uxbridge
Whitby
Dufferin County
Dufferin County
Orangeville
Orangeville
Simcoe County
Adjala-Tosorontio
Adjala-Tosorontio
Bradford
Bradford
Essa
Innisfil
Innisfil
New Tecumseth
2
0
0
0
0
0
0
0
1
0
0
0
1
0
0
0
0
0
0
1
0
0
0
1
0
0
0
0
0
0
0
0
0
0
0
0
0
0
0
0
0
0
0
0
0
0
0
0
0
0
0
0
0
0
0
0
0
0
0
0
0
$2,089,000
$730,000
$730,000
$1,359,000
$1,359,000
$1,044,500
$730,000
$730,000
$1,359,000
$1,359,000
$1,044,500
$730,000
$730,000
$1,359,000
$1,359,000
9
1
1
1
0
0
0
0
3
1
1
0
2
0
0
0
0
0
0
0
0
0
0
0
0
0
0
0
0
0
0
0
0
1
1
1
1
0
0
0
0
0
0
0
0
0
0
0
0
0
0
0
4
0
0
0
0
0
0
0
4
15
1
1
1
0
0
0
0
3
2
2
0
1
0
0
0
0
0
0
0
0
0
0
0
0
0
0
0
0
0
0
0
0
1
1
1
1
0
0
0
0
0
0
0
0
0
0
0
0
0
0
0
10
0
0
0
0
0
0
0
10
106%
124%
124%
99%
99%
7
5
5
8
8
Toronto Regional Real Estate Board
SUMMARY OF EXISTING HOME TRANSACTIONS Detached Condo, February 2023
Market Watch, February 2023
Copyright 2023 Toronto Regional Real Estate Board
21
ALL TRREB AREAS
Sales Dollar Volume Average Price Median Price New Listings Active Listings Avg. SP/LP Avg. LDOM
Abc
Abc
Abc
Abc
Abc
Abc
Abc
Abc
Abc
Abc
Abc
Abc
Abc
Abc
Abc
Abc
Abc
Abc
Abc
Abc
Abc
Abc
Abc
Abc
Abc
Abc
Abc
Abc
Abc
Abc
Abc
Abc
Abc
Abc
Abc
Abc
Abc
Abc
Abc
Abc
All TRREB Areas
All TRREB Areas
City of Toronto
City of Toronto
Toronto West
Toronto W01
Toronto W02
Toronto W02
Toronto W03
Toronto W03
Toronto W04
Toronto W05
Toronto W06
Toronto W06
Toronto W07
Toronto W07
Toronto W08
Toronto W09
Toronto W10
Toronto W10
Toronto Central
Toronto Central
Toronto C01
Toronto C02
Toronto C03
Toronto C03
Toronto C04
Toronto C04
Toronto C06
Toronto C07
Toronto C08
Toronto C08
Toronto C09
Toronto C09
Toronto C10
Toronto C11
Toronto C12
Toronto C12
Toronto C13
Toronto C13
Toronto C14
Toronto C15
Toronto East
Toronto East
Toronto E01
Toronto E01
Toronto E02
Toronto E03
Toronto E04
Toronto E04
Toronto E05
Toronto E05
Toronto E06
Toronto E07
Toronto E08
Toronto E08
Toronto E09
Toronto E09
Toronto E10
Toronto E11
2
2
0
0
0
0
0
0
0
0
0
0
0
0
0
0
0
0
0
0
0
0
0
0
0
0
0
0
0
0
0
0
0
0
0
0
0
0
0
0
0
0
0
0
0
0
0
0
0
0
0
0
0
0
0
0
0
0
0
0
$2,089,000
$2,089,000
$1,044,500
$1,044,500
$1,044,500
$1,044,500
9
9
0
0
0
0
0
0
0
0
0
0
0
0
0
0
0
0
0
0
0
0
0
0
0
0
0
0
0
0
0
0
0
0
0
0
0
0
0
0
0
0
0
0
0
0
0
0
0
0
0
0
0
0
0
0
0
0
0
0
15
15
0
0
0
0
0
0
0
0
0
0
0
0
0
0
0
0
0
0
0
0
0
0
0
0
0
0
0
0
0
0
0
0
0
0
0
0
0
0
0
0
0
0
0
0
0
0
0
0
0
0
0
0
0
0
0
0
0
0
106%
106%
7
7
Toronto Regional Real Estate Board
SUMMARY OF EXISTING HOME TRANSACTIONS Detached Condo, February 2023
Market Watch, February 2023
Copyright 2023 Toronto Regional Real Estate Board
22
City of Toronto Municipal Breakdown
Sales Dollar Volume Average Price Median Price New Listings Active Listings Avg. SP/LP Avg. LDOM
Abc
Abc
Abc
Abc
Abc
Abc
Abc
Abc
Abc
Abc
Abc
Abc
Abc
Abc
Abc
Abc
Abc
Abc
Abc
Abc
Abc
Abc
Abc
Abc
Abc
Abc
Abc
Abc
Abc
Abc
Abc
Abc
Abc
Abc
Abc
Abc
Abc
Abc
Abc
Abc
Abc
All TRREB Areas
Halton Region
Halton Region
Burlington
Halton Hills
Milton
Milton
Oakville
Peel Region
Brampton
Brampton
Caledon
Mississauga
City of Toronto
City of Toronto
Toronto West
Toronto Central
Toronto East
Toronto East
York Region
Aurora
East Gwillimbury
East Gwillimbury
Georgina
King
Markham
Markham
Newmarket
Richmond Hill
Richmond Hill
Vaughan
Vaughan
Stouffville
Durham Region
Durham Region
Ajax
Ajax
Brock
Clarington
Clarington
Oshawa
Oshawa
Pickering
Scugog
Scugog
Uxbridge
Uxbridge
Whitby
Dufferin County
Dufferin County
Orangeville
Orangeville
Simcoe County
Adjala-Tosorontio
Adjala-Tosorontio
Bradford
Bradford
Essa
Innisfil
Innisfil
New Tecumseth
3
0
0
0
0
0
0
0
0
0
0
0
0
3
3
0
3
0
0
0
0
0
0
0
0
0
0
0
0
0
0
0
0
0
0
0
0
0
0
0
0
0
0
0
0
0
0
0
0
0
0
0
0
0
0
0
0
0
0
0
0
$1,435,513
$1,435,513
$1,435,513
$1,435,513
$478,504
$478,504
$478,504
$478,504
$450,000
$450,000
$450,000
$450,000
8
0
0
0
0
0
0
0
0
0
0
0
0
8
8
1
7
0
0
0
0
0
0
0
0
0
0
0
0
0
0
0
0
0
0
0
0
0
0
0
0
0
0
0
0
0
0
0
0
0
0
0
0
0
0
0
0
0
0
0
0
10
0
0
0
0
0
0
0
0
0
0
0
0
10
10
2
8
0
0
0
0
0
0
0
0
0
0
0
0
0
0
0
0
0
0
0
0
0
0
0
0
0
0
0
0
0
0
0
0
0
0
0
0
0
0
0
0
0
0
0
0
96%
96%
96%
96%
15
15
15
15
Toronto Regional Real Estate Board
SUMMARY OF EXISTING HOME TRANSACTIONS Co-Ownership Apartment, February 2023
Market Watch, February 2023
Copyright 2023 Toronto Regional Real Estate Board
23
ALL TRREB AREAS
Sales Dollar Volume Average Price Median Price New Listings Active Listings Avg. SP/LP Avg. LDOM
Abc
Abc
Abc
Abc
Abc
Abc
Abc
Abc
Abc
Abc
Abc
Abc
Abc
Abc
Abc
Abc
Abc
Abc
Abc
Abc
Abc
Abc
Abc
Abc
Abc
Abc
Abc
Abc
Abc
Abc
Abc
Abc
Abc
Abc
Abc
Abc
Abc
Abc
Abc
Abc
All TRREB Areas
All TRREB Areas
City of Toronto
City of Toronto
Toronto West
Toronto W01
Toronto W02
Toronto W02
Toronto W03
Toronto W03
Toronto W04
Toronto W05
Toronto W06
Toronto W06
Toronto W07
Toronto W07
Toronto W08
Toronto W09
Toronto W10
Toronto W10
Toronto Central
Toronto Central
Toronto C01
Toronto C02
Toronto C03
Toronto C03
Toronto C04
Toronto C04
Toronto C06
Toronto C07
Toronto C08
Toronto C08
Toronto C09
Toronto C09
Toronto C10
Toronto C11
Toronto C12
Toronto C12
Toronto C13
Toronto C13
Toronto C14
Toronto C15
Toronto East
Toronto East
Toronto E01
Toronto E01
Toronto E02
Toronto E03
Toronto E04
Toronto E04
Toronto E05
Toronto E05
Toronto E06
Toronto E07
Toronto E08
Toronto E08
Toronto E09
Toronto E09
Toronto E10
Toronto E11
3
3
3
3
0
0
0
0
0
0
0
0
0
0
0
0
0
0
0
0
3
3
0
1
1
1
0
0
0
0
0
0
0
0
0
0
0
0
1
1
0
0
0
0
0
0
0
0
0
0
0
0
0
0
0
0
0
0
0
0
$1,435,513
$1,435,513
$1,435,513
$1,435,513
$1,435,513
$1,435,513
$540,000
$450,000
$450,000
$445,513
$445,513
$478,504
$478,504
$478,504
$478,504
$478,504
$478,504
$540,000
$450,000
$450,000
$445,513
$445,513
$450,000
$450,000
$450,000
$450,000
$450,000
$450,000
$540,000
$450,000
$450,000
$445,513
$445,513
8
8
8
8
1
0
0
0
0
0
0
1
0
0
0
0
0
0
0
0
7
7
1
0
0
0
1
1
0
0
0
0
0
0
0
0
0
0
1
1
4
0
0
0
0
0
0
0
0
0
0
0
0
0
0
0
0
0
0
0
10
10
10
10
2
0
0
0
0
0
0
2
0
0
0
0
0
0
0
0
8
8
1
0
0
0
2
2
0
0
0
0
0
0
0
0
0
0
0
0
5
0
0
0
0
0
0
0
0
0
0
0
0
0
0
0
0
0
0
0
96%
96%
96%
96%
96%
96%
98%
98%
98%
93%
93%
15
15
15
15
15
15
14
12
12
18
18
Toronto Regional Real Estate Board
SUMMARY OF EXISTING HOME TRANSACTIONS Co-Ownership Apartment, February 2023
Market Watch, February 2023
Copyright 2023 Toronto Regional Real Estate Board
24
City of Toronto Municipal Breakdown
Index Benchmark Yr./Yr. % Chg. Index Benchmark Yr./Yr. % Chg. Index Benchmark Yr./Yr. % Chg. Index Benchmark Yr./Yr. % Chg. Index Benchmark Yr./Yr. % Chg.
344.9 $1,091,300 -17.70% 354.1 $1,385,000 -19.60% 372.2 $1,055,900 -18.68% 372.1 $796,400 -15.47% 349.2 $695,000 -10.76%
359.6 $1,149,600 -22.00% 379.8 $1,464,800 -22.33% 400.6 $1,013,000 -22.80% 378.7 $778,700 -21.95% 359.7 $613,700 -13.84%
352.4 $989,500 -22.52% 387.2 $1,282,000 -23.76% 393.7 $940,600 -23.86% 384.3 $739,400 -22.38% 388.5 $583,200 -13.59%
383.3 $1,136,800 -23.72% 365.7 $1,210,500 -23.84% 394.2 $886,900 -24.80% 430.4 $672,700 -21.00% 346.3 $644,900 -15.82%
321.7 $1,059,200 -24.09% 321.6 $1,371,200 -24.20% 395.7 $955,600 -24.40% 399.8 $754,400 -22.40% 330.7 $622,300 -14.83%
373.2 $1,372,000 -20.15% 393.0 $1,774,200 -20.07% 419.1 $1,160,900 -19.79% 352.5 $853,300 -21.75% 357.6 $655,400 -13.58%
398.2 $1,034,400 -20.74% 358.5 $1,312,400 -22.42% 361.5 $964,600 -22.42% 371.5 $785,800 -14.83% 360.9 $618,200 -12.78%
369.1 $1,013,800 -22.73% 366.0 $1,198,700 -23.33% 382.6 $938,200 -23.40% 378.1 $708,200 -17.10% 384.4 $565,500 -16.63%
360.1 $1,301,000 -25.03% 358.2 $1,390,000 -25.20% 377.9 $941,700 -25.20% 396.1 $928,800 -19.41%
409.3 $1,024,800 -18.35% 356.0 $1,446,100 -21.03% 353.8 $1,012,800 -20.46% 385.3 $818,700 -13.75% 355.1 $628,200 -12.13%
295.7 $1,077,500 -13.89% 368.5 $1,645,900 -17.00% 369.0 $1,250,800 -16.14% 364.4 $861,100 -9.42% 351.1 $728,500 -9.37%
360.1 $1,323,200 -14.24% 365.6 $1,610,300 -15.08% 383.6 $1,157,000 -13.23% 347.4 $888,000 -14.85% 317.5 $668,600 -13.82%
407.8 $1,350,600 -16.11% 382.4 $1,604,700 -17.01% 411.4 $1,069,100 -18.13% 329.7 $907,000 -14.14% 327.9 $626,000 -12.26%
346.0 $1,286,900 -21.86% 343.2 $1,340,900 -22.21% 359.2 $844,900 -20.72%
388.7 $802,600 -21.08% 394.1 $809,900 -20.96% 391.7 $693,300 -18.70%
380.4 $1,816,700 -14.19% 381.8 $2,019,900 -14.39% 328.1 $947,500 -13.13% 310.1 $725,700 -11.50%
376.4 $1,352,200 -13.01% 407.6 $1,808,300 -13.41% 410.7 $1,264,400 -12.62% 349.4 $900,000 -16.73% 310.6 $685,200 -14.44%
365.4 $1,200,300 -16.61% 355.5 $1,323,600 -17.19% 356.3 $982,700 -16.89% 392.9 $819,900 -14.21% 316.7 $567,800 -12.22%
361.3 $1,426,100 -12.37% 374.0 $1,876,500 -13.27% 368.5 $1,210,900 -12.07% 333.9 $904,000 -9.17% 323.2 $629,500 -14.68%
329.0 $1,322,100 -13.08% 356.7 $1,713,600 -13.46% 369.1 $1,175,100 -11.32% 337.0 $888,300 -15.24% 308.0 $689,300 -13.24%
349.4 $1,396,900 -16.55% 336.1 $1,551,900 -17.09% 410.3 $1,058,200 -13.68% 440.1 $858,100 -16.54% 324.1 $641,300 -12.85%
384.4 $924,400 -23.23% 375.3 $1,004,000 -23.55% 405.0 $801,400 -23.60% 415.5 $644,000 -20.58% 341.5 $572,400 -18.36%
383.8 $991,100 -24.39% 378.2 $1,093,500 -24.50% 380.5 $881,600 -24.65% 384.0 $680,500 -20.73% 336.4 $556,100 -18.67%
337.7 $658,600 -18.55% 339.6 $658,200 -18.58% -100.00%
375.3 $853,700 -22.71% 381.5 $938,900 -22.76% 406.8 $728,200 -23.04% 425.2 $647,600 -24.34% 303.2 $550,900 -17.29%
423.0 $822,300 -23.70% 402.4 $877,300 -24.20% 435.6 $699,100 -23.11% 451.9 $603,700 -22.45% 403.6 $504,500 -16.83%
356.3 $992,700 -24.48% 356.5 $1,178,100 -24.85% 366.9 $861,900 -25.24% 387.8 $672,400 -20.30% 328.2 $615,100 -18.80%
334.2 $910,800 -19.95% 332.7 $921,300 -20.23% 335.5 $645,800 -21.19%
357.7 $1,176,500 -19.22% 337.6 $1,219,000 -19.68% 323.1 $841,600 -19.91% 438.2 $688,900 -20.80% 298.5 $720,100 -17.88%
393.8 $1,036,900 -21.94% 386.4 $1,131,100 -22.77% 408.9 $868,600 -21.61% 413.4 $657,700 -12.73% 349.9 $599,300 -18.42%
362.7 $761,000 -21.43% 357.8 $866,200 -21.60% 377.9 $677,500 -19.89% 423.8 $592,900 -16.87% 378.8 $510,600 -15.41%
362.7 $761,000 -21.43% 357.8 $866,200 -21.60% 377.9 $677,500 -19.89% 423.8 $592,900 -16.87% 378.8 $510,600 -15.41%
317.4 $859,900 -20.79% 320.8 $907,600 -20.93% 334.9 $731,700 -18.67% 417.3 $622,600 -21.41% 368.0 $595,000 -12.11%
397.7 $1,117,500 -19.49% 398.1 $1,118,800 -19.46%
384.2 $1,070,400 -16.93% 385.5 $1,130,700 -17.31% 391.5 $877,400 -15.20% 391.3 $628,500 -20.92% 334.1 $568,700 -11.94%
355.2 $748,700 -22.97% 349.1 $797,400 -23.02% 408.4 $650,600 -21.84% 458.1 $616,600 -20.09%
413.1 $793,100 -22.04% 418.4 $803,800 -21.87% 406.4 $655,500 -20.14% 328.4 $302,500 -17.34% 324.0 $622,400 -13.02%
358.8 $821,200 -21.88% 356.7 $920,600 -22.56% 374.5 $672,200 -22.03% 384.9 $697,100 -21.16% 391.9 $583,100 -11.87%
Toronto Regional Real Estate Board
FOCUS ON THE MLS HOME PRICE INDEX Index and Benchmark Price, February 2023
Market Watch, February 2023
Copyright 2023 Toronto Regional Real Estate Board
25
ALL TRREB AREAS
Single Family Detached Single Family Attached
Composite Townhouse Apartment
®
All TRREB Areas
Halton Region
Burlington
Halton Hills
Milton
Oakville
Peel Region
Brampton
Caledon
Mississauga
City of Toronto
York Region
Aurora
East Gwillimbury
Georgina
King
Markham
Newmarket
Richmond Hill
Vaughan
Stouffville
Durham Region
Ajax
Brock
Clarington
Oshawa
Pickering
Scugog
Uxbridge
Whitby
Dufferin County
Orangeville
Simcoe County
Adjala-Tosorontio
Bradford
Essa
Innisfil
New Tecumseth
Index Benchmark Yr./Yr. % Chg. Index Benchmark Yr./Yr. % Chg. Index Benchmark Yr./Yr. % Chg. Index Benchmark Yr./Yr. % Chg. Index Benchmark Yr./Yr. % Chg.
344.9 $1,091,300 -17.70% 354.1 $1,385,000 -19.60% 372.2 $1,055,900 -18.68% 372.1 $796,400 -15.47% 349.2 $695,000 -10.76%
295.7 $1,077,500 -13.89% 368.5 $1,645,900 -17.00% 369.0 $1,250,800 -16.14% 364.4 $861,100 -9.42% 351.1 $728,500 -9.37%
251.6 $1,073,700 -17.48% 314.0 $1,773,700 -25.18% 314.7 $1,295,800 -24.17% 302.2 $896,400 -6.27% 321.3 $683,000 -6.92%
353.6 $1,227,900 -19.51% 374.2 $1,669,100 -22.19% 408.2 $1,259,600 -20.46% 361.3 $1,040,300 -10.77% 355.3 $727,000 -11.88%
389.5 $955,100 -19.41% 378.5 $1,014,800 -21.13% 395.2 $1,001,800 -19.23% 365.5 $870,300 -7.42% 366.1 $577,700 -12.27%
346.2 $877,600 -16.54% 339.1 $1,155,200 -19.24% 329.4 $895,300 -18.93% 308.3 $718,300 -6.15% 447.6 $568,000 -12.71%
378.2 $846,900 -13.63% 328.5 $1,202,500 -17.88% 322.4 $966,000 -16.69% 359.4 $676,400 0.90% 523.8 $585,100 -8.71%
336.9 $960,700 -10.21% 393.6 $1,311,800 -15.52% 386.3 $1,213,500 -11.03% 379.8 $1,040,900 -5.78% 309.1 $760,900 -7.51%
309.7 $1,529,400 -15.29% 331.4 $1,759,100 -15.33% 327.9 $1,335,900 -12.49% 415.5 $1,128,900 -6.75% 129.9 $759,200 -11.33%
251.2 $1,083,600 -14.47% 305.0 $1,815,000 -17.28% 326.5 $1,310,700 -15.17% 325.3 $732,500 -5.41% 287.7 $601,100 -10.23%
333.4 $954,100 -17.27% 318.1 $1,325,400 -20.22% 346.1 $926,200 -15.61% 295.1 $859,100 -3.40% 367.9 $460,600 -14.76%
355.6 $753,200 -17.63% 327.1 $990,900 -21.10% 336.9 $907,300 -16.65% 411.0 $700,800 -9.53% 446.8 $530,300 -12.56%
328.3 $865,200 -12.36% 391.6 $1,659,400 -20.76% 364.8 $1,432,100 -20.57% 360.4 $895,200 -7.73% 352.7 $794,300 -10.84%
323.0 $1,448,500 -13.15% 330.4 $2,716,900 -14.74% 350.3 $2,048,700 -11.45% 275.1 $1,397,500 -17.11% 289.3 $928,800 -13.10%
277.1 $1,555,300 -19.12% 295.3 $1,989,100 -18.27% 413.2 $1,264,800 -20.60% 278.6 $822,800 -16.84%
293.7 $2,108,800 -17.03% 317.3 $2,630,700 -17.05% 357.2 $1,623,300 -15.58% 285.1 $734,900 -14.38%
279.6 $1,122,500 -13.65% 404.9 $1,633,900 -15.96% 309.7 $1,142,800 -13.54% 311.9 $825,900 -9.44% 393.6 $681,400 -5.36%
297.1 $1,237,400 -8.47% 487.3 $2,069,700 -11.38% 351.4 $1,264,500 -6.14% 291.4 $805,500 -8.97% 329.9 $791,100 -6.91%
309.2 $826,400 -9.22% 332.4 $2,082,200 -17.38% 354.3 $1,514,600 -15.96% 378.9 $1,205,900 -2.07% 340.1 $768,700 -8.03%
274.3 $2,237,600 -15.55% 255.7 $3,892,800 -17.17% 274.1 $2,597,100 -18.18% 289.8 $1,902,900 -11.02% 312.1 $1,158,500 -9.30%
289.6 $1,117,700 -10.59% 338.6 $2,215,700 -12.05% 327.8 $1,601,700 -11.43% 257.3 $1,062,300 -13.28% 307.5 $781,700 -7.85%
338.8 $1,260,500 -16.30% 302.0 $2,466,800 -20.53% 315.9 $1,508,400 -19.02% 462.3 $764,200 0.96% 367.1 $540,800 -6.38%
328.0 $2,869,700 -15.92% 312.8 $3,728,800 -18.63% 296.5 $1,573,400 -14.90% 353.2 $1,473,000 -4.87% 369.3 $1,281,200 -14.85%
288.9 $1,218,200 -14.12% 326.5 $1,958,500 -17.13% 321.6 $1,013,700 -15.79% 413.1 $955,400 -5.90% 290.0 $704,000 -9.80%
366.9 $1,163,700 -7.95% 384.1 $2,589,200 -6.66% 346.7 $1,737,800 -0.94% 361.4 $805,300 -15.52% 350.7 $799,200 -11.24%
298.8 $972,400 -10.49% 393.9 $1,950,400 -16.49% 312.9 $1,134,500 -12.65% 360.2 $803,600 -17.16% 343.6 $666,300 -2.72%
413.6 $1,218,400 -11.51% 436.4 $1,514,300 -13.40% 433.3 $1,325,600 -12.06% 549.1 $1,045,500 -1.81% 378.3 $827,300 -9.54%
401.1 $1,361,500 -13.29% 408.3 $1,746,100 -14.01% 397.8 $1,299,600 -14.73% 443.2 $1,155,300 -3.04% 338.3 $847,100 -11.11%
364.7 $1,170,200 -16.08% 340.3 $1,330,400 -16.43% 371.4 $1,242,300 -16.93% 381.8 $586,000 -9.03%
415.1 $883,700 -18.54% 398.6 $1,130,500 -20.25% 364.7 $920,900 -21.89% 360.4 $787,200 -18.02% 407.8 $514,600 -12.28%
339.6 $973,400 -15.75% 383.8 $1,405,400 -17.83% 376.8 $1,064,000 -16.42% 342.5 $762,300 -18.63% 350.1 $623,200 -5.99%
386.0 $1,145,000 -16.50% 404.3 $1,267,000 -17.39% 377.7 $967,400 -19.93% 367.7 $764,000 -17.28% 369.4 $697,500 -11.05%
364.9 $945,700 -14.92% 375.5 $1,310,600 -18.92% 377.7 $1,022,500 -18.81% 372.9 $792,800 -18.74% 391.4 $649,300 -7.60%
357.7 $968,700 -16.78% 358.0 $1,273,500 -17.51% 328.8 $918,100 -19.15% 360.3 $686,000 -17.00% 371.7 $551,600 -15.48%
429.5 $856,500 -14.88% 401.2 $1,098,400 -19.01% 360.1 $892,000 -20.40% 396.0 $689,500 -8.57% 436.7 $593,000 -7.85%
365.5 $1,078,300 -16.15% 373.4 $1,304,700 -18.44% 358.2 $979,200 -19.03% 406.1 $688,400 -4.38% 291.4 $519,000 -11.21%
370.3 $812,100 -15.99% 355.5 $1,074,000 -19.24% 391.5 $888,800 -19.68% 432.4 $766,600 -12.20% 455.2 $514,800 -1.62%
Toronto Regional Real Estate Board
FOCUS ON THE MLS HOME PRICE INDEX Index and Benchmark Price, February 2023
Market Watch, February 2023
Copyright 2023 Toronto Regional Real Estate Board
26
CITY OF TORONTO
Single Family Detached Single Family Attached
Composite Townhouse Apartment
®
All TRREB Areas
City of Toronto
Toronto W01
Toronto W02
Toronto W03
Toronto W04
Toronto W05
Toronto W06
Toronto W07
Toronto W08
Toronto W09
Toronto W10
Toronto C01
Toronto C02
Toronto C03
Toronto C04
Toronto C06
Toronto C07
Toronto C08
Toronto C09
Toronto C10
Toronto C11
Toronto C12
Toronto C13
Toronto C14
Toronto C15
Toronto E01
Toronto E02
Toronto E03
Toronto E04
Toronto E05
Toronto E06
Toronto E07
Toronto E08
Toronto E09
Toronto E10
Toronto E11
Bradford West Gwillimbury
Whitchurch-Stouûville
Adjala-Tosorontio
East Gwillimbury
Richmond Hill
Toronto W06
Toronto W09
Toronto W05
Toronto E09
Toronto E06
Toronto E07
Halton Hills
Orangeville
Burlington
Clarington
Brampton
Markham
Georgina
Pickering
Vaughan
Oshawa
Caledon
Oakville
Scugog
Innisûl
Milton
Brock
Essa
King
Toronto Regional Real Estate Board
Historic Annual Statistics
Market Watch, February 2023
Copyright 2023 Toronto Regional Real Estate Board
27
Monthly Statistics 2023
Monthly Statistics 2022
Year Sales Average Price
2010
2011
2012
2013
2014
2015
2016
2017
2018
2019
2020
2021 $1,095,475
$929,636
$819,153
$787,842
$822,510
$729,824
$622,116
$566,611
$522,951
$497,073
$464,989
$431,262
121,712
95,066
87,747
78,017
92,340
113,040
101,213
92,776
87,047
85,488
89,110
85,860
January
February
March
April
May
June
July
August
September
October
November
December
Annual $1,189,917
$1,050,942
$1,079,616
$1,090,429
$1,086,560
$1,078,873
$1,073,316
$1,145,804
$1,210,509
$1,250,739
$1,298,666
$1,334,062
$1,242,407
75,082
3,103
4,511
4,934
5,001
5,587
4,870
6,423
7,227
7,941
10,863
9,028
5,594
January
February
March
April
May
June
July
August
September
October
November
December
Year to Date $1,073,138
$1,095,617
$1,038,390
7,877
4,783
3,094 Notes
1. Sales, dollar volume, average sale prices and median sale prices are based on firm transactions entered into the TRREB MLS® System between the first and last day of
the month/period being reported.
2. New listings entered into the TRREB MLS® System between the first and last day of the month/period being reported.
3. Active listings at the end of the last day of the month/period being reported.
4. Ratio of the average selling price to the average listing price for firm transactions entered into the TRREB MLS® System between the first and last day of the month/period
being reported.
5. Average Listing Days on Market (Avg. LDOM) refers to the average number of days sold listings were on the market. Average Property Days on Market (Avg. PDOM) refers
to the average number of days a property was on the market before selling, irrespective of whether the property was listed more than once by the same combination of seller
and brokerage during the original listing contract period.
6. Active Listings at the end of the last day of the month/period being reported.
7. Past monthly and year-to-date figures are revised on a monthly basis.
8. SNLR = Sales-to-New-Listings Ratio. Calculated using a 12 month moving average (sales/new listings).
9. Mos. Inv. = Months of Inventory. Calculated using a 12 month moving average (active listings/sales).
10. "Bradford West Gwillimbury" is referred to as "Bradford" and "Whitchurch-Stouffville" is referred to as "Stouffville" in the report.
Dufferin
Durham
Halton
Peel
Simcoe
Toronto
York
For historical annual sales and average price data over a longer time frame, go to:
https://trreb.ca/files/market-stats/market-watch/historic.pdf

Weitere ähnliche Inhalte

Ähnlich wie February 2022 Market Watch

April 2017 Real Estate Board of Greater Vancouver Statistics Package with Charts
April 2017 Real Estate Board of Greater Vancouver Statistics Package with ChartsApril 2017 Real Estate Board of Greater Vancouver Statistics Package with Charts
April 2017 Real Estate Board of Greater Vancouver Statistics Package with Charts
Mike Stewart
 
April 2017 Real Estate Board of Greater Vancouver Statistics Package with Charts
April 2017 Real Estate Board of Greater Vancouver Statistics Package with ChartsApril 2017 Real Estate Board of Greater Vancouver Statistics Package with Charts
April 2017 Real Estate Board of Greater Vancouver Statistics Package with Charts
Mike Stewart
 

Ähnlich wie February 2022 Market Watch (20)

TORONTO REGIONAL REAL ESTATE BOARD'S - MARKET WATCH - FOR AUGUEST 2021
TORONTO REGIONAL REAL ESTATE BOARD'S - MARKET WATCH - FOR AUGUEST 2021TORONTO REGIONAL REAL ESTATE BOARD'S - MARKET WATCH - FOR AUGUEST 2021
TORONTO REGIONAL REAL ESTATE BOARD'S - MARKET WATCH - FOR AUGUEST 2021
 
TORONTO REGIONAL REAL ESTATE BOARD'S - MARKET WATCH - FOR AUGUEST 2021
TORONTO REGIONAL REAL ESTATE BOARD'S - MARKET WATCH - FOR AUGUEST 2021TORONTO REGIONAL REAL ESTATE BOARD'S - MARKET WATCH - FOR AUGUEST 2021
TORONTO REGIONAL REAL ESTATE BOARD'S - MARKET WATCH - FOR AUGUEST 2021
 
TORONTO REAL ESTATE SALES - APRIL 2018 (TREB)
TORONTO REAL ESTATE SALES - APRIL 2018 (TREB)TORONTO REAL ESTATE SALES - APRIL 2018 (TREB)
TORONTO REAL ESTATE SALES - APRIL 2018 (TREB)
 
TORONTO REAL ESTATE SALES - APRIL 2018 (TREB)
TORONTO REAL ESTATE SALES - APRIL 2018 (TREB)TORONTO REAL ESTATE SALES - APRIL 2018 (TREB)
TORONTO REAL ESTATE SALES - APRIL 2018 (TREB)
 
San Francisco Market Report March 2023.pdf
San Francisco Market Report March 2023.pdfSan Francisco Market Report March 2023.pdf
San Francisco Market Report March 2023.pdf
 
San Francisco Market Report March 2023.pdf
San Francisco Market Report March 2023.pdfSan Francisco Market Report March 2023.pdf
San Francisco Market Report March 2023.pdf
 
TORONTO REGIONAL REAL ESTATE BOARD's JUNE 2020 MARKET WATCH REPORT
TORONTO REGIONAL REAL ESTATE BOARD's JUNE 2020 MARKET WATCH REPORTTORONTO REGIONAL REAL ESTATE BOARD's JUNE 2020 MARKET WATCH REPORT
TORONTO REGIONAL REAL ESTATE BOARD's JUNE 2020 MARKET WATCH REPORT
 
TORONTO REGIONAL REAL ESTATE BOARD's JUNE 2020 MARKET WATCH REPORT
TORONTO REGIONAL REAL ESTATE BOARD's JUNE 2020 MARKET WATCH REPORTTORONTO REGIONAL REAL ESTATE BOARD's JUNE 2020 MARKET WATCH REPORT
TORONTO REGIONAL REAL ESTATE BOARD's JUNE 2020 MARKET WATCH REPORT
 
April 2017 Real Estate Board of Greater Vancouver Statistics Package with Charts
April 2017 Real Estate Board of Greater Vancouver Statistics Package with ChartsApril 2017 Real Estate Board of Greater Vancouver Statistics Package with Charts
April 2017 Real Estate Board of Greater Vancouver Statistics Package with Charts
 
April 2017 Real Estate Board of Greater Vancouver Statistics Package with Charts
April 2017 Real Estate Board of Greater Vancouver Statistics Package with ChartsApril 2017 Real Estate Board of Greater Vancouver Statistics Package with Charts
April 2017 Real Estate Board of Greater Vancouver Statistics Package with Charts
 
San Francisco November 2023 Market Report
San Francisco November 2023 Market ReportSan Francisco November 2023 Market Report
San Francisco November 2023 Market Report
 
San Francisco November 2023 Market Report
San Francisco November 2023 Market ReportSan Francisco November 2023 Market Report
San Francisco November 2023 Market Report
 
TORONTO REAL ESTATE BOARD'S JUNE 2017 MARKET STATS
TORONTO REAL ESTATE BOARD'S JUNE 2017 MARKET STATSTORONTO REAL ESTATE BOARD'S JUNE 2017 MARKET STATS
TORONTO REAL ESTATE BOARD'S JUNE 2017 MARKET STATS
 
TORONTO REAL ESTATE BOARD'S JUNE 2017 MARKET STATS
TORONTO REAL ESTATE BOARD'S JUNE 2017 MARKET STATSTORONTO REAL ESTATE BOARD'S JUNE 2017 MARKET STATS
TORONTO REAL ESTATE BOARD'S JUNE 2017 MARKET STATS
 
TORONTO REGIONAL REAL ESTATE BOARD's - MARKET WATCH - FOR DECEMBER 2019 & YEA...
TORONTO REGIONAL REAL ESTATE BOARD's - MARKET WATCH - FOR DECEMBER 2019 & YEA...TORONTO REGIONAL REAL ESTATE BOARD's - MARKET WATCH - FOR DECEMBER 2019 & YEA...
TORONTO REGIONAL REAL ESTATE BOARD's - MARKET WATCH - FOR DECEMBER 2019 & YEA...
 
TORONTO REGIONAL REAL ESTATE BOARD's - MARKET WATCH - FOR DECEMBER 2019 & YEA...
TORONTO REGIONAL REAL ESTATE BOARD's - MARKET WATCH - FOR DECEMBER 2019 & YEA...TORONTO REGIONAL REAL ESTATE BOARD's - MARKET WATCH - FOR DECEMBER 2019 & YEA...
TORONTO REGIONAL REAL ESTATE BOARD's - MARKET WATCH - FOR DECEMBER 2019 & YEA...
 
San Francisco Market Report February 2023
San Francisco Market Report February 2023San Francisco Market Report February 2023
San Francisco Market Report February 2023
 
San Francisco Market Report February 2023
San Francisco Market Report February 2023San Francisco Market Report February 2023
San Francisco Market Report February 2023
 
TREB's MARKET WATCH FEBRUARY 2019 REPORT
TREB's MARKET WATCH FEBRUARY 2019 REPORTTREB's MARKET WATCH FEBRUARY 2019 REPORT
TREB's MARKET WATCH FEBRUARY 2019 REPORT
 
TREB's MARKET WATCH FEBRUARY 2019 REPORT
TREB's MARKET WATCH FEBRUARY 2019 REPORTTREB's MARKET WATCH FEBRUARY 2019 REPORT
TREB's MARKET WATCH FEBRUARY 2019 REPORT
 

Mehr von Michelle Makos

Mehr von Michelle Makos (20)

Full Market April Market Watch 2022
Full Market April Market Watch 2022Full Market April Market Watch 2022
Full Market April Market Watch 2022
 
November 2021 Market Watch
November 2021 Market WatchNovember 2021 Market Watch
November 2021 Market Watch
 
Market Stats for October 2021
Market Stats for October 2021Market Stats for October 2021
Market Stats for October 2021
 
September 2021 Market Watch Report
September 2021 Market Watch ReportSeptember 2021 Market Watch Report
September 2021 Market Watch Report
 
August 2021 market watch
August 2021 market watchAugust 2021 market watch
August 2021 market watch
 
July 2021 - Market Report
July 2021 - Market Report July 2021 - Market Report
July 2021 - Market Report
 
May Market Watch 2021
May Market Watch 2021May Market Watch 2021
May Market Watch 2021
 
April 2021 - TRREB Market Report
April 2021 - TRREB Market Report April 2021 - TRREB Market Report
April 2021 - TRREB Market Report
 
November Market Watch 2020
November Market Watch 2020November Market Watch 2020
November Market Watch 2020
 
September 2020 - Market Report - Toronto & GTA Housing Sales
September 2020 - Market Report - Toronto & GTA Housing SalesSeptember 2020 - Market Report - Toronto & GTA Housing Sales
September 2020 - Market Report - Toronto & GTA Housing Sales
 
2020 TREB Year in Review
2020  TREB Year in Review2020  TREB Year in Review
2020 TREB Year in Review
 
Market Watch - September 2019
Market Watch - September 2019Market Watch - September 2019
Market Watch - September 2019
 
January 2018 TREB Market Report
January 2018 TREB Market ReportJanuary 2018 TREB Market Report
January 2018 TREB Market Report
 
Market Report for October 2017 - Residential Resale
Market Report for October 2017 - Residential ResaleMarket Report for October 2017 - Residential Resale
Market Report for October 2017 - Residential Resale
 
TREB MARKET WATCH 2017
TREB MARKET WATCH 2017TREB MARKET WATCH 2017
TREB MARKET WATCH 2017
 
Market Report for August 2017 - Residential Resale
Market Report for August 2017 - Residential ResaleMarket Report for August 2017 - Residential Resale
Market Report for August 2017 - Residential Resale
 
Market Watch July 2017
Market Watch July 2017Market Watch July 2017
Market Watch July 2017
 
Q2 2017 CONDO MARKET REPORT
Q2 2017 CONDO MARKET REPORTQ2 2017 CONDO MARKET REPORT
Q2 2017 CONDO MARKET REPORT
 
Mid Month Stats from TREB for July 2017
Mid Month Stats from TREB for July 2017Mid Month Stats from TREB for July 2017
Mid Month Stats from TREB for July 2017
 
MAY 2017 - MARKET STATS
MAY 2017 - MARKET STATSMAY 2017 - MARKET STATS
MAY 2017 - MARKET STATS
 

Kürzlich hochgeladen

Acibadem Konaklari Uskudar - Listin Turkey
Acibadem Konaklari Uskudar - Listin TurkeyAcibadem Konaklari Uskudar - Listin Turkey
Acibadem Konaklari Uskudar - Listin Turkey
Listing Turkey
 
Cheap Rate ✨➥9711108085▻✨Call Girls In Chandni Chowk (Delhi)
Cheap Rate ✨➥9711108085▻✨Call Girls In Chandni Chowk (Delhi)Cheap Rate ✨➥9711108085▻✨Call Girls In Chandni Chowk (Delhi)
Cheap Rate ✨➥9711108085▻✨Call Girls In Chandni Chowk (Delhi)
delhi24hrs1
 
Bptp The Amaario Launch Luxury Project Sector 37D Gurgaon Dwarka Expressway...
Bptp The Amaario Launch  Luxury Project  Sector 37D Gurgaon Dwarka Expressway...Bptp The Amaario Launch  Luxury Project  Sector 37D Gurgaon Dwarka Expressway...
Bptp The Amaario Launch Luxury Project Sector 37D Gurgaon Dwarka Expressway...
ApartmentWala1
 
BPTP THE AMAARIO Luxury Project Invest Like Royalty in Sector 37D Gurgaon Dwa...
BPTP THE AMAARIO Luxury Project Invest Like Royalty in Sector 37D Gurgaon Dwa...BPTP THE AMAARIO Luxury Project Invest Like Royalty in Sector 37D Gurgaon Dwa...
BPTP THE AMAARIO Luxury Project Invest Like Royalty in Sector 37D Gurgaon Dwa...
ApartmentWala1
 
9990771857 Call Girls in Dwarka Sector 7 Delhi (Call Girls) Delhi
9990771857 Call Girls in Dwarka Sector 7 Delhi (Call Girls) Delhi9990771857 Call Girls in Dwarka Sector 7 Delhi (Call Girls) Delhi
9990771857 Call Girls in Dwarka Sector 7 Delhi (Call Girls) Delhi
delhimodel235
 
9990771857 Call Girls in Dwarka Sector 1 Delhi (Call Girls) Delhi
9990771857 Call Girls in Dwarka Sector 1 Delhi (Call Girls) Delhi9990771857 Call Girls in Dwarka Sector 1 Delhi (Call Girls) Delhi
9990771857 Call Girls in Dwarka Sector 1 Delhi (Call Girls) Delhi
delhimodel235
 
9990771857 Call Girls Dwarka Sector 9 Delhi (Call Girls ) Delhi
9990771857 Call Girls Dwarka Sector 9 Delhi (Call Girls ) Delhi9990771857 Call Girls Dwarka Sector 9 Delhi (Call Girls ) Delhi
9990771857 Call Girls Dwarka Sector 9 Delhi (Call Girls ) Delhi
delhimodel235
 
Call Girls In Gandhi Nagar↬Delhi NCR (Call Us) 8447779280 }Escorts in Delhi NcR
Call Girls In Gandhi Nagar↬Delhi NCR (Call Us) 8447779280 }Escorts in Delhi NcRCall Girls In Gandhi Nagar↬Delhi NCR (Call Us) 8447779280 }Escorts in Delhi NcR
Call Girls In Gandhi Nagar↬Delhi NCR (Call Us) 8447779280 }Escorts in Delhi NcR
asmaqueen5
 
MEQ Mainstreet Equity Corp Q2 2024 Investor Presentation
MEQ Mainstreet Equity Corp Q2 2024 Investor PresentationMEQ Mainstreet Equity Corp Q2 2024 Investor Presentation
MEQ Mainstreet Equity Corp Q2 2024 Investor Presentation
MEQ - Mainstreet Equity Corp.
 

Kürzlich hochgeladen (20)

David Litt Foreclosure Specialist - Your Partner in Real Estate Success
David Litt Foreclosure Specialist - Your Partner in Real Estate SuccessDavid Litt Foreclosure Specialist - Your Partner in Real Estate Success
David Litt Foreclosure Specialist - Your Partner in Real Estate Success
 
Ganga Platinum Kharadi Pune brochure.pdf
Ganga Platinum Kharadi Pune brochure.pdfGanga Platinum Kharadi Pune brochure.pdf
Ganga Platinum Kharadi Pune brochure.pdf
 
Bridge & Elliot Ladner Floor Plans May 2024.pdf
Bridge & Elliot Ladner Floor Plans May 2024.pdfBridge & Elliot Ladner Floor Plans May 2024.pdf
Bridge & Elliot Ladner Floor Plans May 2024.pdf
 
Acibadem Konaklari Uskudar - Listin Turkey
Acibadem Konaklari Uskudar - Listin TurkeyAcibadem Konaklari Uskudar - Listin Turkey
Acibadem Konaklari Uskudar - Listin Turkey
 
Cheap Rate ✨➥9711108085▻✨Call Girls In Chandni Chowk (Delhi)
Cheap Rate ✨➥9711108085▻✨Call Girls In Chandni Chowk (Delhi)Cheap Rate ✨➥9711108085▻✨Call Girls In Chandni Chowk (Delhi)
Cheap Rate ✨➥9711108085▻✨Call Girls In Chandni Chowk (Delhi)
 
The Gale at Godrej Park World Hinjewadi Pune Brochure.pdf
The Gale at Godrej Park World Hinjewadi Pune Brochure.pdfThe Gale at Godrej Park World Hinjewadi Pune Brochure.pdf
The Gale at Godrej Park World Hinjewadi Pune Brochure.pdf
 
Vanam At Purva Soukhyam Guduvanchery.pdf.pdf
Vanam At Purva Soukhyam Guduvanchery.pdf.pdfVanam At Purva Soukhyam Guduvanchery.pdf.pdf
Vanam At Purva Soukhyam Guduvanchery.pdf.pdf
 
Yedi Mavi TOBB Zeytinburnu - Listing Turkey
Yedi Mavi TOBB Zeytinburnu - Listing TurkeyYedi Mavi TOBB Zeytinburnu - Listing Turkey
Yedi Mavi TOBB Zeytinburnu - Listing Turkey
 
Mapusa Beach ( Call Girls ) Goa ✔ 8617370543 ✅ By Goa Call Girls For Pick Up ...
Mapusa Beach ( Call Girls ) Goa ✔ 8617370543 ✅ By Goa Call Girls For Pick Up ...Mapusa Beach ( Call Girls ) Goa ✔ 8617370543 ✅ By Goa Call Girls For Pick Up ...
Mapusa Beach ( Call Girls ) Goa ✔ 8617370543 ✅ By Goa Call Girls For Pick Up ...
 
Bptp The Amaario Launch Luxury Project Sector 37D Gurgaon Dwarka Expressway...
Bptp The Amaario Launch  Luxury Project  Sector 37D Gurgaon Dwarka Expressway...Bptp The Amaario Launch  Luxury Project  Sector 37D Gurgaon Dwarka Expressway...
Bptp The Amaario Launch Luxury Project Sector 37D Gurgaon Dwarka Expressway...
 
Premium Villa Projects in Sarjapur Road Bengaluru
Premium Villa Projects in Sarjapur Road BengaluruPremium Villa Projects in Sarjapur Road Bengaluru
Premium Villa Projects in Sarjapur Road Bengaluru
 
BPTP THE AMAARIO Luxury Project Invest Like Royalty in Sector 37D Gurgaon Dwa...
BPTP THE AMAARIO Luxury Project Invest Like Royalty in Sector 37D Gurgaon Dwa...BPTP THE AMAARIO Luxury Project Invest Like Royalty in Sector 37D Gurgaon Dwa...
BPTP THE AMAARIO Luxury Project Invest Like Royalty in Sector 37D Gurgaon Dwa...
 
9990771857 Call Girls in Dwarka Sector 7 Delhi (Call Girls) Delhi
9990771857 Call Girls in Dwarka Sector 7 Delhi (Call Girls) Delhi9990771857 Call Girls in Dwarka Sector 7 Delhi (Call Girls) Delhi
9990771857 Call Girls in Dwarka Sector 7 Delhi (Call Girls) Delhi
 
9990771857 Call Girls in Dwarka Sector 1 Delhi (Call Girls) Delhi
9990771857 Call Girls in Dwarka Sector 1 Delhi (Call Girls) Delhi9990771857 Call Girls in Dwarka Sector 1 Delhi (Call Girls) Delhi
9990771857 Call Girls in Dwarka Sector 1 Delhi (Call Girls) Delhi
 
Purva Soukhyam in Guduvancheri Chennai.pdf
Purva Soukhyam in Guduvancheri Chennai.pdfPurva Soukhyam in Guduvancheri Chennai.pdf
Purva Soukhyam in Guduvancheri Chennai.pdf
 
BDSM⚡Call Girls in Sector 57 Noida Escorts >༒8448380779 Escort Service
BDSM⚡Call Girls in Sector 57 Noida Escorts >༒8448380779 Escort ServiceBDSM⚡Call Girls in Sector 57 Noida Escorts >༒8448380779 Escort Service
BDSM⚡Call Girls in Sector 57 Noida Escorts >༒8448380779 Escort Service
 
9990771857 Call Girls Dwarka Sector 9 Delhi (Call Girls ) Delhi
9990771857 Call Girls Dwarka Sector 9 Delhi (Call Girls ) Delhi9990771857 Call Girls Dwarka Sector 9 Delhi (Call Girls ) Delhi
9990771857 Call Girls Dwarka Sector 9 Delhi (Call Girls ) Delhi
 
Kohinoor Hinjewadi Phase 2 Pune E-Brochure.pdf
Kohinoor Hinjewadi Phase 2 Pune  E-Brochure.pdfKohinoor Hinjewadi Phase 2 Pune  E-Brochure.pdf
Kohinoor Hinjewadi Phase 2 Pune E-Brochure.pdf
 
Call Girls In Gandhi Nagar↬Delhi NCR (Call Us) 8447779280 }Escorts in Delhi NcR
Call Girls In Gandhi Nagar↬Delhi NCR (Call Us) 8447779280 }Escorts in Delhi NcRCall Girls In Gandhi Nagar↬Delhi NCR (Call Us) 8447779280 }Escorts in Delhi NcR
Call Girls In Gandhi Nagar↬Delhi NCR (Call Us) 8447779280 }Escorts in Delhi NcR
 
MEQ Mainstreet Equity Corp Q2 2024 Investor Presentation
MEQ Mainstreet Equity Corp Q2 2024 Investor PresentationMEQ Mainstreet Equity Corp Q2 2024 Investor Presentation
MEQ Mainstreet Equity Corp Q2 2024 Investor Presentation
 

February 2022 Market Watch

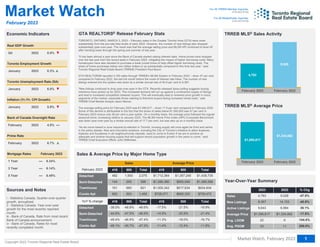
  • 1. Sources and Notes i - Statistics Canada, Quarter-over-quarter growth, annualized. ii - Statistics Canada, Year-over-year growth for the most recently reported month. iii - Bank of Canada, Rate from most recent Bank of Canada announcement. iv - Bank of Canada, Rates for most recently completed month. % Chg Inflation (Yr./Yr. CPI Growth) Toronto Employment Growth 1 Year 3 Year 5 Year ­ 6.34% ­ 6.14% ­ 6.49% Real GDP Growth 416 905 Total Detached Semi-Detached Townhouse Condo Apt -48.1% -49.4% -44.6% -38.0% -45.7% -46.9% -47.5% -48.8% Market Watch, February 2023 TRREB MLS Sales Activity February 2023 February 2022 $1,334,062 $1,095,617 TRREB MLS Average Price 2023 2022 Sales New Listings Active Listings Average Price Avg. LDOM Avg. PDOM 11 9 $1,334,062 0 0 9,028 33 22 $1,095,617 1 2,139 4,783 Market Watch For All TRREB Member Inquiries: 416-443-8152 nk For All Media/Public Inquiries: 416-443-8158 Copyright 2023 Toronto Regional Real Estate Board February 2023 Economic Indicators ® 200.0% 144.4% -17.9% -47.0% -47.0% -47.0% Year-Over-Year Summary February 2023 February 2022 9,028 4,783 14,153 8,367 -40.9% 6,984 9,643 GTA REALTORS Release February Stats TORONTO, ONTARIO, MARCH 3, 2023 – February sales in the Greater Toronto Area (GTA) were down substantially from the pre-rate hike levels of early 2022. However, the number of new listings also dropped substantially year-over-year. The result was that the average selling price and MLS® HPI continued to level off after trending lower through the spring and summer of last year. “It has been almost a year since the Bank of Canada started raising interest rates. Home prices have dropped over the last year from the record peak in February 2022, mitigating the impact of higher borrowing costs. Many homebuyers have also decided to purchase a lower priced home to help offset higher borrowing costs. The share of home purchases below one million dollars is up substantially compared to this time last year,” said Toronto Regional Real Estate Board (TRREB) President Paul Baron. GTA REALTORS® reported 4,783 sales through TRREB’s MLS® System in February 2023 – down 47 per cent compared to February 2022, the last full month before the onset of interest rate hikes. The number of new listings entered into the system was down by a similar annual rate of 40.9 per cent to 8,367. “New listings continued to drop year-over-year in the GTA. Recently released Ipsos polling suggests buying intentions have picked up for 2023. This increased demand will run up against a constrained supply of listings and lead to increased competition between buyers. This will eventually lead to renewed price growth in many segments of the market, especially those catering to first-time buyers facing increased rental costs,” said TRREB Chief Market Analyst Jason Mercer. The average selling price for February 2023 was $1,095,617 – down 17.9 per cent compared to February 2022. Some of this decline is attributable to the fact that the share of sales below $1,000,000 was 57 per cent in February 2023 versus only 38 per cent a year earlier. On a monthly basis, the average price followed the regular seasonal trend, increasing relative to January 2023. The MLS® Home Price Index (HPI) Composite Benchmark was down year-over-year by a similar annual rate of 17.7 per cent, but was also up on a monthly basis. “As we move toward a June mayoral by-election in Toronto, housing supply will once again be front and centre in the policy debate. New and innovative solutions, including the City of Toronto’s initiative to allow duplexes, triplexes and fourplexes in all neighbourhoods citywide, need to come to fruition if we are to achieve an adequate and diverse housing supply that will support record population growth in the years to come,” said TRREB Chief Executive Officer John DiMichele. ® Sales & Average Price by Major Home Type 416 905 Total Detached Semi-Detached Townhouse Condo Apt 1,455 821 399 2,075 503 660 255 1,593 952 161 144 482 416 905 Total $705,472 $934,834 $1,069,266 $1,439,735 $662,323 $917,634 $950,049 $1,357,245 $728,271 $1,005,342 $1,280,380 $1,712,364 Sales Average Price YoY % change February 2023 416 905 Total -11.4% -11.3% -14.9% -17.5% -12.4% -18.0% -25.9% -21.5% Q4 2022 0.0% ½ January 2023 0.3% · January 2023 6.0% ½ Toronto Unemployment Rate (SA) January 2023 5.9% ½ February 2023 4.5% ­ Bank of Canada Overnight Rate February 2023 6.7% · Prime Rate Mortgage Rates February 2023 38.1% ® 1 -47.3% -47.4% -46.5% -46.6% -11.8% -16.7% -21.4% -19.9%
  • 2. Market Watch, February 2023 Toronto Regional Real Estate Board SALES BY PRICE RANGE AND HOUSE TYPE February 2023 Copyright 2023 Toronto Regional Real Estate Board 2 Year-to-Date 2023 Detached Semi-Detached Att/Row/Townhouse Condo Townhouse Condo Apartment Link Co-Op Apartment Detached Condo Co-Ownership Apt Total $0 to $99,999 $100,000 to $199,999 $200,000 to $299,999 $300,000 to $399,999 $400,000 to $499,999 $500,000 to $599,999 $600,000 to $699,999 $700,000 to $799,999 $800,000 to $899,999 $900,000 to $999,999 $1,000,000 to $1,249,999 $1,250,000 to $1,499,999 $1,500,000 to $1,749,999 $1,750,000 to $1,999,999 $2,000,000+ 485 240 467 856 1,244 884 793 820 929 851 254 39 14 0 1 0 0 0 0 0 0 0 0 0 2 3 2 1 0 0 0 0 0 2 1 0 0 4 0 0 0 0 0 0 0 0 0 0 0 0 0 0 1 1 1 0 4 0 0 0 0 0 0 11 12 4 4 4 1 2 0 0 0 0 0 25 14 20 32 78 107 164 313 642 746 223 26 10 0 1 0 2 5 16 38 44 90 184 137 52 12 0 0 0 0 11 5 20 82 162 203 133 95 24 3 1 0 0 0 0 13 13 23 55 176 154 112 53 36 4 0 0 0 0 0 436 206 399 658 777 372 290 166 88 41 15 7 3 0 0 Total Sales Share of Total Sales (%) Average Price $1,073,138 100.0% 7,877 $425,189 0.1% 8 $969,143 0.1% 7 $501,055 0.1% 7 $1,063,064 0.5% 38 $697,765 30.5% 2,401 $782,097 7.4% 580 $1,022,815 9.4% 739 $1,050,614 8.1% 639 $1,400,482 43.9% 3,458 Detached Semi-Detached Att/Row/Townhouse Condo Townhouse Condo Apartment Link Co-Op Apartment Detached Condo Co-Ownership Apt Total $0 to $99,999 $100,000 to $199,999 $200,000 to $299,999 $300,000 to $399,999 $400,000 to $499,999 $500,000 to $599,999 $600,000 to $699,999 $700,000 to $799,999 $800,000 to $899,999 $900,000 to $999,999 $1,000,000 to $1,249,999 $1,250,000 to $1,499,999 $1,500,000 to $1,749,999 $1,750,000 to $1,999,999 $2,000,000+ 323 160 284 555 748 545 465 482 563 483 141 23 11 0 0 0 0 0 0 0 0 0 0 0 1 2 0 0 0 0 0 0 0 1 0 0 0 1 0 0 0 0 0 0 0 0 0 0 0 0 0 0 1 0 0 0 3 0 0 0 0 0 0 8 8 4 3 1 0 0 0 0 0 0 0 15 9 12 22 47 71 111 192 400 430 120 18 8 0 0 0 0 2 14 24 29 56 115 79 30 9 0 0 0 0 9 4 13 64 102 136 75 46 11 2 1 0 0 0 0 11 12 10 41 108 93 62 32 27 3 0 0 0 0 0 288 135 247 405 459 212 158 94 46 17 9 2 3 0 0 Total Sales Share of Total Sales (%) Average Price $1,095,617 100.0% 4,783 $478,504 0.1% 3 $1,044,500 0.0% 2 $476,472 0.1% 4 $1,118,949 0.5% 24 $705,472 30.4% 1,455 $785,448 7.5% 358 $1,050,342 9.7% 463 $1,069,266 8.3% 399 $1,439,735 43.4% 2,075 SALES BY PRICE RANGE AND HOUSE TYPE
  • 3. Sales Dollar Volume Average Price Median Price New Listings SNLR Trend Active Listings Mos Inv (Trend) Avg. SP/LP Avg. LDOM Avg. PDOM Abc Abc Abc Abc Abc Abc Abc Abc Abc Abc Abc Abc Abc Abc Abc Abc Abc Abc Abc Abc Abc Abc Abc Abc Abc Abc Abc Abc Abc Abc Abc Abc Abc Abc Abc Abc Abc Abc Abc Abc Abc All TRREB Areas Halton Region Burlington Halton Hills Milton Oakville Peel Region Brampton Caledon Mississauga City of Toronto Toronto West Toronto Central Toronto East York Region Aurora East Gwillimbury Georgina King Markham Newmarket Richmond Hill Vaughan Stouffville Durham Region Ajax Brock Clarington Oshawa Pickering Scugog Uxbridge Whitby Dufferin County Orangeville Simcoe County Adjala-Tosorontio Bradford Essa Innisfil New Tecumseth 4,783 525 525 176 46 126 126 177 832 382 382 67 383 1,745 1,745 469 883 393 393 910 55 34 34 49 23 216 216 75 167 167 254 254 37 601 601 77 77 14 106 106 168 168 91 20 20 15 15 110 26 26 26 26 144 8 8 33 33 21 41 41 41 $5,240,334,140 $641,599,821 $641,599,821 $184,417,830 $47,221,807 $132,964,277 $132,964,277 $276,995,907 $858,861,629 $392,769,158 $392,769,158 $79,337,799 $386,754,672 $1,868,970,354 $1,868,970,354 $464,441,692 $1,006,369,609 $398,159,053 $398,159,053 $1,185,475,534 $67,292,456 $41,847,688 $41,847,688 $46,332,500 $49,356,276 $268,131,603 $268,131,603 $88,112,692 $231,962,390 $231,962,390 $342,940,853 $342,940,853 $49,499,076 $533,957,340 $533,957,340 $77,533,106 $77,533,106 $10,381,500 $94,099,434 $94,099,434 $128,861,706 $128,861,706 $78,748,007 $18,619,050 $18,619,050 $18,401,900 $18,401,900 $107,312,637 $21,133,000 $21,133,000 $21,133,000 $21,133,000 $130,336,462 $7,938,000 $7,938,000 $34,515,100 $34,515,100 $17,571,675 $34,829,000 $34,829,000 $35,482,687 $1,095,617 $1,222,095 $1,222,095 $1,047,829 $1,026,561 $1,055,272 $1,055,272 $1,564,949 $1,032,286 $1,028,192 $1,028,192 $1,184,146 $1,009,803 $1,071,043 $1,071,043 $990,281 $1,139,716 $1,013,127 $1,013,127 $1,302,720 $1,223,499 $1,230,814 $1,230,814 $945,561 $2,145,925 $1,241,350 $1,241,350 $1,174,836 $1,388,996 $1,388,996 $1,350,161 $1,350,161 $1,337,813 $888,448 $888,448 $1,006,923 $1,006,923 $741,536 $887,731 $887,731 $767,034 $767,034 $865,363 $930,953 $930,953 $1,226,793 $1,226,793 $975,569 $812,808 $812,808 $812,808 $812,808 $905,114 $992,250 $992,250 $1,045,912 $1,045,912 $836,746 $849,488 $849,488 $865,431 $940,000 $1,065,000 $1,065,000 $930,000 $932,500 $975,365 $975,365 $1,360,000 $950,000 $955,000 $955,000 $1,093,000 $880,000 $850,000 $850,000 $862,500 $800,000 $950,000 $950,000 $1,215,000 $1,135,000 $1,147,500 $1,147,500 $895,000 $2,040,000 $1,222,500 $1,222,500 $1,201,000 $1,300,000 $1,300,000 $1,225,000 $1,225,000 $1,260,000 $850,000 $850,000 $949,500 $949,500 $667,500 $825,000 $825,000 $749,000 $749,000 $861,000 $799,000 $799,000 $1,005,000 $1,005,000 $961,500 $742,000 $742,000 $742,000 $742,000 $867,500 $835,000 $835,000 $962,500 $962,500 $757,500 $845,000 $845,000 $775,000 8,367 870 870 271 92 172 172 335 1,404 610 610 113 681 3,314 3,314 863 1,800 651 651 1,494 89 71 71 77 48 311 311 103 291 291 416 416 88 896 896 116 116 23 148 148 281 281 113 28 28 30 30 157 48 48 48 48 341 25 25 75 75 34 129 129 78 46.6% 48.2% 48.2% 51.3% 45.0% 48.5% 48.5% 46.1% 43.9% 43.2% 43.2% 36.4% 45.8% 46.8% 46.8% 47.6% 44.1% 51.7% 51.7% 45.8% 48.8% 42.1% 42.1% 42.8% 33.4% 51.4% 51.4% 53.4% 44.5% 44.5% 42.2% 42.2% 44.1% 52.4% 52.4% 52.7% 52.7% 41.1% 54.9% 54.9% 52.4% 52.4% 50.8% 52.2% 52.2% 52.6% 52.6% 52.5% 51.9% 51.9% 51.9% 51.9% 37.9% 33.7% 33.7% 40.2% 40.2% 44.4% 32.4% 32.4% 41.1% 9,643 983 983 340 107 137 137 399 1,589 635 635 186 768 4,110 4,110 1,047 2,412 651 651 1,663 86 78 78 97 84 308 308 100 314 314 482 482 114 777 777 84 84 36 136 136 244 244 97 28 28 34 34 118 48 48 48 48 473 37 37 72 72 43 209 209 112 2.2 2.1 2.1 2.0 2.2 1.7 1.7 2.4 2.2 2.1 2.1 3.5 2.2 2.3 2.3 2.3 2.7 1.7 1.7 2.3 2.0 2.7 2.7 2.5 4.8 1.8 1.8 1.6 2.5 2.5 2.6 2.6 2.7 1.4 1.4 1.3 1.3 3.1 1.3 1.3 1.4 1.4 1.6 2.1 2.1 1.9 1.9 1.3 1.9 1.9 1.9 1.9 3.1 4.8 4.8 2.4 2.4 2.4 4.0 4.0 2.9 100% 98% 98% 98% 98% 100% 100% 98% 98% 98% 98% 96% 98% 100% 100% 99% 99% 103% 103% 102% 101% 100% 100% 99% 93% 106% 106% 101% 104% 104% 101% 101% 102% 102% 102% 103% 103% 96% 99% 99% 102% 102% 102% 96% 96% 101% 101% 103% 99% 99% 99% 99% 97% 97% 97% 97% 97% 98% 97% 97% 98% 22 21 21 25 22 14 14 22 24 23 23 31 24 24 24 25 25 19 19 21 20 20 20 25 52 17 17 22 19 19 22 22 18 17 17 14 14 29 19 19 16 16 16 26 26 22 22 14 23 23 23 23 27 44 44 23 23 30 33 33 20 33 31 31 35 34 22 22 33 35 32 32 44 36 35 35 34 37 32 32 31 26 32 32 33 79 25 25 30 33 33 33 33 24 25 25 22 22 35 33 33 23 23 26 33 33 32 32 17 39 39 39 39 35 44 44 32 32 42 44 44 24 Toronto Regional Real Estate Board SUMMARY OF EXISTING HOME TRANSACTIONS All Home Types, February 2023 Market Watch, February 2023 Copyright 2023 Toronto Regional Real Estate Board 3 ALL TRREB AREAS
  • 4. Sales Dollar Volume Average Price Median Price New Listings SNLR Trend Active Listings Mos Inv (Trend) Avg. SP/LP Avg. LDOM Avg. PDOM Abc Abc Abc Abc Abc Abc Abc Abc Abc Abc Abc Abc Abc Abc Abc Abc Abc Abc Abc Abc Abc Abc Abc Abc Abc Abc Abc Abc Abc Abc Abc Abc Abc Abc Abc Abc Abc Abc Abc Abc All TRREB Areas All TRREB Areas City of Toronto City of Toronto Toronto West Toronto W01 Toronto W02 Toronto W02 Toronto W03 Toronto W03 Toronto W04 Toronto W05 Toronto W06 Toronto W06 Toronto W07 Toronto W07 Toronto W08 Toronto W09 Toronto W10 Toronto W10 Toronto Central Toronto Central Toronto C01 Toronto C02 Toronto C03 Toronto C03 Toronto C04 Toronto C04 Toronto C06 Toronto C07 Toronto C08 Toronto C08 Toronto C09 Toronto C09 Toronto C10 Toronto C11 Toronto C12 Toronto C12 Toronto C13 Toronto C13 Toronto C14 Toronto C15 Toronto East Toronto East Toronto E01 Toronto E01 Toronto E02 Toronto E03 Toronto E04 Toronto E04 Toronto E05 Toronto E05 Toronto E06 Toronto E07 Toronto E08 Toronto E08 Toronto E09 Toronto E09 Toronto E10 Toronto E11 4,783 4,783 1,745 1,745 469 37 46 46 39 39 53 64 87 87 14 14 75 23 31 31 883 883 257 55 29 29 33 33 19 64 129 129 15 15 48 25 18 18 41 41 66 84 393 393 41 41 28 57 40 40 32 32 17 40 33 33 45 45 22 38 $5,240,334,140 $5,240,334,140 $1,868,970,354 $1,868,970,354 $464,441,692 $41,036,027 $58,193,718 $58,193,718 $36,219,788 $36,219,788 $45,206,995 $49,888,900 $79,824,814 $79,824,814 $20,674,800 $20,674,800 $90,859,800 $20,592,500 $21,944,350 $21,944,350 $1,006,369,609 $1,006,369,609 $238,146,113 $93,671,706 $39,791,606 $39,791,606 $67,579,054 $67,579,054 $18,730,875 $74,906,688 $97,175,506 $97,175,506 $31,543,800 $31,543,800 $47,579,897 $42,449,800 $43,733,500 $43,733,500 $51,825,212 $51,825,212 $71,239,764 $87,996,088 $398,159,053 $398,159,053 $47,773,553 $47,773,553 $39,418,283 $68,035,444 $35,832,386 $35,832,386 $30,345,000 $30,345,000 $22,906,112 $31,051,987 $32,374,800 $32,374,800 $38,288,800 $38,288,800 $24,164,900 $27,967,788 $1,095,617 $1,095,617 $1,071,043 $1,071,043 $990,281 $1,109,082 $1,265,081 $1,265,081 $928,713 $928,713 $852,962 $779,514 $917,527 $917,527 $1,476,771 $1,476,771 $1,211,464 $895,326 $707,882 $707,882 $1,139,716 $1,139,716 $926,639 $1,703,122 $1,372,124 $1,372,124 $2,047,850 $2,047,850 $985,836 $1,170,417 $753,298 $753,298 $2,102,920 $2,102,920 $991,248 $1,697,992 $2,429,639 $2,429,639 $1,264,030 $1,264,030 $1,079,390 $1,047,572 $1,013,127 $1,013,127 $1,165,209 $1,165,209 $1,407,796 $1,193,604 $895,810 $895,810 $948,281 $948,281 $1,347,418 $776,300 $981,055 $981,055 $850,862 $850,862 $1,098,405 $735,994 $940,000 $940,000 $850,000 $850,000 $862,500 $962,000 $1,140,000 $1,140,000 $960,000 $960,000 $845,000 $794,000 $810,000 $810,000 $1,249,000 $1,249,000 $778,000 $815,000 $580,000 $580,000 $800,000 $800,000 $712,000 $1,150,000 $910,000 $910,000 $1,961,111 $1,961,111 $706,000 $920,000 $687,000 $687,000 $2,052,800 $2,052,800 $736,250 $1,220,000 $1,487,500 $1,487,500 $972,000 $972,000 $777,500 $822,500 $950,000 $950,000 $1,131,000 $1,131,000 $1,269,522 $1,150,000 $937,500 $937,500 $764,000 $764,000 $1,091,500 $630,000 $1,000,000 $1,000,000 $870,000 $870,000 $1,015,000 $742,000 8,367 8,367 3,314 3,314 863 75 94 94 45 45 89 111 159 159 26 26 174 39 51 51 1,800 1,800 533 106 66 66 79 79 42 112 299 299 37 37 94 46 45 45 67 67 129 145 651 651 65 65 56 89 85 85 61 61 42 62 56 56 57 57 46 32 46.6% 46.6% 46.8% 46.8% 47.6% 51.5% 52.8% 52.8% 47.2% 47.2% 47.3% 47.3% 44.0% 44.0% 55.0% 55.0% 47.9% 48.0% 43.5% 43.5% 44.1% 44.1% 43.7% 41.0% 44.7% 44.7% 48.3% 48.3% 39.2% 45.0% 40.4% 40.4% 53.5% 53.5% 45.3% 47.9% 36.0% 36.0% 48.9% 48.9% 44.6% 48.8% 51.7% 51.7% 54.6% 54.6% 52.2% 51.4% 53.6% 53.6% 52.7% 52.7% 49.4% 49.4% 50.4% 50.4% 49.8% 49.8% 51.9% 51.8% 9,643 9,643 4,110 4,110 1,047 79 81 81 52 52 118 146 200 200 27 27 217 53 74 74 2,412 2,412 735 176 75 75 110 110 57 128 418 418 40 40 123 40 80 80 75 75 177 178 651 651 59 59 60 76 85 85 57 57 42 62 68 68 59 59 49 34 2.2 2.2 2.3 2.3 2.3 1.8 1.6 1.6 2.3 2.3 2.4 2.6 2.6 2.6 1.6 1.6 2.2 2.3 2.7 2.7 2.7 2.7 2.8 3.3 2.6 2.6 2.1 2.1 2.9 2.6 3.0 3.0 2.2 2.2 2.5 2.2 5.6 5.6 2.3 2.3 2.8 2.3 1.7 1.7 1.3 1.3 1.4 1.6 1.6 1.6 1.8 1.8 1.9 2.1 2.1 2.1 1.8 1.8 1.6 1.8 100% 100% 100% 100% 99% 101% 104% 104% 99% 99% 100% 99% 99% 99% 99% 99% 98% 97% 98% 98% 99% 99% 98% 95% 98% 98% 100% 100% 100% 99% 99% 99% 100% 100% 101% 99% 99% 99% 102% 102% 98% 99% 103% 103% 104% 104% 105% 104% 108% 108% 105% 105% 91% 106% 100% 100% 105% 105% 101% 102% 22 22 24 24 25 21 20 20 23 23 25 28 23 23 13 13 29 31 28 28 25 25 28 28 15 15 16 16 25 21 27 27 13 13 19 22 23 23 15 15 30 25 19 19 19 19 8 19 20 20 15 15 29 24 18 18 18 18 23 23 33 33 35 35 34 27 26 26 32 32 35 37 34 34 19 19 36 34 48 48 37 37 40 39 19 19 24 24 45 38 35 35 17 17 30 32 41 41 25 25 49 40 32 32 34 34 13 41 30 30 24 24 32 34 36 36 28 28 36 36 Toronto Regional Real Estate Board SUMMARY OF EXISTING HOME TRANSACTIONS All Home Types, February 2023 Market Watch, February 2023 Copyright 2023 Toronto Regional Real Estate Board 4 City of Toronto Municipal Breakdown
  • 5. Sales Dollar Volume Average Price Median Price New Listings Avg. SP/LP Avg. LDOM Avg. PDOM All TRREB Areas Halton Region Halton Region Burlington Halton Hills Milton Milton Oakville Peel Region Brampton Brampton Caledon Mississauga City of Toronto City of Toronto Toronto West Toronto Central Toronto East Toronto East York Region Aurora East Gwillimbury East Gwillimbury Georgina King Markham Markham Newmarket Richmond Hill Richmond Hill Vaughan Vaughan Stouffville Durham Region Durham Region Ajax Ajax Brock Clarington Clarington Oshawa Oshawa Pickering Scugog Scugog Uxbridge Uxbridge Whitby Dufferin County Dufferin County Orangeville Orangeville Simcoe County Adjala-Tosorontio Adjala-Tosorontio Bradford Bradford Essa Innisfil Innisfil New Tecumseth 7,877 874 874 303 83 189 189 299 1,406 667 667 95 644 2,851 2,851 783 1,416 652 652 1,453 87 50 50 82 32 362 362 114 278 278 386 386 62 995 995 133 133 20 172 172 279 279 147 29 29 29 29 186 47 47 47 47 251 15 15 55 55 32 73 73 76 $8,453,111,806 $1,033,436,756 $1,033,436,756 $303,259,254 $85,086,057 $199,559,274 $199,559,274 $445,532,171 $1,428,590,189 $677,796,265 $677,796,265 $123,621,799 $627,172,125 $2,960,574,404 $2,960,574,404 $761,423,904 $1,555,063,734 $644,086,766 $644,086,766 $1,884,044,890 $115,236,956 $64,181,688 $64,181,688 $72,009,000 $67,671,276 $452,958,419 $452,958,419 $133,731,056 $376,234,364 $376,234,364 $518,876,055 $518,876,055 $83,146,076 $883,360,917 $883,360,917 $129,688,507 $129,688,507 $13,853,500 $148,310,234 $148,310,234 $214,912,537 $214,912,537 $131,385,258 $27,139,050 $27,139,050 $34,259,595 $34,259,595 $183,812,236 $38,575,109 $38,575,109 $38,575,109 $38,575,109 $224,529,541 $16,318,000 $16,318,000 $58,004,800 $58,004,800 $26,371,675 $60,329,000 $60,329,000 $63,506,066 $1,073,138 $1,182,422 $1,182,422 $1,000,856 $1,025,133 $1,055,869 $1,055,869 $1,490,074 $1,016,067 $1,016,186 $1,016,186 $1,301,282 $973,870 $1,038,434 $1,038,434 $972,444 $1,098,209 $987,863 $987,863 $1,296,659 $1,324,563 $1,283,634 $1,283,634 $878,159 $2,114,727 $1,251,266 $1,251,266 $1,173,079 $1,353,361 $1,353,361 $1,344,238 $1,344,238 $1,341,066 $887,800 $887,800 $975,102 $975,102 $692,675 $862,269 $862,269 $770,296 $770,296 $893,777 $935,829 $935,829 $1,181,365 $1,181,365 $988,238 $820,747 $820,747 $820,747 $820,747 $894,540 $1,087,867 $1,087,867 $1,054,633 $1,054,633 $824,115 $826,425 $826,425 $835,606 $925,000 $1,015,500 $1,015,500 $899,000 $940,000 $975,000 $975,000 $1,280,000 $930,000 $940,300 $940,300 $1,100,200 $851,000 $829,000 $829,000 $840,000 $780,000 $930,750 $930,750 $1,200,000 $1,195,000 $1,156,900 $1,156,900 $834,000 $1,592,500 $1,230,000 $1,230,000 $1,181,500 $1,253,400 $1,253,400 $1,205,000 $1,205,000 $1,267,500 $848,000 $848,000 $931,000 $931,000 $657,750 $809,000 $809,000 $750,000 $750,000 $861,000 $810,000 $810,000 $1,026,000 $1,026,000 $960,500 $760,000 $760,000 $760,000 $760,000 $860,000 $995,000 $995,000 $970,000 $970,000 $751,250 $810,000 $810,000 $773,750 16,060 1,648 1,648 543 173 316 316 616 2,763 1,200 1,200 248 1,315 6,324 6,324 1,642 3,448 1,234 1,234 2,838 161 122 122 154 90 602 602 202 559 559 798 798 150 1,760 1,760 234 234 49 282 282 529 529 237 61 61 62 62 306 84 84 84 84 643 38 38 136 136 61 252 252 156 99% 98% 98% 97% 97% 100% 100% 97% 98% 98% 98% 96% 98% 99% 99% 99% 98% 102% 102% 101% 99% 98% 98% 98% 93% 105% 105% 100% 103% 103% 99% 99% 101% 101% 101% 102% 102% 96% 99% 99% 101% 101% 101% 98% 98% 98% 98% 101% 97% 97% 97% 97% 97% 96% 96% 96% 96% 97% 97% 97% 98% 25 26 26 28 28 18 18 28 25 23 23 31 26 26 26 28 27 22 22 23 21 22 22 30 50 20 20 21 21 21 24 24 27 19 19 15 15 33 21 21 18 18 20 27 27 23 23 15 30 30 30 30 30 49 49 24 24 30 37 37 24 36 36 36 38 41 26 26 39 38 35 35 46 40 39 39 40 40 34 34 33 27 30 30 39 74 28 28 30 35 35 36 36 37 27 27 24 24 37 34 34 25 25 29 35 35 36 36 21 45 45 45 45 42 57 57 38 38 42 51 51 31 Toronto Regional Real Estate Board SUMMARY OF EXISTING HOME TRANSACTIONS All Home Types, Year-to-Date 2023 Market Watch, February 2023 Copyright 2023 Toronto Regional Real Estate Board 5 ALL TRREB AREAS
  • 6. Sales Dollar Volume Average Price Median Price New Listings Avg. SP/LP Avg. LDOM Avg. PDOM All TRREB Areas All TRREB Areas City of Toronto City of Toronto Toronto West Toronto W01 Toronto W02 Toronto W02 Toronto W03 Toronto W03 Toronto W04 Toronto W05 Toronto W06 Toronto W06 Toronto W07 Toronto W07 Toronto W08 Toronto W09 Toronto W10 Toronto W10 Toronto Central Toronto Central Toronto C01 Toronto C02 Toronto C03 Toronto C03 Toronto C04 Toronto C04 Toronto C06 Toronto C07 Toronto C08 Toronto C08 Toronto C09 Toronto C09 Toronto C10 Toronto C11 Toronto C12 Toronto C12 Toronto C13 Toronto C13 Toronto C14 Toronto C15 Toronto East Toronto East Toronto E01 Toronto E01 Toronto E02 Toronto E03 Toronto E04 Toronto E04 Toronto E05 Toronto E05 Toronto E06 Toronto E07 Toronto E08 Toronto E08 Toronto E09 Toronto E09 Toronto E10 Toronto E11 7,877 7,877 2,851 2,851 783 53 67 67 64 64 94 102 141 141 23 23 142 38 59 59 1,416 1,416 421 83 52 52 67 67 30 104 188 188 22 22 74 45 24 24 65 65 105 136 652 652 63 63 53 85 73 73 63 63 29 61 53 53 75 75 39 58 $8,453,111,806 $8,453,111,806 $2,960,574,404 $2,960,574,404 $761,423,904 $58,407,026 $83,173,718 $83,173,718 $56,793,676 $56,793,676 $80,783,583 $78,373,600 $125,847,002 $125,847,002 $36,799,500 $36,799,500 $164,458,911 $32,687,038 $44,099,850 $44,099,850 $1,555,063,734 $1,555,063,734 $375,418,542 $140,645,636 $69,314,598 $69,314,598 $127,838,942 $127,838,942 $30,004,393 $116,645,788 $143,000,505 $143,000,505 $49,497,300 $49,497,300 $68,626,897 $64,653,300 $53,033,500 $53,033,500 $75,464,612 $75,464,612 $110,393,901 $130,525,820 $644,086,766 $644,086,766 $72,901,553 $72,901,553 $67,262,479 $99,831,444 $64,687,885 $64,687,885 $56,623,576 $56,623,576 $33,430,292 $49,083,987 $49,123,000 $49,123,000 $63,652,076 $63,652,076 $41,465,400 $46,025,074 $1,073,138 $1,073,138 $1,038,434 $1,038,434 $972,444 $1,102,019 $1,241,399 $1,241,399 $887,401 $887,401 $859,400 $768,369 $892,532 $892,532 $1,599,978 $1,599,978 $1,158,161 $860,185 $747,455 $747,455 $1,098,209 $1,098,209 $891,731 $1,694,526 $1,332,973 $1,332,973 $1,908,044 $1,908,044 $1,000,146 $1,121,594 $760,641 $760,641 $2,249,877 $2,249,877 $927,391 $1,436,740 $2,209,729 $2,209,729 $1,160,994 $1,160,994 $1,051,370 $959,749 $987,863 $987,863 $1,157,168 $1,157,168 $1,269,103 $1,174,488 $886,135 $886,135 $898,787 $898,787 $1,152,769 $804,656 $926,849 $926,849 $848,694 $848,694 $1,063,215 $793,536 $925,000 $925,000 $829,000 $829,000 $840,000 $977,500 $1,120,000 $1,120,000 $881,500 $881,500 $824,444 $720,000 $795,000 $795,000 $1,248,000 $1,248,000 $745,500 $815,000 $753,000 $753,000 $780,000 $780,000 $705,000 $1,255,000 $954,500 $954,500 $1,810,000 $1,810,000 $827,000 $830,900 $680,000 $680,000 $2,066,400 $2,066,400 $730,000 $950,000 $1,510,000 $1,510,000 $870,000 $870,000 $770,000 $719,000 $930,750 $930,750 $1,100,000 $1,100,000 $1,230,000 $1,120,000 $925,000 $925,000 $725,000 $725,000 $925,000 $650,000 $905,000 $905,000 $850,000 $850,000 $1,020,000 $770,000 16,060 16,060 6,324 6,324 1,642 126 154 154 105 105 180 209 322 322 46 46 315 72 113 113 3,448 3,448 1,025 222 123 123 148 148 78 213 581 581 54 54 191 80 72 72 129 129 241 291 1,234 1,234 134 134 111 163 145 145 116 116 68 101 113 113 124 124 82 77 99% 99% 99% 99% 99% 100% 102% 102% 99% 99% 99% 97% 98% 98% 97% 97% 98% 96% 98% 98% 98% 98% 98% 95% 98% 98% 97% 97% 98% 99% 99% 99% 98% 98% 101% 99% 97% 97% 101% 101% 98% 99% 102% 102% 102% 102% 103% 102% 105% 105% 103% 103% 94% 104% 100% 100% 104% 104% 98% 101% 25 25 26 26 28 24 21 21 24 24 32 36 23 23 19 19 30 36 31 31 27 27 30 31 16 16 28 28 29 23 28 28 24 24 23 26 23 23 22 22 31 27 22 22 18 18 14 21 19 19 23 23 28 28 22 22 23 23 25 26 36 36 39 39 40 30 27 27 37 37 48 48 35 35 34 34 43 45 48 48 40 40 42 43 23 23 37 37 48 38 36 36 26 26 34 42 42 42 32 32 51 42 34 34 32 32 22 39 27 27 37 37 32 38 36 36 34 34 40 39 Toronto Regional Real Estate Board SUMMARY OF EXISTING HOME TRANSACTIONS All Home Types, Year-to-Date 2023 Market Watch, February 2023 Copyright 2023 Toronto Regional Real Estate Board 6 City of Toronto Municipal Breakdown
  • 7. Sales Dollar Volume Average Price Median Price New Listings Active Listings Avg. SP/LP Avg. LDOM Abc Abc Abc Abc Abc Abc Abc Abc Abc Abc Abc Abc Abc Abc Abc Abc Abc Abc Abc Abc Abc Abc Abc Abc Abc Abc Abc Abc Abc Abc Abc Abc Abc Abc Abc Abc Abc Abc Abc Abc Abc All TRREB Areas Halton Region Halton Region Burlington Halton Hills Milton Milton Oakville Peel Region Brampton Brampton Caledon Mississauga City of Toronto City of Toronto Toronto West Toronto Central Toronto East Toronto East York Region Aurora East Gwillimbury East Gwillimbury Georgina King Markham Markham Newmarket Richmond Hill Richmond Hill Vaughan Vaughan Stouffville Durham Region Durham Region Ajax Ajax Brock Clarington Clarington Oshawa Oshawa Pickering Scugog Scugog Uxbridge Uxbridge Whitby Dufferin County Dufferin County Orangeville Orangeville Simcoe County Adjala-Tosorontio Adjala-Tosorontio Bradford Bradford Essa Innisfil Innisfil New Tecumseth 2,075 265 265 79 33 56 56 97 364 198 198 44 122 482 482 159 152 171 171 467 30 23 23 42 18 83 83 53 76 76 116 116 26 373 373 46 46 12 72 72 108 108 33 17 17 12 12 73 12 12 12 12 112 8 8 23 23 17 34 34 30 $2,987,451,029 $405,766,778 $405,766,778 $109,231,174 $36,329,807 $73,821,691 $73,821,691 $186,384,106 $490,545,597 $243,981,454 $243,981,454 $58,212,500 $188,351,643 $825,359,413 $825,359,413 $232,563,260 $367,498,273 $225,297,880 $225,297,880 $778,773,153 $46,970,288 $30,857,600 $30,857,600 $40,974,500 $43,946,276 $142,446,852 $142,446,852 $69,869,792 $144,395,821 $144,395,821 $220,988,836 $220,988,836 $38,323,188 $368,021,026 $368,021,026 $52,267,585 $52,267,585 $8,981,500 $70,402,801 $70,402,801 $91,667,566 $91,667,566 $36,858,875 $16,504,050 $16,504,050 $15,598,900 $15,598,900 $75,739,749 $12,347,500 $12,347,500 $12,347,500 $12,347,500 $106,637,562 $7,938,000 $7,938,000 $25,752,700 $25,752,700 $15,274,175 $29,807,000 $29,807,000 $27,865,687 $1,439,735 $1,531,195 $1,531,195 $1,382,673 $1,100,903 $1,318,244 $1,318,244 $1,921,486 $1,347,653 $1,232,230 $1,232,230 $1,323,011 $1,543,866 $1,712,364 $1,712,364 $1,462,662 $2,417,752 $1,317,531 $1,317,531 $1,667,608 $1,565,676 $1,341,635 $1,341,635 $975,583 $2,441,460 $1,716,227 $1,716,227 $1,318,298 $1,899,945 $1,899,945 $1,905,076 $1,905,076 $1,473,969 $986,652 $986,652 $1,136,252 $1,136,252 $748,458 $977,817 $977,817 $848,774 $848,774 $1,116,936 $970,826 $970,826 $1,299,908 $1,299,908 $1,037,531 $1,028,958 $1,028,958 $1,028,958 $1,028,958 $952,121 $992,250 $992,250 $1,119,683 $1,119,683 $898,481 $876,676 $876,676 $928,856 $1,257,000 $1,355,000 $1,355,000 $1,251,000 $1,065,000 $1,227,500 $1,227,500 $1,738,000 $1,270,000 $1,202,953 $1,202,953 $1,255,000 $1,364,000 $1,346,500 $1,346,500 $1,200,000 $2,035,400 $1,180,800 $1,180,800 $1,533,000 $1,505,500 $1,290,000 $1,290,000 $943,500 $2,169,250 $1,628,888 $1,628,888 $1,286,000 $1,732,500 $1,732,500 $1,672,500 $1,672,500 $1,309,000 $931,900 $931,900 $1,074,500 $1,074,500 $667,500 $880,000 $880,000 $838,750 $838,750 $1,065,000 $800,000 $800,000 $1,215,000 $1,215,000 $999,000 $935,000 $935,000 $935,000 $935,000 $907,500 $835,000 $835,000 $1,115,000 $1,115,000 $803,875 $889,500 $889,500 $836,944 3,646 472 472 128 75 82 82 187 655 328 328 84 243 867 867 264 312 291 291 791 56 57 57 64 41 123 123 66 147 147 179 179 58 552 552 73 73 20 84 84 177 177 51 26 26 21 21 100 30 30 30 30 279 25 25 62 62 25 113 113 54 4,091 539 539 151 92 79 79 217 808 369 369 167 272 920 920 303 392 225 225 954 64 68 68 85 75 137 137 65 160 160 216 216 84 470 470 48 48 35 78 78 141 141 43 26 26 26 26 73 32 32 32 32 368 37 37 59 59 36 165 165 71 99% 98% 98% 97% 97% 99% 99% 98% 97% 97% 97% 94% 97% 100% 100% 99% 98% 103% 103% 101% 101% 99% 99% 99% 92% 106% 106% 101% 102% 102% 100% 100% 101% 101% 101% 102% 102% 96% 99% 99% 102% 102% 101% 96% 96% 101% 101% 102% 99% 99% 99% 99% 97% 97% 97% 97% 97% 98% 97% 97% 98% 21 20 20 25 26 14 14 18 26 26 26 38 23 19 19 21 20 15 15 22 20 23 23 26 62 14 14 21 20 20 22 22 19 16 16 12 12 32 21 21 15 15 15 24 24 20 20 11 27 27 27 27 26 44 44 21 21 30 32 32 16 Toronto Regional Real Estate Board SUMMARY OF EXISTING HOME TRANSACTIONS Detached, February 2023 Market Watch, February 2023 Copyright 2023 Toronto Regional Real Estate Board 7 ALL TRREB AREAS
  • 8. Sales Dollar Volume Average Price Median Price New Listings Active Listings Avg. SP/LP Avg. LDOM Abc Abc Abc Abc Abc Abc Abc Abc Abc Abc Abc Abc Abc Abc Abc Abc Abc Abc Abc Abc Abc Abc Abc Abc Abc Abc Abc Abc Abc Abc Abc Abc Abc Abc Abc Abc Abc Abc Abc Abc All TRREB Areas All TRREB Areas City of Toronto City of Toronto Toronto West Toronto W01 Toronto W02 Toronto W02 Toronto W03 Toronto W03 Toronto W04 Toronto W05 Toronto W06 Toronto W06 Toronto W07 Toronto W07 Toronto W08 Toronto W09 Toronto W10 Toronto W10 Toronto Central Toronto Central Toronto C01 Toronto C02 Toronto C03 Toronto C03 Toronto C04 Toronto C04 Toronto C06 Toronto C07 Toronto C08 Toronto C08 Toronto C09 Toronto C09 Toronto C10 Toronto C11 Toronto C12 Toronto C12 Toronto C13 Toronto C13 Toronto C14 Toronto C15 Toronto East Toronto East Toronto E01 Toronto E01 Toronto E02 Toronto E03 Toronto E04 Toronto E04 Toronto E05 Toronto E05 Toronto E06 Toronto E07 Toronto E08 Toronto E08 Toronto E09 Toronto E09 Toronto E10 Toronto E11 2,075 2,075 482 482 159 8 16 16 21 21 25 14 18 18 10 10 28 10 9 9 152 152 3 7 10 10 20 20 8 29 0 0 5 5 6 10 8 8 14 14 12 20 171 171 8 8 11 32 16 16 14 14 12 9 18 18 24 24 15 12 $2,987,451,029 $2,987,451,029 $825,359,413 $825,359,413 $232,563,260 $14,901,027 $28,893,000 $28,893,000 $21,739,888 $21,739,888 $28,513,195 $14,565,000 $25,088,500 $25,088,500 $17,504,800 $17,504,800 $58,374,000 $13,297,000 $9,686,850 $9,686,850 $367,498,273 $367,498,273 $11,350,000 $28,252,000 $23,815,906 $23,815,906 $52,509,554 $52,509,554 $11,901,875 $50,121,388 $15,116,800 $15,116,800 $12,696,250 $29,246,000 $32,810,000 $32,810,000 $30,619,000 $30,619,000 $30,662,000 $38,397,500 $225,297,880 $225,297,880 $13,250,100 $13,250,100 $18,540,583 $45,361,200 $18,396,886 $18,396,886 $18,603,400 $18,603,400 $18,785,111 $11,074,000 $24,113,800 $24,113,800 $26,015,800 $26,015,800 $19,558,000 $11,599,000 $1,439,735 $1,439,735 $1,712,364 $1,712,364 $1,462,662 $1,862,628 $1,805,813 $1,805,813 $1,035,233 $1,035,233 $1,140,528 $1,040,357 $1,393,806 $1,393,806 $1,750,480 $1,750,480 $2,084,786 $1,329,700 $1,076,317 $1,076,317 $2,417,752 $2,417,752 $3,783,333 $4,036,000 $2,381,591 $2,381,591 $2,625,478 $2,625,478 $1,487,734 $1,728,324 $3,023,360 $3,023,360 $2,116,042 $2,924,600 $4,101,250 $4,101,250 $2,187,071 $2,187,071 $2,555,167 $1,919,875 $1,317,531 $1,317,531 $1,656,263 $1,656,263 $1,685,508 $1,417,538 $1,149,805 $1,149,805 $1,328,814 $1,328,814 $1,565,426 $1,230,444 $1,339,656 $1,339,656 $1,083,992 $1,083,992 $1,303,867 $966,583 $1,257,000 $1,257,000 $1,346,500 $1,346,500 $1,200,000 $2,029,500 $1,585,000 $1,585,000 $1,020,000 $1,020,000 $1,088,000 $1,038,500 $1,191,250 $1,191,250 $1,286,000 $1,286,000 $1,757,500 $1,300,000 $1,100,000 $1,100,000 $2,035,400 $2,035,400 $4,600,000 $1,677,000 $2,077,000 $2,077,000 $2,427,500 $2,427,500 $1,552,500 $1,525,000 $2,628,000 $2,628,000 $2,113,125 $3,193,000 $3,800,000 $3,800,000 $2,250,000 $2,250,000 $2,053,000 $1,744,500 $1,180,800 $1,180,800 $1,750,000 $1,750,000 $1,330,000 $1,360,900 $1,125,000 $1,125,000 $1,308,900 $1,308,900 $1,255,556 $1,215,000 $1,156,400 $1,156,400 $1,097,500 $1,097,500 $1,200,000 $936,500 3,646 3,646 867 867 264 17 32 32 18 18 37 22 34 34 15 15 57 16 16 16 312 312 11 7 29 29 52 52 11 40 2 2 15 15 18 11 32 32 21 21 34 29 291 291 16 16 19 56 36 36 19 19 30 22 31 31 26 26 28 8 4,091 4,091 920 920 303 12 18 18 26 26 46 33 47 47 15 15 60 21 25 25 392 392 13 16 38 38 59 59 18 37 3 3 15 15 14 5 68 68 25 25 54 27 225 225 13 13 16 48 32 32 11 11 22 15 26 26 13 13 24 5 99% 99% 100% 100% 99% 103% 104% 104% 98% 98% 100% 98% 98% 98% 99% 99% 97% 96% 97% 97% 98% 98% 99% 91% 98% 98% 99% 99% 100% 99% 103% 103% 103% 99% 98% 98% 102% 102% 97% 97% 103% 103% 105% 105% 103% 103% 111% 111% 107% 107% 90% 113% 101% 101% 107% 107% 101% 103% 21 21 19 19 21 9 15 15 26 26 22 18 30 30 14 14 21 24 26 26 20 20 5 57 10 10 14 14 30 18 3 3 4 15 26 26 16 16 34 22 15 15 22 22 8 17 23 23 9 9 34 12 8 8 12 12 13 9 Toronto Regional Real Estate Board SUMMARY OF EXISTING HOME TRANSACTIONS Detached, February 2023 Market Watch, February 2023 Copyright 2023 Toronto Regional Real Estate Board 8 City of Toronto Municipal Breakdown
  • 9. Sales Dollar Volume Average Price Median Price New Listings Active Listings Avg. SP/LP Avg. LDOM Abc Abc Abc Abc Abc Abc Abc Abc Abc Abc Abc Abc Abc Abc Abc Abc Abc Abc Abc Abc Abc Abc Abc Abc Abc Abc Abc Abc Abc Abc Abc Abc Abc Abc Abc Abc Abc Abc Abc Abc Abc All TRREB Areas Halton Region Halton Region Burlington Halton Hills Milton Milton Oakville Peel Region Brampton Brampton Caledon Mississauga City of Toronto City of Toronto Toronto West Toronto Central Toronto East Toronto East York Region Aurora East Gwillimbury East Gwillimbury Georgina King Markham Markham Newmarket Richmond Hill Richmond Hill Vaughan Vaughan Stouffville Durham Region Durham Region Ajax Ajax Brock Clarington Clarington Oshawa Oshawa Pickering Scugog Scugog Uxbridge Uxbridge Whitby Dufferin County Dufferin County Orangeville Orangeville Simcoe County Adjala-Tosorontio Adjala-Tosorontio Bradford Bradford Essa Innisfil Innisfil New Tecumseth 399 25 25 7 3 7 7 8 119 72 72 5 42 144 144 45 45 54 54 51 2 3 3 1 0 9 9 7 12 12 15 15 2 47 47 4 4 0 7 7 24 24 6 0 0 1 1 5 5 5 5 5 8 0 0 5 5 1 0 0 2 $426,637,137 $26,171,000 $26,171,000 $6,817,500 $2,632,000 $7,096,000 $7,096,000 $9,625,500 $114,517,524 $65,932,597 $65,932,597 $5,185,200 $43,399,727 $184,374,714 $184,374,714 $48,584,518 $70,598,034 $65,192,162 $65,192,162 $55,421,621 $1,843,888 $3,155,000 $3,155,000 $773,000 $10,929,000 $10,929,000 $5,735,900 $14,068,000 $14,068,000 $16,744,833 $16,744,833 $2,172,000 $36,318,278 $36,318,278 $3,480,555 $3,480,555 $5,398,500 $5,398,500 $16,524,000 $16,524,000 $5,210,323 $932,000 $932,000 $4,772,900 $3,117,500 $3,117,500 $3,117,500 $3,117,500 $6,716,500 $4,661,500 $4,661,500 $560,000 $1,495,000 $1,069,266 $1,046,840 $1,046,840 $973,929 $877,333 $1,013,714 $1,013,714 $1,203,188 $962,332 $915,731 $915,731 $1,037,040 $1,033,327 $1,280,380 $1,280,380 $1,079,656 $1,568,845 $1,207,262 $1,207,262 $1,086,698 $921,944 $1,051,667 $1,051,667 $773,000 $1,214,333 $1,214,333 $819,414 $1,172,333 $1,172,333 $1,116,322 $1,116,322 $1,086,000 $772,729 $772,729 $870,139 $870,139 $771,214 $771,214 $688,500 $688,500 $868,387 $932,000 $932,000 $954,580 $623,500 $623,500 $623,500 $623,500 $839,563 $932,300 $932,300 $560,000 $747,500 $980,000 $1,061,000 $1,061,000 $972,500 $894,000 $985,000 $985,000 $1,196,250 $955,000 $908,500 $908,500 $1,025,000 $989,889 $1,133,000 $1,133,000 $975,000 $1,350,000 $1,140,500 $1,140,500 $1,084,000 $921,944 $1,055,000 $1,055,000 $773,000 $1,232,000 $1,232,000 $800,000 $1,130,000 $1,130,000 $1,088,000 $1,088,000 $1,086,000 $728,000 $728,000 $893,000 $893,000 $860,000 $860,000 $677,000 $677,000 $860,550 $932,000 $932,000 $975,000 $615,000 $615,000 $615,000 $615,000 $872,500 $935,000 $935,000 $560,000 $747,500 587 32 32 10 3 12 12 7 180 108 108 8 64 222 222 81 73 68 68 79 5 6 6 3 0 14 14 8 24 24 17 17 2 61 61 5 5 0 3 3 31 31 10 1 1 2 2 9 3 3 3 3 10 0 0 6 6 3 0 0 1 445 19 19 7 2 7 7 3 130 78 78 5 47 198 198 81 74 43 43 53 3 4 4 2 0 9 9 5 17 17 12 12 1 30 30 4 4 0 2 2 10 10 6 1 1 1 1 6 2 2 2 2 13 0 0 9 9 2 0 0 2 102% 103% 103% 104% 103% 103% 103% 102% 101% 101% 101% 106% 101% 102% 102% 101% 99% 106% 106% 105% 101% 101% 101% 97% 113% 113% 103% 111% 111% 100% 100% 99% 106% 106% 106% 106% 101% 101% 107% 107% 114% 99% 99% 103% 96% 96% 96% 96% 102% 101% 101% 102% 104% 15 9 9 10 4 7 7 13 14 13 13 14 17 19 19 19 30 11 11 14 8 12 12 0 14 14 6 12 12 20 20 23 9 9 11 11 9 9 8 8 7 27 27 18 16 16 16 16 26 26 26 6 36 Toronto Regional Real Estate Board SUMMARY OF EXISTING HOME TRANSACTIONS Semi-Detached, February 2023 Market Watch, February 2023 Copyright 2023 Toronto Regional Real Estate Board 9 ALL TRREB AREAS
  • 10. Sales Dollar Volume Average Price Median Price New Listings Active Listings Avg. SP/LP Avg. LDOM Abc Abc Abc Abc Abc Abc Abc Abc Abc Abc Abc Abc Abc Abc Abc Abc Abc Abc Abc Abc Abc Abc Abc Abc Abc Abc Abc Abc Abc Abc Abc Abc Abc Abc Abc Abc Abc Abc Abc Abc All TRREB Areas All TRREB Areas City of Toronto City of Toronto Toronto West Toronto W01 Toronto W02 Toronto W02 Toronto W03 Toronto W03 Toronto W04 Toronto W05 Toronto W06 Toronto W06 Toronto W07 Toronto W07 Toronto W08 Toronto W09 Toronto W10 Toronto W10 Toronto Central Toronto Central Toronto C01 Toronto C02 Toronto C03 Toronto C03 Toronto C04 Toronto C04 Toronto C06 Toronto C07 Toronto C08 Toronto C08 Toronto C09 Toronto C09 Toronto C10 Toronto C11 Toronto C12 Toronto C12 Toronto C13 Toronto C13 Toronto C14 Toronto C15 Toronto East Toronto East Toronto E01 Toronto E01 Toronto E02 Toronto E03 Toronto E04 Toronto E04 Toronto E05 Toronto E05 Toronto E06 Toronto E07 Toronto E08 Toronto E08 Toronto E09 Toronto E09 Toronto E10 Toronto E11 399 399 144 144 45 3 10 10 8 8 2 18 1 1 0 0 1 2 0 0 45 45 15 5 6 6 5 5 1 1 0 0 1 1 4 3 0 0 2 2 0 2 54 54 14 14 9 14 5 5 0 0 2 3 1 1 0 0 1 5 $426,637,137 $426,637,137 $184,374,714 $184,374,714 $48,584,518 $4,435,000 $13,210,218 $13,210,218 $8,389,900 $8,389,900 $2,030,000 $16,419,400 $1,060,000 $1,060,000 $1,250,000 $1,790,000 $70,598,034 $70,598,034 $26,229,000 $9,747,000 $7,424,000 $7,424,000 $6,375,000 $6,375,000 $948,000 $940,000 $4,500,000 $4,500,000 $5,818,734 $4,404,800 $1,954,000 $1,954,000 $2,257,500 $65,192,162 $65,192,162 $19,751,906 $19,751,906 $12,659,500 $17,431,455 $4,118,000 $4,118,000 $2,061,001 $3,148,800 $935,000 $935,000 $735,000 $4,351,500 $1,069,266 $1,069,266 $1,280,380 $1,280,380 $1,079,656 $1,478,333 $1,321,022 $1,321,022 $1,048,738 $1,048,738 $1,015,000 $912,189 $1,060,000 $1,060,000 $1,250,000 $895,000 $1,568,845 $1,568,845 $1,748,600 $1,949,400 $1,237,333 $1,237,333 $1,275,000 $1,275,000 $948,000 $940,000 $4,500,000 $4,500,000 $1,454,684 $1,468,267 $977,000 $977,000 $1,128,750 $1,207,262 $1,207,262 $1,410,850 $1,410,850 $1,406,611 $1,245,104 $823,600 $823,600 $1,030,501 $1,049,600 $935,000 $935,000 $735,000 $870,300 $980,000 $980,000 $1,133,000 $1,133,000 $975,000 $1,475,000 $1,290,010 $1,290,010 $977,500 $977,500 $1,015,000 $915,000 $1,060,000 $1,060,000 $1,250,000 $895,000 $1,350,000 $1,350,000 $1,635,000 $1,999,000 $972,000 $972,000 $1,275,000 $1,275,000 $948,000 $940,000 $4,500,000 $4,500,000 $1,346,250 $1,555,000 $977,000 $977,000 $1,128,750 $1,140,500 $1,140,500 $1,420,000 $1,420,000 $1,338,000 $1,183,200 $765,000 $765,000 $1,030,501 $1,077,000 $935,000 $935,000 $735,000 $891,500 587 587 222 222 81 8 24 24 14 14 2 27 2 2 0 0 3 1 0 0 73 73 24 9 8 8 6 6 2 6 2 2 2 2 7 1 1 1 1 1 0 4 68 68 21 21 16 20 3 3 0 0 1 1 0 0 1 1 1 4 445 445 198 198 81 10 20 20 17 17 2 23 4 4 1 1 2 0 2 2 74 74 25 15 6 6 3 3 2 8 4 4 2 2 3 0 1 1 1 1 0 4 43 43 14 14 8 12 0 0 0 0 1 3 0 0 1 1 1 3 102% 102% 102% 102% 101% 108% 104% 104% 100% 100% 93% 99% 97% 97% 104% 100% 99% 99% 96% 100% 98% 98% 107% 107% 95% 94% 94% 94% 109% 97% 102% 102% 100% 106% 106% 105% 105% 109% 109% 106% 106% 95% 103% 99% 99% 100% 105% 15 15 19 19 19 6 19 19 15 15 25 23 42 42 3 3 30 30 48 19 25 25 14 14 58 4 17 17 6 45 19 19 18 11 11 13 13 6 7 5 5 28 27 17 17 4 10 Toronto Regional Real Estate Board SUMMARY OF EXISTING HOME TRANSACTIONS Semi-Detached, February 2023 Market Watch, February 2023 Copyright 2023 Toronto Regional Real Estate Board 10 City of Toronto Municipal Breakdown
  • 11. Sales Dollar Volume Average Price Median Price New Listings Active Listings Avg. SP/LP Avg. LDOM Abc Abc Abc Abc Abc Abc Abc Abc Abc Abc Abc Abc Abc Abc Abc Abc Abc Abc Abc Abc Abc Abc Abc Abc Abc Abc Abc Abc Abc Abc Abc Abc Abc Abc Abc Abc Abc Abc Abc Abc Abc All TRREB Areas Halton Region Halton Region Burlington Halton Hills Milton Milton Oakville Peel Region Brampton Brampton Caledon Mississauga City of Toronto City of Toronto Toronto West Toronto Central Toronto East Toronto East York Region Aurora East Gwillimbury East Gwillimbury Georgina King Markham Markham Newmarket Richmond Hill Richmond Hill Vaughan Vaughan Stouffville Durham Region Durham Region Ajax Ajax Brock Clarington Clarington Oshawa Oshawa Pickering Scugog Scugog Uxbridge Uxbridge Whitby Dufferin County Dufferin County Orangeville Orangeville Simcoe County Adjala-Tosorontio Adjala-Tosorontio Bradford Bradford Essa Innisfil Innisfil New Tecumseth 463 96 96 15 8 40 40 33 83 51 51 15 17 57 57 14 29 14 14 134 6 8 8 3 1 34 34 6 29 29 40 40 7 74 74 13 13 1 12 12 7 7 16 1 1 2 2 22 3 3 3 3 16 0 0 4 4 3 3 3 6 $486,308,365 $97,566,687 $97,566,687 $13,479,999 $7,005,000 $36,832,086 $36,832,086 $40,249,602 $76,112,348 $45,466,400 $45,466,400 $13,570,199 $17,075,749 $75,811,063 $75,811,063 $16,681,527 $44,725,747 $14,403,789 $14,403,789 $158,586,355 $6,378,000 $7,835,088 $7,835,088 $2,343,000 $1,460,000 $41,954,364 $41,954,364 $6,346,000 $37,626,888 $37,626,888 $47,069,127 $47,069,127 $7,573,888 $64,508,512 $64,508,512 $12,623,300 $12,623,300 $775,000 $8,799,923 $8,799,923 $5,668,000 $5,668,000 $13,974,689 $810,000 $810,000 $1,871,000 $1,871,000 $19,986,600 $2,239,000 $2,239,000 $2,239,000 $2,239,000 $11,484,400 $3,420,900 $3,420,900 $1,737,500 $2,150,000 $2,150,000 $4,176,000 $1,050,342 $1,016,320 $1,016,320 $898,667 $875,625 $920,802 $920,802 $1,219,685 $917,016 $891,498 $891,498 $904,680 $1,004,456 $1,330,019 $1,330,019 $1,191,538 $1,542,267 $1,028,842 $1,028,842 $1,183,480 $1,063,000 $979,386 $979,386 $781,000 $1,460,000 $1,233,952 $1,233,952 $1,057,667 $1,297,479 $1,297,479 $1,176,728 $1,176,728 $1,081,984 $871,737 $871,737 $971,023 $971,023 $775,000 $733,327 $733,327 $809,714 $809,714 $873,418 $810,000 $810,000 $935,500 $935,500 $908,482 $746,333 $746,333 $746,333 $746,333 $717,775 $855,225 $855,225 $579,167 $716,667 $716,667 $696,000 $968,000 $939,000 $939,000 $898,000 $875,000 $935,000 $935,000 $1,180,000 $916,000 $905,000 $905,000 $925,000 $970,000 $1,150,000 $1,150,000 $1,112,500 $1,282,000 $968,000 $968,000 $1,150,000 $1,029,500 $974,000 $974,000 $795,000 $1,460,000 $1,200,000 $1,200,000 $980,500 $1,300,000 $1,300,000 $1,156,000 $1,156,000 $1,065,000 $879,444 $879,444 $945,000 $945,000 $775,000 $770,250 $770,250 $810,000 $810,000 $893,750 $810,000 $810,000 $935,500 $935,500 $905,000 $749,000 $749,000 $749,000 $749,000 $703,000 $864,000 $864,000 $620,000 $695,000 $695,000 $693,000 654 120 120 17 11 52 52 40 96 65 65 18 13 94 94 30 42 22 22 197 10 8 8 5 1 48 48 10 45 45 56 56 14 108 108 19 19 1 24 24 18 18 16 1 1 3 3 26 7 7 7 7 32 0 0 4 4 6 9 9 13 516 77 77 15 8 23 23 31 76 55 55 11 10 85 85 29 41 15 15 144 4 6 6 3 2 40 40 9 31 31 42 42 7 86 86 18 18 0 17 17 23 23 5 1 1 3 3 19 6 6 6 6 42 0 0 2 2 5 18 18 17 104% 100% 100% 98% 98% 101% 101% 101% 99% 100% 100% 99% 97% 103% 103% 108% 100% 106% 106% 110% 108% 102% 102% 102% 97% 112% 112% 103% 115% 115% 107% 107% 108% 104% 104% 103% 103% 97% 101% 101% 102% 102% 106% 98% 98% 99% 99% 105% 98% 98% 98% 98% 97% 98% 98% 97% 97% 97% 97% 17 17 17 14 13 14 14 23 17 15 15 16 24 17 17 13 18 16 16 15 8 14 14 31 23 12 12 13 9 9 22 22 15 19 19 24 24 13 12 12 32 32 14 16 16 30 30 19 10 10 10 10 31 26 26 35 27 27 33 Toronto Regional Real Estate Board SUMMARY OF EXISTING HOME TRANSACTIONS Att/Row/Townhouse, February 2023 Market Watch, February 2023 Copyright 2023 Toronto Regional Real Estate Board 11 ALL TRREB AREAS
  • 12. Sales Dollar Volume Average Price Median Price New Listings Active Listings Avg. SP/LP Avg. LDOM Abc Abc Abc Abc Abc Abc Abc Abc Abc Abc Abc Abc Abc Abc Abc Abc Abc Abc Abc Abc Abc Abc Abc Abc Abc Abc Abc Abc Abc Abc Abc Abc Abc Abc Abc Abc Abc Abc Abc Abc All TRREB Areas All TRREB Areas City of Toronto City of Toronto Toronto West Toronto W01 Toronto W02 Toronto W02 Toronto W03 Toronto W03 Toronto W04 Toronto W05 Toronto W06 Toronto W06 Toronto W07 Toronto W07 Toronto W08 Toronto W09 Toronto W10 Toronto W10 Toronto Central Toronto Central Toronto C01 Toronto C02 Toronto C03 Toronto C03 Toronto C04 Toronto C04 Toronto C06 Toronto C07 Toronto C08 Toronto C08 Toronto C09 Toronto C09 Toronto C10 Toronto C11 Toronto C12 Toronto C12 Toronto C13 Toronto C13 Toronto C14 Toronto C15 Toronto East Toronto East Toronto E01 Toronto E01 Toronto E02 Toronto E03 Toronto E04 Toronto E04 Toronto E05 Toronto E05 Toronto E06 Toronto E07 Toronto E08 Toronto E08 Toronto E09 Toronto E09 Toronto E10 Toronto E11 463 463 57 57 14 2 2 2 2 2 1 2 2 2 1 1 1 0 1 1 29 29 11 4 0 0 0 0 0 1 4 4 1 1 3 1 0 0 4 4 0 0 14 14 4 4 2 0 5 5 0 0 0 1 0 0 0 0 1 1 $486,308,365 $486,308,365 $75,811,063 $75,811,063 $16,681,527 $2,480,000 $2,951,600 $2,951,600 $1,970,000 $1,970,000 $892,000 $2,225,000 $2,557,927 $2,557,927 $1,300,000 $1,300,000 $1,342,000 $963,000 $963,000 $44,725,747 $44,725,747 $17,034,748 $9,670,000 $1,183,000 $5,240,000 $5,240,000 $2,100,000 $2,100,000 $3,700,000 $1,150,000 $4,647,999 $4,647,999 $14,403,789 $14,403,789 $3,886,489 $3,886,489 $3,150,000 $4,746,500 $4,746,500 $800,800 $900,000 $920,000 $1,050,342 $1,050,342 $1,330,019 $1,330,019 $1,191,538 $1,240,000 $1,475,800 $1,475,800 $985,000 $985,000 $892,000 $1,112,500 $1,278,964 $1,278,964 $1,300,000 $1,300,000 $1,342,000 $963,000 $963,000 $1,542,267 $1,542,267 $1,548,613 $2,417,500 $1,183,000 $1,310,000 $1,310,000 $2,100,000 $2,100,000 $1,233,333 $1,150,000 $1,162,000 $1,162,000 $1,028,842 $1,028,842 $971,622 $971,622 $1,575,000 $949,300 $949,300 $800,800 $900,000 $920,000 $968,000 $968,000 $1,150,000 $1,150,000 $1,112,500 $1,240,000 $1,475,800 $1,475,800 $985,000 $985,000 $892,000 $1,112,500 $1,278,964 $1,278,964 $1,300,000 $1,300,000 $1,342,000 $963,000 $963,000 $1,282,000 $1,282,000 $1,282,000 $2,300,000 $1,183,000 $1,200,000 $1,200,000 $2,100,000 $2,100,000 $1,100,000 $1,150,000 $1,223,000 $1,223,000 $968,000 $968,000 $1,040,000 $1,040,000 $1,575,000 $991,000 $991,000 $800,800 $900,000 $920,000 654 654 94 94 30 2 7 7 0 0 1 2 7 7 2 2 4 2 3 3 42 42 15 6 0 0 1 1 0 0 10 10 2 2 1 2 0 0 5 5 0 0 22 22 6 6 5 0 5 5 1 1 0 1 0 0 0 0 2 2 516 516 85 85 29 1 8 8 0 0 1 4 4 4 2 2 4 2 3 3 41 41 14 4 3 3 1 1 1 2 13 13 1 1 0 0 0 0 1 1 1 0 15 15 5 5 2 0 2 2 1 1 0 0 0 0 0 0 2 3 104% 104% 103% 103% 108% 106% 128% 128% 107% 107% 112% 102% 109% 109% 98% 98% 96% 98% 98% 100% 100% 102% 96% 99% 100% 100% 105% 105% 98% 97% 103% 103% 106% 106% 104% 104% 105% 108% 108% 115% 100% 115% 17 17 17 17 13 11 7 7 10 10 7 23 10 10 17 17 29 14 14 18 18 12 25 70 30 30 4 4 12 17 14 14 16 16 28 28 7 15 15 7 11 8 Toronto Regional Real Estate Board SUMMARY OF EXISTING HOME TRANSACTIONS Att/Row/Townhouse, February 2023 Market Watch, February 2023 Copyright 2023 Toronto Regional Real Estate Board 12 City of Toronto Municipal Breakdown
  • 13. Sales Dollar Volume Average Price Median Price New Listings Active Listings Avg. SP/LP Avg. LDOM Abc Abc Abc Abc Abc Abc Abc Abc Abc Abc Abc Abc Abc Abc Abc Abc Abc Abc Abc Abc Abc Abc Abc Abc Abc Abc Abc Abc Abc Abc Abc Abc Abc Abc Abc Abc Abc Abc Abc Abc Abc All TRREB Areas Halton Region Halton Region Burlington Halton Hills Milton Milton Oakville Peel Region Brampton Brampton Caledon Mississauga City of Toronto City of Toronto Toronto West Toronto Central Toronto East Toronto East York Region Aurora East Gwillimbury East Gwillimbury Georgina King Markham Markham Newmarket Richmond Hill Richmond Hill Vaughan Vaughan Stouffville Durham Region Durham Region Ajax Ajax Brock Clarington Clarington Oshawa Oshawa Pickering Scugog Scugog Uxbridge Uxbridge Whitby Dufferin County Dufferin County Orangeville Orangeville Simcoe County Adjala-Tosorontio Adjala-Tosorontio Bradford Bradford Essa Innisfil Innisfil New Tecumseth 358 51 51 31 1 7 7 12 98 29 29 0 69 104 104 41 32 31 31 52 10 0 0 1 0 22 22 5 6 6 6 6 2 48 48 6 6 1 6 6 15 15 16 0 0 0 0 4 1 1 1 1 4 0 0 1 1 0 0 0 3 $281,190,457 $38,368,316 $38,368,316 $22,806,317 $650,000 $5,220,000 $5,220,000 $9,691,999 $75,380,006 $19,953,901 $19,953,901 $55,426,105 $86,049,058 $86,049,058 $31,234,500 $31,643,600 $23,170,958 $23,170,958 $45,922,420 $7,766,280 $495,000 $20,849,799 $20,849,799 $3,934,000 $5,577,791 $5,577,791 $5,869,550 $5,869,550 $1,430,000 $32,244,657 $32,244,657 $4,267,275 $4,267,275 $625,000 $4,531,322 $4,531,322 $9,203,640 $9,203,640 $10,958,420 $2,659,000 $600,000 $600,000 $600,000 $600,000 $2,626,000 $680,000 $680,000 $1,946,000 $785,448 $752,320 $752,320 $735,688 $650,000 $745,714 $745,714 $807,667 $769,184 $688,066 $688,066 $803,277 $827,395 $827,395 $761,817 $988,863 $747,450 $747,450 $883,123 $776,628 $495,000 $947,718 $947,718 $786,800 $929,632 $929,632 $978,258 $978,258 $715,000 $671,764 $671,764 $711,213 $711,213 $625,000 $755,220 $755,220 $613,576 $613,576 $684,901 $664,750 $600,000 $600,000 $600,000 $600,000 $656,500 $680,000 $680,000 $648,667 $752,000 $720,000 $720,000 $699,000 $650,000 $720,000 $720,000 $760,500 $761,500 $705,000 $705,000 $783,000 $777,500 $777,500 $725,000 $949,000 $750,000 $750,000 $817,000 $776,990 $495,000 $956,500 $956,500 $795,000 $868,950 $868,950 $928,275 $928,275 $715,000 $651,000 $651,000 $707,638 $707,638 $625,000 $653,500 $653,500 $610,000 $610,000 $672,500 $663,500 $600,000 $600,000 $600,000 $600,000 $640,000 $680,000 $680,000 $600,000 621 79 79 46 1 7 7 25 164 47 47 1 116 200 200 67 75 58 58 106 10 0 0 3 1 30 30 10 15 15 32 32 5 68 68 11 11 2 6 6 22 22 20 0 0 2 2 5 0 0 0 0 4 0 0 0 0 0 1 1 3 656 73 73 38 2 5 5 28 177 57 57 1 119 236 236 90 83 63 63 107 6 0 0 4 2 25 25 7 22 22 37 37 4 55 55 7 7 1 4 4 17 17 18 0 0 2 2 6 0 0 0 0 8 0 0 0 0 0 6 6 2 101% 99% 99% 99% 96% 99% 99% 100% 99% 99% 99% 99% 103% 103% 101% 104% 103% 103% 103% 100% 103% 104% 104% 106% 107% 107% 96% 96% 108% 101% 101% 106% 106% 104% 98% 98% 101% 101% 101% 105% 98% 98% 98% 98% 97% 97% 97% 97% 22 24 24 25 27 12 12 29 21 23 23 21 24 24 33 16 21 21 19 27 22 19 19 27 15 15 10 10 5 15 15 8 8 11 21 21 17 17 13 22 75 75 75 75 24 41 41 19 Toronto Regional Real Estate Board SUMMARY OF EXISTING HOME TRANSACTIONS Condo Townhouse, February 2023 Market Watch, February 2023 Copyright 2023 Toronto Regional Real Estate Board 13 ALL TRREB AREAS
  • 14. Sales Dollar Volume Average Price Median Price New Listings Active Listings Avg. SP/LP Avg. LDOM Abc Abc Abc Abc Abc Abc Abc Abc Abc Abc Abc Abc Abc Abc Abc Abc Abc Abc Abc Abc Abc Abc Abc Abc Abc Abc Abc Abc Abc Abc Abc Abc Abc Abc Abc Abc Abc Abc Abc Abc All TRREB Areas All TRREB Areas City of Toronto City of Toronto Toronto West Toronto W01 Toronto W02 Toronto W02 Toronto W03 Toronto W03 Toronto W04 Toronto W05 Toronto W06 Toronto W06 Toronto W07 Toronto W07 Toronto W08 Toronto W09 Toronto W10 Toronto W10 Toronto Central Toronto Central Toronto C01 Toronto C02 Toronto C03 Toronto C03 Toronto C04 Toronto C04 Toronto C06 Toronto C07 Toronto C08 Toronto C08 Toronto C09 Toronto C09 Toronto C10 Toronto C11 Toronto C12 Toronto C12 Toronto C13 Toronto C13 Toronto C14 Toronto C15 Toronto East Toronto East Toronto E01 Toronto E01 Toronto E02 Toronto E03 Toronto E04 Toronto E04 Toronto E05 Toronto E05 Toronto E06 Toronto E07 Toronto E08 Toronto E08 Toronto E09 Toronto E09 Toronto E10 Toronto E11 358 358 104 104 41 2 7 7 2 2 3 10 6 6 0 0 5 2 4 4 32 32 10 0 0 0 0 0 0 0 1 1 0 0 1 2 3 3 0 0 5 10 31 31 4 4 2 0 3 3 3 3 1 4 0 0 6 6 2 6 $281,190,457 $281,190,457 $86,049,058 $86,049,058 $31,234,500 $2,409,500 $6,190,000 $6,190,000 $1,170,000 $1,170,000 $1,936,500 $6,313,500 $5,356,000 $5,356,000 $3,653,000 $1,590,000 $2,616,000 $2,616,000 $31,643,600 $31,643,600 $8,981,100 $715,000 $715,000 $1,368,000 $2,130,000 $3,837,500 $3,837,500 $4,799,000 $9,813,000 $23,170,958 $23,170,958 $3,347,058 $3,347,058 $1,415,000 $2,615,000 $2,615,000 $2,248,000 $2,248,000 $860,000 $3,236,000 $3,981,000 $3,981,000 $1,389,900 $4,079,000 $785,448 $785,448 $827,395 $827,395 $761,817 $1,204,750 $884,286 $884,286 $585,000 $585,000 $645,500 $631,350 $892,667 $892,667 $730,600 $795,000 $654,000 $654,000 $988,863 $988,863 $898,110 $715,000 $715,000 $1,368,000 $1,065,000 $1,279,167 $1,279,167 $959,800 $981,300 $747,450 $747,450 $836,765 $836,765 $707,500 $871,667 $871,667 $749,333 $749,333 $860,000 $809,000 $663,500 $663,500 $694,950 $679,833 $752,000 $752,000 $777,500 $777,500 $725,000 $1,204,750 $900,000 $900,000 $585,000 $585,000 $650,000 $668,250 $900,500 $900,500 $713,000 $795,000 $641,500 $641,500 $949,000 $949,000 $860,000 $715,000 $715,000 $1,368,000 $1,065,000 $1,230,000 $1,230,000 $1,029,000 $895,000 $750,000 $750,000 $793,529 $793,529 $707,500 $865,000 $865,000 $760,000 $760,000 $860,000 $800,500 $700,000 $700,000 $694,950 $670,000 621 621 200 200 67 2 7 7 3 3 16 15 7 7 0 0 8 1 8 8 75 75 22 6 0 0 3 3 0 3 4 4 0 0 3 1 2 2 1 1 9 21 58 58 5 5 3 2 3 3 13 13 1 5 3 3 6 6 8 9 656 656 236 236 90 5 4 4 2 2 22 23 9 9 0 0 14 0 11 11 83 83 11 10 0 0 6 6 4 7 6 6 1 1 3 1 3 3 2 2 11 18 63 63 3 3 2 1 6 6 9 9 2 5 7 7 6 6 10 12 101% 101% 103% 103% 101% 101% 102% 102% 107% 107% 104% 100% 100% 100% 98% 98% 99% 99% 104% 104% 104% 119% 119% 106% 97% 104% 104% 100% 106% 103% 103% 100% 100% 101% 107% 107% 111% 111% 93% 105% 103% 103% 100% 103% 22 22 24 24 33 81 18 18 9 9 17 48 27 27 48 37 13 13 16 16 13 7 7 3 14 13 13 23 20 21 21 33 33 9 21 21 12 12 16 22 11 11 27 31 Toronto Regional Real Estate Board SUMMARY OF EXISTING HOME TRANSACTIONS Condo Townhouse, February 2023 Market Watch, February 2023 Copyright 2023 Toronto Regional Real Estate Board 14 City of Toronto Municipal Breakdown
  • 15. Sales Dollar Volume Average Price Median Price New Listings Active Listings Avg. SP/LP Avg. LDOM Abc Abc Abc Abc Abc Abc Abc Abc Abc Abc Abc Abc Abc Abc Abc Abc Abc Abc Abc Abc Abc Abc Abc Abc Abc Abc Abc Abc Abc Abc Abc Abc Abc Abc Abc Abc Abc Abc Abc Abc Abc All TRREB Areas Halton Region Halton Region Burlington Halton Hills Milton Milton Oakville Peel Region Brampton Brampton Caledon Mississauga City of Toronto City of Toronto Toronto West Toronto Central Toronto East Toronto East York Region Aurora East Gwillimbury East Gwillimbury Georgina King Markham Markham Newmarket Richmond Hill Richmond Hill Vaughan Vaughan Stouffville Durham Region Durham Region Ajax Ajax Brock Clarington Clarington Oshawa Oshawa Pickering Scugog Scugog Uxbridge Uxbridge Whitby Dufferin County Dufferin County Orangeville Orangeville Simcoe County Adjala-Tosorontio Adjala-Tosorontio Bradford Bradford Essa Innisfil Innisfil New Tecumseth 1,455 84 84 41 1 16 16 26 161 31 31 1 129 952 952 209 620 123 123 193 7 0 0 1 3 61 61 4 41 41 76 76 0 56 56 7 7 0 8 8 14 14 20 2 2 0 0 5 5 5 5 5 4 0 0 0 0 0 4 4 0 $1,026,461,979 $70,451,040 $70,451,040 $29,718,840 $605,000 $9,994,500 $9,994,500 $30,132,700 $96,311,154 $16,654,806 $16,654,806 $679,900 $78,976,448 $693,313,593 $693,313,593 $134,995,887 $488,223,442 $70,094,264 $70,094,264 $130,579,990 $4,334,000 $388,000 $2,515,000 $43,153,188 $43,153,188 $2,227,000 $26,920,002 $26,920,002 $51,042,800 $51,042,800 $30,105,202 $30,105,202 $3,976,614 $3,976,614 $4,086,000 $4,086,000 $5,798,500 $5,798,500 $11,745,700 $1,305,000 $1,305,000 $3,193,388 $2,829,000 $2,829,000 $2,829,000 $2,829,000 $2,872,000 $2,872,000 $2,872,000 $705,472 $838,703 $838,703 $724,850 $605,000 $624,656 $624,656 $1,158,950 $598,206 $537,252 $537,252 $679,900 $612,221 $728,271 $728,271 $645,913 $787,457 $569,872 $569,872 $676,580 $619,143 $388,000 $838,333 $707,429 $707,429 $556,750 $656,585 $656,585 $671,616 $671,616 $537,593 $537,593 $568,088 $568,088 $510,750 $510,750 $414,179 $414,179 $587,285 $652,500 $652,500 $638,678 $565,800 $565,800 $565,800 $565,800 $718,000 $718,000 $718,000 $630,000 $637,500 $637,500 $604,600 $605,000 $601,000 $601,000 $767,500 $580,000 $536,500 $536,500 $679,900 $587,500 $648,000 $648,000 $603,000 $683,500 $555,000 $555,000 $640,000 $600,000 $388,000 $920,000 $678,800 $678,800 $553,500 $630,000 $630,000 $634,450 $634,450 $547,500 $547,500 $520,000 $520,000 $510,550 $510,550 $430,000 $430,000 $580,000 $652,500 $652,500 $579,500 $529,000 $529,000 $529,000 $529,000 $670,000 $670,000 $670,000 2,797 158 158 63 2 19 19 74 303 59 59 2 242 1,912 1,912 418 1,285 209 209 307 8 0 0 2 4 86 86 9 58 58 131 131 9 99 99 6 6 0 27 27 32 32 16 0 0 2 2 16 7 7 7 7 11 0 0 3 3 0 6 6 2 3,864 269 269 125 3 23 23 118 394 73 73 2 319 2,640 2,640 533 1,806 301 301 395 9 0 0 3 4 92 92 14 81 81 174 174 18 128 128 5 5 0 32 32 51 51 24 0 0 2 2 14 7 7 7 7 31 0 0 2 2 0 20 20 9 98% 98% 98% 98% 96% 98% 98% 97% 98% 99% 99% 97% 98% 98% 98% 98% 98% 99% 99% 98% 95% 97% 95% 99% 99% 96% 99% 99% 98% 98% 99% 99% 102% 102% 100% 100% 100% 100% 98% 95% 95% 97% 99% 99% 99% 99% 96% 96% 96% 27 31 31 33 29 22 22 35 30 39 39 33 28 27 27 28 26 29 29 25 21 20 15 24 24 69 26 26 24 24 24 24 13 13 24 24 28 28 24 49 49 24 16 16 16 16 48 48 48 Toronto Regional Real Estate Board SUMMARY OF EXISTING HOME TRANSACTIONS Condo Apartment, February 2023 Market Watch, February 2023 Copyright 2023 Toronto Regional Real Estate Board 15 ALL TRREB AREAS
  • 16. Sales Dollar Volume Average Price Median Price New Listings Active Listings Avg. SP/LP Avg. LDOM Abc Abc Abc Abc Abc Abc Abc Abc Abc Abc Abc Abc Abc Abc Abc Abc Abc Abc Abc Abc Abc Abc Abc Abc Abc Abc Abc Abc Abc Abc Abc Abc Abc Abc Abc Abc Abc Abc Abc Abc All TRREB Areas All TRREB Areas City of Toronto City of Toronto Toronto West Toronto W01 Toronto W02 Toronto W02 Toronto W03 Toronto W03 Toronto W04 Toronto W05 Toronto W06 Toronto W06 Toronto W07 Toronto W07 Toronto W08 Toronto W09 Toronto W10 Toronto W10 Toronto Central Toronto Central Toronto C01 Toronto C02 Toronto C03 Toronto C03 Toronto C04 Toronto C04 Toronto C06 Toronto C07 Toronto C08 Toronto C08 Toronto C09 Toronto C09 Toronto C10 Toronto C11 Toronto C12 Toronto C12 Toronto C13 Toronto C13 Toronto C14 Toronto C15 Toronto East Toronto East Toronto E01 Toronto E01 Toronto E02 Toronto E03 Toronto E04 Toronto E04 Toronto E05 Toronto E05 Toronto E06 Toronto E07 Toronto E08 Toronto E08 Toronto E09 Toronto E09 Toronto E10 Toronto E11 1,455 1,455 952 952 209 22 10 10 6 6 22 20 60 60 3 3 40 9 17 17 620 620 218 38 12 12 8 8 10 33 124 124 8 8 34 9 7 7 20 20 49 50 123 123 11 11 4 11 11 11 15 15 2 23 14 14 15 15 3 14 $1,026,461,979 $1,026,461,979 $693,313,593 $693,313,593 $134,995,887 $16,810,500 $6,566,900 $6,566,900 $2,950,000 $2,950,000 $11,835,300 $10,366,000 $45,762,387 $45,762,387 $1,870,000 $1,870,000 $26,240,800 $3,915,500 $8,678,500 $8,678,500 $488,223,442 $488,223,442 $174,551,265 $45,462,706 $8,101,700 $8,101,700 $8,694,500 $8,694,500 $5,881,000 $22,662,300 $91,220,506 $91,220,506 $9,827,000 $9,827,000 $23,996,913 $5,519,000 $7,086,000 $7,086,000 $14,158,700 $14,158,700 $35,778,764 $35,283,088 $70,094,264 $70,094,264 $7,538,000 $7,538,000 $3,653,200 $5,242,789 $5,956,000 $5,956,000 $9,493,600 $9,493,600 $1,200,000 $12,792,387 $7,326,000 $7,326,000 $8,292,000 $8,292,000 $1,582,000 $7,018,288 $705,472 $705,472 $728,271 $728,271 $645,913 $764,114 $656,690 $656,690 $491,667 $491,667 $537,968 $518,300 $762,706 $762,706 $623,333 $623,333 $656,020 $435,056 $510,500 $510,500 $787,457 $787,457 $800,694 $1,196,387 $675,142 $675,142 $1,086,813 $1,086,813 $588,100 $686,736 $735,649 $735,649 $1,228,375 $1,228,375 $705,792 $613,222 $1,012,286 $1,012,286 $707,935 $707,935 $730,179 $705,662 $569,872 $569,872 $685,273 $685,273 $913,300 $476,617 $541,455 $541,455 $632,907 $632,907 $600,000 $556,191 $523,286 $523,286 $552,800 $552,800 $527,333 $501,306 $630,000 $630,000 $648,000 $648,000 $603,000 $692,500 $642,000 $642,000 $507,500 $507,500 $560,500 $535,000 $665,000 $665,000 $630,000 $630,000 $630,000 $438,000 $525,000 $525,000 $683,500 $683,500 $679,000 $940,000 $595,000 $595,000 $672,500 $672,500 $571,000 $677,000 $676,500 $676,500 $1,014,500 $1,014,500 $662,500 $601,000 $950,000 $950,000 $683,850 $683,850 $738,000 $642,000 $555,000 $555,000 $630,000 $630,000 $901,600 $465,000 $545,000 $545,000 $628,800 $628,800 $600,000 $550,000 $523,500 $523,500 $555,000 $555,000 $506,000 $492,450 2,797 2,797 1,912 1,912 418 46 24 24 10 10 33 44 108 108 9 9 101 19 24 24 1,285 1,285 460 78 29 29 15 15 29 63 281 281 16 16 65 31 10 10 38 38 82 88 209 209 17 17 12 11 38 38 28 28 10 33 22 22 24 24 5 9 3,864 3,864 2,640 2,640 533 51 31 31 7 7 47 61 130 130 9 9 134 30 33 33 1,806 1,806 671 131 28 28 38 38 32 73 392 392 17 17 103 34 8 8 46 46 106 127 301 301 24 24 31 15 45 45 36 36 17 39 35 35 39 39 9 11 98% 98% 98% 98% 98% 98% 98% 98% 97% 97% 97% 97% 98% 98% 100% 100% 99% 96% 100% 100% 98% 98% 98% 97% 97% 97% 96% 96% 99% 100% 99% 99% 97% 97% 98% 99% 98% 98% 101% 101% 99% 99% 99% 99% 99% 99% 105% 97% 102% 102% 99% 99% 98% 101% 97% 97% 98% 98% 98% 98% 27 27 27 27 28 24 33 33 30 30 30 30 20 20 8 8 32 44 32 32 26 26 29 25 14 14 22 22 17 24 27 27 20 20 25 25 23 23 14 14 30 27 29 29 17 17 15 38 23 23 21 21 12 30 30 30 30 30 84 37 Toronto Regional Real Estate Board SUMMARY OF EXISTING HOME TRANSACTIONS Condo Apartment, February 2023 Market Watch, February 2023 Copyright 2023 Toronto Regional Real Estate Board 16 City of Toronto Municipal Breakdown
  • 17. Sales Dollar Volume Average Price Median Price New Listings Active Listings Avg. SP/LP Avg. LDOM Abc Abc Abc Abc Abc Abc Abc Abc Abc Abc Abc Abc Abc Abc Abc Abc Abc Abc Abc Abc Abc Abc Abc Abc Abc Abc Abc Abc Abc Abc Abc Abc Abc Abc Abc Abc Abc Abc Abc Abc Abc All TRREB Areas Halton Region Halton Region Burlington Halton Hills Milton Milton Oakville Peel Region Brampton Brampton Caledon Mississauga City of Toronto City of Toronto Toronto West Toronto Central Toronto East Toronto East York Region Aurora East Gwillimbury East Gwillimbury Georgina King Markham Markham Newmarket Richmond Hill Richmond Hill Vaughan Vaughan Stouffville Durham Region Durham Region Ajax Ajax Brock Clarington Clarington Oshawa Oshawa Pickering Scugog Scugog Uxbridge Uxbridge Whitby Dufferin County Dufferin County Orangeville Orangeville Simcoe County Adjala-Tosorontio Adjala-Tosorontio Bradford Bradford Essa Innisfil Innisfil New Tecumseth 24 3 3 2 0 0 0 1 5 1 1 2 2 2 2 0 2 0 0 11 0 0 0 0 1 7 7 0 2 2 1 1 0 3 3 1 1 0 1 1 0 0 0 0 0 0 0 1 0 0 0 0 0 0 0 0 0 0 0 0 0 $26,854,772 $2,916,000 $2,916,000 $2,004,000 $912,000 $4,895,000 $780,000 $780,000 $1,690,000 $2,425,000 $2,245,000 $2,245,000 $2,245,000 $14,039,107 $1,435,000 $8,798,400 $8,798,400 $2,580,000 $2,580,000 $1,225,707 $1,225,707 $2,759,665 $2,759,665 $917,777 $917,777 $880,888 $880,888 $961,000 $1,118,949 $972,000 $972,000 $1,002,000 $912,000 $979,000 $780,000 $780,000 $845,000 $1,212,500 $1,122,500 $1,122,500 $1,122,500 $1,276,282 $1,435,000 $1,256,914 $1,256,914 $1,290,000 $1,290,000 $1,225,707 $1,225,707 $919,888 $919,888 $917,777 $917,777 $880,888 $880,888 $961,000 $1,125,000 $995,000 $995,000 $1,002,000 $912,000 $860,000 $780,000 $780,000 $845,000 $1,212,500 $1,122,500 $1,122,500 $1,122,500 $1,300,000 $1,435,000 $1,300,000 $1,300,000 $1,290,000 $1,290,000 $1,225,707 $1,225,707 $917,777 $917,777 $917,777 $917,777 $880,888 $880,888 $961,000 36 7 7 5 0 0 0 2 3 2 2 0 1 3 3 0 3 0 0 14 0 0 0 0 1 10 10 0 2 2 1 1 0 7 7 1 1 0 4 4 1 1 0 0 0 0 0 1 1 1 1 1 1 0 0 0 0 0 0 0 1 24 4 4 2 0 0 0 2 1 1 1 0 0 3 3 0 3 0 0 9 0 0 0 0 1 5 5 0 3 3 0 0 0 5 5 0 0 0 3 3 1 1 1 0 0 0 0 0 1 1 1 1 1 0 0 0 0 0 0 0 1 106% 103% 103% 102% 106% 105% 111% 111% 97% 110% 99% 99% 99% 106% 90% 111% 111% 97% 97% 123% 123% 110% 110% 108% 108% 110% 110% 113% 13 11 11 2 28 20 4 4 25 24 15 15 15 13 19 12 12 21 21 5 5 3 3 4 4 0 0 4 Toronto Regional Real Estate Board SUMMARY OF EXISTING HOME TRANSACTIONS Link, February 2023 Market Watch, February 2023 Copyright 2023 Toronto Regional Real Estate Board 17 ALL TRREB AREAS
  • 18. Sales Dollar Volume Average Price Median Price New Listings Active Listings Avg. SP/LP Avg. LDOM Abc Abc Abc Abc Abc Abc Abc Abc Abc Abc Abc Abc Abc Abc Abc Abc Abc Abc Abc Abc Abc Abc Abc Abc Abc Abc Abc Abc Abc Abc Abc Abc Abc Abc Abc Abc Abc Abc Abc Abc All TRREB Areas All TRREB Areas City of Toronto City of Toronto Toronto West Toronto W01 Toronto W02 Toronto W02 Toronto W03 Toronto W03 Toronto W04 Toronto W05 Toronto W06 Toronto W06 Toronto W07 Toronto W07 Toronto W08 Toronto W09 Toronto W10 Toronto W10 Toronto Central Toronto Central Toronto C01 Toronto C02 Toronto C03 Toronto C03 Toronto C04 Toronto C04 Toronto C06 Toronto C07 Toronto C08 Toronto C08 Toronto C09 Toronto C09 Toronto C10 Toronto C11 Toronto C12 Toronto C12 Toronto C13 Toronto C13 Toronto C14 Toronto C15 Toronto East Toronto East Toronto E01 Toronto E01 Toronto E02 Toronto E03 Toronto E04 Toronto E04 Toronto E05 Toronto E05 Toronto E06 Toronto E07 Toronto E08 Toronto E08 Toronto E09 Toronto E09 Toronto E10 Toronto E11 24 24 2 2 0 0 0 0 0 0 0 0 0 0 0 0 0 0 0 0 2 2 0 0 0 0 0 0 0 0 0 0 0 0 0 0 0 0 0 0 0 2 0 0 0 0 0 0 0 0 0 0 0 0 0 0 0 0 0 0 $26,854,772 $26,854,772 $2,245,000 $2,245,000 $2,245,000 $2,245,000 $2,245,000 $1,118,949 $1,118,949 $1,122,500 $1,122,500 $1,122,500 $1,122,500 $1,122,500 $1,125,000 $1,125,000 $1,122,500 $1,122,500 $1,122,500 $1,122,500 $1,122,500 36 36 3 3 0 0 0 0 0 0 0 0 0 0 0 0 0 0 0 0 3 3 0 0 0 0 0 0 0 0 0 0 0 0 0 0 0 0 0 0 0 3 0 0 0 0 0 0 0 0 0 0 0 0 0 0 0 0 0 0 24 24 3 3 0 0 0 0 0 0 0 0 0 0 0 0 0 0 0 0 3 3 0 0 0 0 0 0 0 1 0 0 0 0 0 0 0 0 0 0 0 2 0 0 0 0 0 0 0 0 0 0 0 0 0 0 0 0 0 0 106% 106% 99% 99% 99% 99% 99% 13 13 15 15 15 15 15 Toronto Regional Real Estate Board SUMMARY OF EXISTING HOME TRANSACTIONS Link, February 2023 Market Watch, February 2023 Copyright 2023 Toronto Regional Real Estate Board 18 City of Toronto Municipal Breakdown
  • 19. Sales Dollar Volume Average Price Median Price New Listings Active Listings Avg. SP/LP Avg. LDOM Abc Abc Abc Abc Abc Abc Abc Abc Abc Abc Abc Abc Abc Abc Abc Abc Abc Abc Abc Abc Abc Abc Abc Abc Abc Abc Abc Abc Abc Abc Abc Abc Abc Abc Abc Abc Abc Abc Abc Abc Abc All TRREB Areas Halton Region Halton Region Burlington Halton Hills Milton Milton Oakville Peel Region Brampton Brampton Caledon Mississauga City of Toronto City of Toronto Toronto West Toronto Central Toronto East Toronto East York Region Aurora East Gwillimbury East Gwillimbury Georgina King Markham Markham Newmarket Richmond Hill Richmond Hill Vaughan Vaughan Stouffville Durham Region Durham Region Ajax Ajax Brock Clarington Clarington Oshawa Oshawa Pickering Scugog Scugog Uxbridge Uxbridge Whitby Dufferin County Dufferin County Orangeville Orangeville Simcoe County Adjala-Tosorontio Adjala-Tosorontio Bradford Bradford Essa Innisfil Innisfil New Tecumseth 4 1 1 1 0 0 0 0 1 0 0 0 1 1 1 1 0 0 0 1 0 0 0 0 0 0 0 0 1 1 0 0 0 0 0 0 0 0 0 0 0 0 0 0 0 0 0 0 0 0 0 0 0 0 0 0 0 0 0 0 0 $1,905,888 $360,000 $360,000 $360,000 $370,000 $370,000 $382,000 $382,000 $382,000 $793,888 $793,888 $793,888 $476,472 $360,000 $360,000 $360,000 $370,000 $370,000 $382,000 $382,000 $382,000 $793,888 $793,888 $793,888 $376,000 $360,000 $360,000 $360,000 $370,000 $370,000 $382,000 $382,000 $382,000 $793,888 $793,888 $793,888 9 1 1 1 0 0 0 0 0 0 0 0 0 8 8 2 3 3 3 0 0 0 0 0 0 0 0 0 0 0 0 0 0 0 0 0 0 0 0 0 0 0 0 0 0 0 0 0 0 0 0 0 0 0 0 0 0 0 0 0 0 22 1 1 1 0 0 0 0 0 0 0 0 0 18 18 9 5 4 4 1 0 0 0 0 0 0 0 0 0 0 1 1 0 2 2 1 1 0 0 0 1 1 0 0 0 0 0 0 0 0 0 0 0 0 0 0 0 0 0 0 0 97% 92% 92% 92% 96% 96% 99% 99% 99% 98% 98% 98% 24 12 12 12 55 55 7 7 7 23 23 23 Toronto Regional Real Estate Board SUMMARY OF EXISTING HOME TRANSACTIONS Co-Op Apartment, February 2023 Market Watch, February 2023 Copyright 2023 Toronto Regional Real Estate Board 19 ALL TRREB AREAS
  • 20. Sales Dollar Volume Average Price Median Price New Listings Active Listings Avg. SP/LP Avg. LDOM Abc Abc Abc Abc Abc Abc Abc Abc Abc Abc Abc Abc Abc Abc Abc Abc Abc Abc Abc Abc Abc Abc Abc Abc Abc Abc Abc Abc Abc Abc Abc Abc Abc Abc Abc Abc Abc Abc Abc Abc All TRREB Areas All TRREB Areas City of Toronto City of Toronto Toronto West Toronto W01 Toronto W02 Toronto W02 Toronto W03 Toronto W03 Toronto W04 Toronto W05 Toronto W06 Toronto W06 Toronto W07 Toronto W07 Toronto W08 Toronto W09 Toronto W10 Toronto W10 Toronto Central Toronto Central Toronto C01 Toronto C02 Toronto C03 Toronto C03 Toronto C04 Toronto C04 Toronto C06 Toronto C07 Toronto C08 Toronto C08 Toronto C09 Toronto C09 Toronto C10 Toronto C11 Toronto C12 Toronto C12 Toronto C13 Toronto C13 Toronto C14 Toronto C15 Toronto East Toronto East Toronto E01 Toronto E01 Toronto E02 Toronto E03 Toronto E04 Toronto E04 Toronto E05 Toronto E05 Toronto E06 Toronto E07 Toronto E08 Toronto E08 Toronto E09 Toronto E09 Toronto E10 Toronto E11 4 4 1 1 1 0 1 1 0 0 0 0 0 0 0 0 0 0 0 0 0 0 0 0 0 0 0 0 0 0 0 0 0 0 0 0 0 0 0 0 0 0 0 0 0 0 0 0 0 0 0 0 0 0 0 0 0 0 0 0 $1,905,888 $1,905,888 $382,000 $382,000 $382,000 $382,000 $382,000 $476,472 $476,472 $382,000 $382,000 $382,000 $382,000 $382,000 $376,000 $376,000 $382,000 $382,000 $382,000 $382,000 $382,000 9 9 8 8 2 0 0 0 0 0 0 0 1 1 0 0 1 0 0 0 3 3 0 0 0 0 1 1 0 0 0 0 2 2 0 0 0 0 0 0 0 0 3 3 0 0 1 0 0 0 0 0 0 0 0 0 0 0 2 0 22 22 18 18 9 0 0 0 0 0 0 0 6 6 0 0 3 0 0 0 5 5 0 0 0 0 1 1 0 0 0 0 4 4 0 0 0 0 0 0 0 0 4 4 0 0 1 0 0 0 0 0 0 0 0 0 0 0 3 0 97% 97% 99% 99% 99% 99% 99% 24 24 7 7 7 7 7 Toronto Regional Real Estate Board SUMMARY OF EXISTING HOME TRANSACTIONS Co-Op Apartment, February 2023 Market Watch, February 2023 Copyright 2023 Toronto Regional Real Estate Board 20 City of Toronto Municipal Breakdown
  • 21. Sales Dollar Volume Average Price Median Price New Listings Active Listings Avg. SP/LP Avg. LDOM Abc Abc Abc Abc Abc Abc Abc Abc Abc Abc Abc Abc Abc Abc Abc Abc Abc Abc Abc Abc Abc Abc Abc Abc Abc Abc Abc Abc Abc Abc Abc Abc Abc Abc Abc Abc Abc Abc Abc Abc Abc All TRREB Areas Halton Region Halton Region Burlington Halton Hills Milton Milton Oakville Peel Region Brampton Brampton Caledon Mississauga City of Toronto City of Toronto Toronto West Toronto Central Toronto East Toronto East York Region Aurora East Gwillimbury East Gwillimbury Georgina King Markham Markham Newmarket Richmond Hill Richmond Hill Vaughan Vaughan Stouffville Durham Region Durham Region Ajax Ajax Brock Clarington Clarington Oshawa Oshawa Pickering Scugog Scugog Uxbridge Uxbridge Whitby Dufferin County Dufferin County Orangeville Orangeville Simcoe County Adjala-Tosorontio Adjala-Tosorontio Bradford Bradford Essa Innisfil Innisfil New Tecumseth 2 0 0 0 0 0 0 0 1 0 0 0 1 0 0 0 0 0 0 1 0 0 0 1 0 0 0 0 0 0 0 0 0 0 0 0 0 0 0 0 0 0 0 0 0 0 0 0 0 0 0 0 0 0 0 0 0 0 0 0 0 $2,089,000 $730,000 $730,000 $1,359,000 $1,359,000 $1,044,500 $730,000 $730,000 $1,359,000 $1,359,000 $1,044,500 $730,000 $730,000 $1,359,000 $1,359,000 9 1 1 1 0 0 0 0 3 1 1 0 2 0 0 0 0 0 0 0 0 0 0 0 0 0 0 0 0 0 0 0 0 1 1 1 1 0 0 0 0 0 0 0 0 0 0 0 0 0 0 0 4 0 0 0 0 0 0 0 4 15 1 1 1 0 0 0 0 3 2 2 0 1 0 0 0 0 0 0 0 0 0 0 0 0 0 0 0 0 0 0 0 0 1 1 1 1 0 0 0 0 0 0 0 0 0 0 0 0 0 0 0 10 0 0 0 0 0 0 0 10 106% 124% 124% 99% 99% 7 5 5 8 8 Toronto Regional Real Estate Board SUMMARY OF EXISTING HOME TRANSACTIONS Detached Condo, February 2023 Market Watch, February 2023 Copyright 2023 Toronto Regional Real Estate Board 21 ALL TRREB AREAS
  • 22. Sales Dollar Volume Average Price Median Price New Listings Active Listings Avg. SP/LP Avg. LDOM Abc Abc Abc Abc Abc Abc Abc Abc Abc Abc Abc Abc Abc Abc Abc Abc Abc Abc Abc Abc Abc Abc Abc Abc Abc Abc Abc Abc Abc Abc Abc Abc Abc Abc Abc Abc Abc Abc Abc Abc All TRREB Areas All TRREB Areas City of Toronto City of Toronto Toronto West Toronto W01 Toronto W02 Toronto W02 Toronto W03 Toronto W03 Toronto W04 Toronto W05 Toronto W06 Toronto W06 Toronto W07 Toronto W07 Toronto W08 Toronto W09 Toronto W10 Toronto W10 Toronto Central Toronto Central Toronto C01 Toronto C02 Toronto C03 Toronto C03 Toronto C04 Toronto C04 Toronto C06 Toronto C07 Toronto C08 Toronto C08 Toronto C09 Toronto C09 Toronto C10 Toronto C11 Toronto C12 Toronto C12 Toronto C13 Toronto C13 Toronto C14 Toronto C15 Toronto East Toronto East Toronto E01 Toronto E01 Toronto E02 Toronto E03 Toronto E04 Toronto E04 Toronto E05 Toronto E05 Toronto E06 Toronto E07 Toronto E08 Toronto E08 Toronto E09 Toronto E09 Toronto E10 Toronto E11 2 2 0 0 0 0 0 0 0 0 0 0 0 0 0 0 0 0 0 0 0 0 0 0 0 0 0 0 0 0 0 0 0 0 0 0 0 0 0 0 0 0 0 0 0 0 0 0 0 0 0 0 0 0 0 0 0 0 0 0 $2,089,000 $2,089,000 $1,044,500 $1,044,500 $1,044,500 $1,044,500 9 9 0 0 0 0 0 0 0 0 0 0 0 0 0 0 0 0 0 0 0 0 0 0 0 0 0 0 0 0 0 0 0 0 0 0 0 0 0 0 0 0 0 0 0 0 0 0 0 0 0 0 0 0 0 0 0 0 0 0 15 15 0 0 0 0 0 0 0 0 0 0 0 0 0 0 0 0 0 0 0 0 0 0 0 0 0 0 0 0 0 0 0 0 0 0 0 0 0 0 0 0 0 0 0 0 0 0 0 0 0 0 0 0 0 0 0 0 0 0 106% 106% 7 7 Toronto Regional Real Estate Board SUMMARY OF EXISTING HOME TRANSACTIONS Detached Condo, February 2023 Market Watch, February 2023 Copyright 2023 Toronto Regional Real Estate Board 22 City of Toronto Municipal Breakdown
  • 23. Sales Dollar Volume Average Price Median Price New Listings Active Listings Avg. SP/LP Avg. LDOM Abc Abc Abc Abc Abc Abc Abc Abc Abc Abc Abc Abc Abc Abc Abc Abc Abc Abc Abc Abc Abc Abc Abc Abc Abc Abc Abc Abc Abc Abc Abc Abc Abc Abc Abc Abc Abc Abc Abc Abc Abc All TRREB Areas Halton Region Halton Region Burlington Halton Hills Milton Milton Oakville Peel Region Brampton Brampton Caledon Mississauga City of Toronto City of Toronto Toronto West Toronto Central Toronto East Toronto East York Region Aurora East Gwillimbury East Gwillimbury Georgina King Markham Markham Newmarket Richmond Hill Richmond Hill Vaughan Vaughan Stouffville Durham Region Durham Region Ajax Ajax Brock Clarington Clarington Oshawa Oshawa Pickering Scugog Scugog Uxbridge Uxbridge Whitby Dufferin County Dufferin County Orangeville Orangeville Simcoe County Adjala-Tosorontio Adjala-Tosorontio Bradford Bradford Essa Innisfil Innisfil New Tecumseth 3 0 0 0 0 0 0 0 0 0 0 0 0 3 3 0 3 0 0 0 0 0 0 0 0 0 0 0 0 0 0 0 0 0 0 0 0 0 0 0 0 0 0 0 0 0 0 0 0 0 0 0 0 0 0 0 0 0 0 0 0 $1,435,513 $1,435,513 $1,435,513 $1,435,513 $478,504 $478,504 $478,504 $478,504 $450,000 $450,000 $450,000 $450,000 8 0 0 0 0 0 0 0 0 0 0 0 0 8 8 1 7 0 0 0 0 0 0 0 0 0 0 0 0 0 0 0 0 0 0 0 0 0 0 0 0 0 0 0 0 0 0 0 0 0 0 0 0 0 0 0 0 0 0 0 0 10 0 0 0 0 0 0 0 0 0 0 0 0 10 10 2 8 0 0 0 0 0 0 0 0 0 0 0 0 0 0 0 0 0 0 0 0 0 0 0 0 0 0 0 0 0 0 0 0 0 0 0 0 0 0 0 0 0 0 0 0 96% 96% 96% 96% 15 15 15 15 Toronto Regional Real Estate Board SUMMARY OF EXISTING HOME TRANSACTIONS Co-Ownership Apartment, February 2023 Market Watch, February 2023 Copyright 2023 Toronto Regional Real Estate Board 23 ALL TRREB AREAS
  • 24. Sales Dollar Volume Average Price Median Price New Listings Active Listings Avg. SP/LP Avg. LDOM Abc Abc Abc Abc Abc Abc Abc Abc Abc Abc Abc Abc Abc Abc Abc Abc Abc Abc Abc Abc Abc Abc Abc Abc Abc Abc Abc Abc Abc Abc Abc Abc Abc Abc Abc Abc Abc Abc Abc Abc All TRREB Areas All TRREB Areas City of Toronto City of Toronto Toronto West Toronto W01 Toronto W02 Toronto W02 Toronto W03 Toronto W03 Toronto W04 Toronto W05 Toronto W06 Toronto W06 Toronto W07 Toronto W07 Toronto W08 Toronto W09 Toronto W10 Toronto W10 Toronto Central Toronto Central Toronto C01 Toronto C02 Toronto C03 Toronto C03 Toronto C04 Toronto C04 Toronto C06 Toronto C07 Toronto C08 Toronto C08 Toronto C09 Toronto C09 Toronto C10 Toronto C11 Toronto C12 Toronto C12 Toronto C13 Toronto C13 Toronto C14 Toronto C15 Toronto East Toronto East Toronto E01 Toronto E01 Toronto E02 Toronto E03 Toronto E04 Toronto E04 Toronto E05 Toronto E05 Toronto E06 Toronto E07 Toronto E08 Toronto E08 Toronto E09 Toronto E09 Toronto E10 Toronto E11 3 3 3 3 0 0 0 0 0 0 0 0 0 0 0 0 0 0 0 0 3 3 0 1 1 1 0 0 0 0 0 0 0 0 0 0 0 0 1 1 0 0 0 0 0 0 0 0 0 0 0 0 0 0 0 0 0 0 0 0 $1,435,513 $1,435,513 $1,435,513 $1,435,513 $1,435,513 $1,435,513 $540,000 $450,000 $450,000 $445,513 $445,513 $478,504 $478,504 $478,504 $478,504 $478,504 $478,504 $540,000 $450,000 $450,000 $445,513 $445,513 $450,000 $450,000 $450,000 $450,000 $450,000 $450,000 $540,000 $450,000 $450,000 $445,513 $445,513 8 8 8 8 1 0 0 0 0 0 0 1 0 0 0 0 0 0 0 0 7 7 1 0 0 0 1 1 0 0 0 0 0 0 0 0 0 0 1 1 4 0 0 0 0 0 0 0 0 0 0 0 0 0 0 0 0 0 0 0 10 10 10 10 2 0 0 0 0 0 0 2 0 0 0 0 0 0 0 0 8 8 1 0 0 0 2 2 0 0 0 0 0 0 0 0 0 0 0 0 5 0 0 0 0 0 0 0 0 0 0 0 0 0 0 0 0 0 0 0 96% 96% 96% 96% 96% 96% 98% 98% 98% 93% 93% 15 15 15 15 15 15 14 12 12 18 18 Toronto Regional Real Estate Board SUMMARY OF EXISTING HOME TRANSACTIONS Co-Ownership Apartment, February 2023 Market Watch, February 2023 Copyright 2023 Toronto Regional Real Estate Board 24 City of Toronto Municipal Breakdown
  • 25. Index Benchmark Yr./Yr. % Chg. Index Benchmark Yr./Yr. % Chg. Index Benchmark Yr./Yr. % Chg. Index Benchmark Yr./Yr. % Chg. Index Benchmark Yr./Yr. % Chg. 344.9 $1,091,300 -17.70% 354.1 $1,385,000 -19.60% 372.2 $1,055,900 -18.68% 372.1 $796,400 -15.47% 349.2 $695,000 -10.76% 359.6 $1,149,600 -22.00% 379.8 $1,464,800 -22.33% 400.6 $1,013,000 -22.80% 378.7 $778,700 -21.95% 359.7 $613,700 -13.84% 352.4 $989,500 -22.52% 387.2 $1,282,000 -23.76% 393.7 $940,600 -23.86% 384.3 $739,400 -22.38% 388.5 $583,200 -13.59% 383.3 $1,136,800 -23.72% 365.7 $1,210,500 -23.84% 394.2 $886,900 -24.80% 430.4 $672,700 -21.00% 346.3 $644,900 -15.82% 321.7 $1,059,200 -24.09% 321.6 $1,371,200 -24.20% 395.7 $955,600 -24.40% 399.8 $754,400 -22.40% 330.7 $622,300 -14.83% 373.2 $1,372,000 -20.15% 393.0 $1,774,200 -20.07% 419.1 $1,160,900 -19.79% 352.5 $853,300 -21.75% 357.6 $655,400 -13.58% 398.2 $1,034,400 -20.74% 358.5 $1,312,400 -22.42% 361.5 $964,600 -22.42% 371.5 $785,800 -14.83% 360.9 $618,200 -12.78% 369.1 $1,013,800 -22.73% 366.0 $1,198,700 -23.33% 382.6 $938,200 -23.40% 378.1 $708,200 -17.10% 384.4 $565,500 -16.63% 360.1 $1,301,000 -25.03% 358.2 $1,390,000 -25.20% 377.9 $941,700 -25.20% 396.1 $928,800 -19.41% 409.3 $1,024,800 -18.35% 356.0 $1,446,100 -21.03% 353.8 $1,012,800 -20.46% 385.3 $818,700 -13.75% 355.1 $628,200 -12.13% 295.7 $1,077,500 -13.89% 368.5 $1,645,900 -17.00% 369.0 $1,250,800 -16.14% 364.4 $861,100 -9.42% 351.1 $728,500 -9.37% 360.1 $1,323,200 -14.24% 365.6 $1,610,300 -15.08% 383.6 $1,157,000 -13.23% 347.4 $888,000 -14.85% 317.5 $668,600 -13.82% 407.8 $1,350,600 -16.11% 382.4 $1,604,700 -17.01% 411.4 $1,069,100 -18.13% 329.7 $907,000 -14.14% 327.9 $626,000 -12.26% 346.0 $1,286,900 -21.86% 343.2 $1,340,900 -22.21% 359.2 $844,900 -20.72% 388.7 $802,600 -21.08% 394.1 $809,900 -20.96% 391.7 $693,300 -18.70% 380.4 $1,816,700 -14.19% 381.8 $2,019,900 -14.39% 328.1 $947,500 -13.13% 310.1 $725,700 -11.50% 376.4 $1,352,200 -13.01% 407.6 $1,808,300 -13.41% 410.7 $1,264,400 -12.62% 349.4 $900,000 -16.73% 310.6 $685,200 -14.44% 365.4 $1,200,300 -16.61% 355.5 $1,323,600 -17.19% 356.3 $982,700 -16.89% 392.9 $819,900 -14.21% 316.7 $567,800 -12.22% 361.3 $1,426,100 -12.37% 374.0 $1,876,500 -13.27% 368.5 $1,210,900 -12.07% 333.9 $904,000 -9.17% 323.2 $629,500 -14.68% 329.0 $1,322,100 -13.08% 356.7 $1,713,600 -13.46% 369.1 $1,175,100 -11.32% 337.0 $888,300 -15.24% 308.0 $689,300 -13.24% 349.4 $1,396,900 -16.55% 336.1 $1,551,900 -17.09% 410.3 $1,058,200 -13.68% 440.1 $858,100 -16.54% 324.1 $641,300 -12.85% 384.4 $924,400 -23.23% 375.3 $1,004,000 -23.55% 405.0 $801,400 -23.60% 415.5 $644,000 -20.58% 341.5 $572,400 -18.36% 383.8 $991,100 -24.39% 378.2 $1,093,500 -24.50% 380.5 $881,600 -24.65% 384.0 $680,500 -20.73% 336.4 $556,100 -18.67% 337.7 $658,600 -18.55% 339.6 $658,200 -18.58% -100.00% 375.3 $853,700 -22.71% 381.5 $938,900 -22.76% 406.8 $728,200 -23.04% 425.2 $647,600 -24.34% 303.2 $550,900 -17.29% 423.0 $822,300 -23.70% 402.4 $877,300 -24.20% 435.6 $699,100 -23.11% 451.9 $603,700 -22.45% 403.6 $504,500 -16.83% 356.3 $992,700 -24.48% 356.5 $1,178,100 -24.85% 366.9 $861,900 -25.24% 387.8 $672,400 -20.30% 328.2 $615,100 -18.80% 334.2 $910,800 -19.95% 332.7 $921,300 -20.23% 335.5 $645,800 -21.19% 357.7 $1,176,500 -19.22% 337.6 $1,219,000 -19.68% 323.1 $841,600 -19.91% 438.2 $688,900 -20.80% 298.5 $720,100 -17.88% 393.8 $1,036,900 -21.94% 386.4 $1,131,100 -22.77% 408.9 $868,600 -21.61% 413.4 $657,700 -12.73% 349.9 $599,300 -18.42% 362.7 $761,000 -21.43% 357.8 $866,200 -21.60% 377.9 $677,500 -19.89% 423.8 $592,900 -16.87% 378.8 $510,600 -15.41% 362.7 $761,000 -21.43% 357.8 $866,200 -21.60% 377.9 $677,500 -19.89% 423.8 $592,900 -16.87% 378.8 $510,600 -15.41% 317.4 $859,900 -20.79% 320.8 $907,600 -20.93% 334.9 $731,700 -18.67% 417.3 $622,600 -21.41% 368.0 $595,000 -12.11% 397.7 $1,117,500 -19.49% 398.1 $1,118,800 -19.46% 384.2 $1,070,400 -16.93% 385.5 $1,130,700 -17.31% 391.5 $877,400 -15.20% 391.3 $628,500 -20.92% 334.1 $568,700 -11.94% 355.2 $748,700 -22.97% 349.1 $797,400 -23.02% 408.4 $650,600 -21.84% 458.1 $616,600 -20.09% 413.1 $793,100 -22.04% 418.4 $803,800 -21.87% 406.4 $655,500 -20.14% 328.4 $302,500 -17.34% 324.0 $622,400 -13.02% 358.8 $821,200 -21.88% 356.7 $920,600 -22.56% 374.5 $672,200 -22.03% 384.9 $697,100 -21.16% 391.9 $583,100 -11.87% Toronto Regional Real Estate Board FOCUS ON THE MLS HOME PRICE INDEX Index and Benchmark Price, February 2023 Market Watch, February 2023 Copyright 2023 Toronto Regional Real Estate Board 25 ALL TRREB AREAS Single Family Detached Single Family Attached Composite Townhouse Apartment ® All TRREB Areas Halton Region Burlington Halton Hills Milton Oakville Peel Region Brampton Caledon Mississauga City of Toronto York Region Aurora East Gwillimbury Georgina King Markham Newmarket Richmond Hill Vaughan Stouffville Durham Region Ajax Brock Clarington Oshawa Pickering Scugog Uxbridge Whitby Dufferin County Orangeville Simcoe County Adjala-Tosorontio Bradford Essa Innisfil New Tecumseth
  • 26. Index Benchmark Yr./Yr. % Chg. Index Benchmark Yr./Yr. % Chg. Index Benchmark Yr./Yr. % Chg. Index Benchmark Yr./Yr. % Chg. Index Benchmark Yr./Yr. % Chg. 344.9 $1,091,300 -17.70% 354.1 $1,385,000 -19.60% 372.2 $1,055,900 -18.68% 372.1 $796,400 -15.47% 349.2 $695,000 -10.76% 295.7 $1,077,500 -13.89% 368.5 $1,645,900 -17.00% 369.0 $1,250,800 -16.14% 364.4 $861,100 -9.42% 351.1 $728,500 -9.37% 251.6 $1,073,700 -17.48% 314.0 $1,773,700 -25.18% 314.7 $1,295,800 -24.17% 302.2 $896,400 -6.27% 321.3 $683,000 -6.92% 353.6 $1,227,900 -19.51% 374.2 $1,669,100 -22.19% 408.2 $1,259,600 -20.46% 361.3 $1,040,300 -10.77% 355.3 $727,000 -11.88% 389.5 $955,100 -19.41% 378.5 $1,014,800 -21.13% 395.2 $1,001,800 -19.23% 365.5 $870,300 -7.42% 366.1 $577,700 -12.27% 346.2 $877,600 -16.54% 339.1 $1,155,200 -19.24% 329.4 $895,300 -18.93% 308.3 $718,300 -6.15% 447.6 $568,000 -12.71% 378.2 $846,900 -13.63% 328.5 $1,202,500 -17.88% 322.4 $966,000 -16.69% 359.4 $676,400 0.90% 523.8 $585,100 -8.71% 336.9 $960,700 -10.21% 393.6 $1,311,800 -15.52% 386.3 $1,213,500 -11.03% 379.8 $1,040,900 -5.78% 309.1 $760,900 -7.51% 309.7 $1,529,400 -15.29% 331.4 $1,759,100 -15.33% 327.9 $1,335,900 -12.49% 415.5 $1,128,900 -6.75% 129.9 $759,200 -11.33% 251.2 $1,083,600 -14.47% 305.0 $1,815,000 -17.28% 326.5 $1,310,700 -15.17% 325.3 $732,500 -5.41% 287.7 $601,100 -10.23% 333.4 $954,100 -17.27% 318.1 $1,325,400 -20.22% 346.1 $926,200 -15.61% 295.1 $859,100 -3.40% 367.9 $460,600 -14.76% 355.6 $753,200 -17.63% 327.1 $990,900 -21.10% 336.9 $907,300 -16.65% 411.0 $700,800 -9.53% 446.8 $530,300 -12.56% 328.3 $865,200 -12.36% 391.6 $1,659,400 -20.76% 364.8 $1,432,100 -20.57% 360.4 $895,200 -7.73% 352.7 $794,300 -10.84% 323.0 $1,448,500 -13.15% 330.4 $2,716,900 -14.74% 350.3 $2,048,700 -11.45% 275.1 $1,397,500 -17.11% 289.3 $928,800 -13.10% 277.1 $1,555,300 -19.12% 295.3 $1,989,100 -18.27% 413.2 $1,264,800 -20.60% 278.6 $822,800 -16.84% 293.7 $2,108,800 -17.03% 317.3 $2,630,700 -17.05% 357.2 $1,623,300 -15.58% 285.1 $734,900 -14.38% 279.6 $1,122,500 -13.65% 404.9 $1,633,900 -15.96% 309.7 $1,142,800 -13.54% 311.9 $825,900 -9.44% 393.6 $681,400 -5.36% 297.1 $1,237,400 -8.47% 487.3 $2,069,700 -11.38% 351.4 $1,264,500 -6.14% 291.4 $805,500 -8.97% 329.9 $791,100 -6.91% 309.2 $826,400 -9.22% 332.4 $2,082,200 -17.38% 354.3 $1,514,600 -15.96% 378.9 $1,205,900 -2.07% 340.1 $768,700 -8.03% 274.3 $2,237,600 -15.55% 255.7 $3,892,800 -17.17% 274.1 $2,597,100 -18.18% 289.8 $1,902,900 -11.02% 312.1 $1,158,500 -9.30% 289.6 $1,117,700 -10.59% 338.6 $2,215,700 -12.05% 327.8 $1,601,700 -11.43% 257.3 $1,062,300 -13.28% 307.5 $781,700 -7.85% 338.8 $1,260,500 -16.30% 302.0 $2,466,800 -20.53% 315.9 $1,508,400 -19.02% 462.3 $764,200 0.96% 367.1 $540,800 -6.38% 328.0 $2,869,700 -15.92% 312.8 $3,728,800 -18.63% 296.5 $1,573,400 -14.90% 353.2 $1,473,000 -4.87% 369.3 $1,281,200 -14.85% 288.9 $1,218,200 -14.12% 326.5 $1,958,500 -17.13% 321.6 $1,013,700 -15.79% 413.1 $955,400 -5.90% 290.0 $704,000 -9.80% 366.9 $1,163,700 -7.95% 384.1 $2,589,200 -6.66% 346.7 $1,737,800 -0.94% 361.4 $805,300 -15.52% 350.7 $799,200 -11.24% 298.8 $972,400 -10.49% 393.9 $1,950,400 -16.49% 312.9 $1,134,500 -12.65% 360.2 $803,600 -17.16% 343.6 $666,300 -2.72% 413.6 $1,218,400 -11.51% 436.4 $1,514,300 -13.40% 433.3 $1,325,600 -12.06% 549.1 $1,045,500 -1.81% 378.3 $827,300 -9.54% 401.1 $1,361,500 -13.29% 408.3 $1,746,100 -14.01% 397.8 $1,299,600 -14.73% 443.2 $1,155,300 -3.04% 338.3 $847,100 -11.11% 364.7 $1,170,200 -16.08% 340.3 $1,330,400 -16.43% 371.4 $1,242,300 -16.93% 381.8 $586,000 -9.03% 415.1 $883,700 -18.54% 398.6 $1,130,500 -20.25% 364.7 $920,900 -21.89% 360.4 $787,200 -18.02% 407.8 $514,600 -12.28% 339.6 $973,400 -15.75% 383.8 $1,405,400 -17.83% 376.8 $1,064,000 -16.42% 342.5 $762,300 -18.63% 350.1 $623,200 -5.99% 386.0 $1,145,000 -16.50% 404.3 $1,267,000 -17.39% 377.7 $967,400 -19.93% 367.7 $764,000 -17.28% 369.4 $697,500 -11.05% 364.9 $945,700 -14.92% 375.5 $1,310,600 -18.92% 377.7 $1,022,500 -18.81% 372.9 $792,800 -18.74% 391.4 $649,300 -7.60% 357.7 $968,700 -16.78% 358.0 $1,273,500 -17.51% 328.8 $918,100 -19.15% 360.3 $686,000 -17.00% 371.7 $551,600 -15.48% 429.5 $856,500 -14.88% 401.2 $1,098,400 -19.01% 360.1 $892,000 -20.40% 396.0 $689,500 -8.57% 436.7 $593,000 -7.85% 365.5 $1,078,300 -16.15% 373.4 $1,304,700 -18.44% 358.2 $979,200 -19.03% 406.1 $688,400 -4.38% 291.4 $519,000 -11.21% 370.3 $812,100 -15.99% 355.5 $1,074,000 -19.24% 391.5 $888,800 -19.68% 432.4 $766,600 -12.20% 455.2 $514,800 -1.62% Toronto Regional Real Estate Board FOCUS ON THE MLS HOME PRICE INDEX Index and Benchmark Price, February 2023 Market Watch, February 2023 Copyright 2023 Toronto Regional Real Estate Board 26 CITY OF TORONTO Single Family Detached Single Family Attached Composite Townhouse Apartment ® All TRREB Areas City of Toronto Toronto W01 Toronto W02 Toronto W03 Toronto W04 Toronto W05 Toronto W06 Toronto W07 Toronto W08 Toronto W09 Toronto W10 Toronto C01 Toronto C02 Toronto C03 Toronto C04 Toronto C06 Toronto C07 Toronto C08 Toronto C09 Toronto C10 Toronto C11 Toronto C12 Toronto C13 Toronto C14 Toronto C15 Toronto E01 Toronto E02 Toronto E03 Toronto E04 Toronto E05 Toronto E06 Toronto E07 Toronto E08 Toronto E09 Toronto E10 Toronto E11
  • 27. Bradford West Gwillimbury Whitchurch-Stouûville Adjala-Tosorontio East Gwillimbury Richmond Hill Toronto W06 Toronto W09 Toronto W05 Toronto E09 Toronto E06 Toronto E07 Halton Hills Orangeville Burlington Clarington Brampton Markham Georgina Pickering Vaughan Oshawa Caledon Oakville Scugog Innisûl Milton Brock Essa King Toronto Regional Real Estate Board Historic Annual Statistics Market Watch, February 2023 Copyright 2023 Toronto Regional Real Estate Board 27 Monthly Statistics 2023 Monthly Statistics 2022 Year Sales Average Price 2010 2011 2012 2013 2014 2015 2016 2017 2018 2019 2020 2021 $1,095,475 $929,636 $819,153 $787,842 $822,510 $729,824 $622,116 $566,611 $522,951 $497,073 $464,989 $431,262 121,712 95,066 87,747 78,017 92,340 113,040 101,213 92,776 87,047 85,488 89,110 85,860 January February March April May June July August September October November December Annual $1,189,917 $1,050,942 $1,079,616 $1,090,429 $1,086,560 $1,078,873 $1,073,316 $1,145,804 $1,210,509 $1,250,739 $1,298,666 $1,334,062 $1,242,407 75,082 3,103 4,511 4,934 5,001 5,587 4,870 6,423 7,227 7,941 10,863 9,028 5,594 January February March April May June July August September October November December Year to Date $1,073,138 $1,095,617 $1,038,390 7,877 4,783 3,094 Notes 1. Sales, dollar volume, average sale prices and median sale prices are based on firm transactions entered into the TRREB MLS® System between the first and last day of the month/period being reported. 2. New listings entered into the TRREB MLS® System between the first and last day of the month/period being reported. 3. Active listings at the end of the last day of the month/period being reported. 4. Ratio of the average selling price to the average listing price for firm transactions entered into the TRREB MLS® System between the first and last day of the month/period being reported. 5. Average Listing Days on Market (Avg. LDOM) refers to the average number of days sold listings were on the market. Average Property Days on Market (Avg. PDOM) refers to the average number of days a property was on the market before selling, irrespective of whether the property was listed more than once by the same combination of seller and brokerage during the original listing contract period. 6. Active Listings at the end of the last day of the month/period being reported. 7. Past monthly and year-to-date figures are revised on a monthly basis. 8. SNLR = Sales-to-New-Listings Ratio. Calculated using a 12 month moving average (sales/new listings). 9. Mos. Inv. = Months of Inventory. Calculated using a 12 month moving average (active listings/sales). 10. "Bradford West Gwillimbury" is referred to as "Bradford" and "Whitchurch-Stouffville" is referred to as "Stouffville" in the report. Dufferin Durham Halton Peel Simcoe Toronto York For historical annual sales and average price data over a longer time frame, go to: https://trreb.ca/files/market-stats/market-watch/historic.pdf