Mercer Capital's Business Development Companies Quarterly Newsletter | Q4 2013
•
0 gefällt mir•297 views

Business development companies are an important and growing source of funding for middle market companies. Along with private equity and other investment funds, BDCs provide billions of dollars of investment capital to private companies in every segment of the economy. For over thirty years, Mercer Capital has met the valuation needs of the same middle market companies to which BDCs and other funds provide capital. This quarterly newsletter tracks the financial and stock market performance of the public BDCs.

Empfohlen
Empfohlen
Weitere ähnliche Inhalte
Was ist angesagt?
Was ist angesagt? (19)
Ähnlich wie Mercer Capital's Business Development Companies Quarterly Newsletter | Q4 2013
Ähnlich wie Mercer Capital's Business Development Companies Quarterly Newsletter | Q4 2013 (20)
Mehr von Mercer Capital
Mehr von Mercer Capital (20)
Kürzlich hochgeladen
Kürzlich hochgeladen (20)
Mercer Capital's Business Development Companies Quarterly Newsletter | Q4 2013
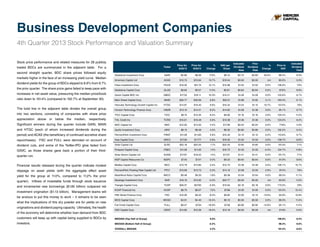
- 1. Business Development Companies 4th Quarter 2013 Stock Performance and Valuation Summary Stock price performance and related measures for 28 publicly Ticker traded BDCs are summarized in the adjacent table. For a second straight quarter, BDC share prices followed equity Price for 6/28/13 Price for 9/30/13 % Change NAV per Share Indicated Dividend Rate Prior Dividend Rate % Change Price to NAV Indicated Dividend Yield Gladstone Investment Corp GAIN $6.89 $8.06 17.0% $9.12 $0.72 $0.60 20.0% 88.4% 8.9% American Capital Ltd ACAS $13.75 $15.64 13.7% $19.54 $0.00 $0.00 nm 80.0% 0.0% Fidus Investment Corp FDUS $19.40 $21.74 12.1% $15.98 $1.52 $1.52 0.0% 136.0% 7.0% the prior quarter. The share price gains failed to keep pace with Gladstone Capital Corp GLAD $8.60 $9.57 11.3% $9.81 $0.84 $0.84 0.0% 97.6% 8.8% increases in net asset value, pressuring the median price/book Golub Capital BDC Inc GBDC $17.33 $19.11 10.3% $15.21 $1.28 $1.28 0.0% 125.6% 6.7% ratio down to 101.4% (compared to 102.7% at September 30). Main Street Capital Corp MAIN $29.77 $32.69 9.8% $20.01 $1.98 $1.92 3.1% 163.4% 6.1% Hercules Technology Growth Capital Inc HTGC $14.97 $16.40 9.6% $10.42 $1.24 $1.12 10.7% 157.4% 7.6% The bold line in the adjacent table divides the overall group Horizon Technology Finance Corp HRZN $13.10 $14.21 8.5% $14.95 $1.38 $1.38 0.0% 95.1% 9.7% into two sections, consisting of companies with share price TICC Capital Corp TICC $9.74 $10.34 6.2% $9.90 $1.16 $1.16 0.0% 104.4% 11.2% appreciation above or below the median, respectively. THL Credit Inc TCRD $15.61 $16.49 5.6% $13.38 $1.36 $1.36 0.0% 123.2% 8.2% Significant winners during the quarter include GAIN, MAIN MVC Capital Inc MVC $12.93 $13.50 4.4% $17.36 $0.54 $0.54 0.0% 77.8% 4.0% and HTGC (each of whom increased dividends during the Apollo Investment Corp AINV $8.15 $8.48 4.0% $8.30 $0.80 $0.80 0.0% 102.2% 9.4% markets higher in the face of an increasing yield curve. Median dividend yields for the group of BDCs slipped to 8.6% from 8.7% period) and ACAS (the beneficiary of continued accretive share PennantPark Investment Corp PNNT $11.28 $11.60 2.8% $10.49 $1.12 $1.12 0.0% 110.6% 9.7% repurchases). FSC and FULL were demoted on account of Ares Capital Corp ARCC $17.29 $17.77 2.8% $16.35 $1.52 $1.52 0.0% 108.7% 8.6% dividend cuts, and some of the Twitter-IPO glow faded from Solar Capital Ltd SLRC $22.18 $22.55 1.7% $22.25 $1.60 $1.60 0.0% 101.3% 7.1% GSVC, as those shares gave back a portion of their third- Prospect Capital Corp PSEC $11.06 $11.22 1.4% $10.72 $1.33 $1.33 -0.4% 104.7% 11.8% quarter run. Solar Senior Capital Ltd SUNS $17.97 $18.22 1.4% $17.91 $1.41 $1.41 0.0% 101.7% 7.7% NGP Capital Resources Co NGPC $7.43 $7.47 0.5% $9.22 $0.64 $0.64 0.0% 81.0% 8.6% 10.7% Financial results released during the quarter indicate modest Medley Capital Corp MCC $13.79 $13.85 0.4% $12.70 $1.48 $1.48 0.0% 109.1% slippage on asset yields (with the aggregate effect asset PennantPark Floating Rate Capital Ltd PFLT $13.69 $13.73 0.3% $14.10 $1.08 $1.05 2.9% 97.4% 7.9% yield for the group at 11.0%, compared to 11.2% the prior BlackRock Kelso Capital Corp BKCC $9.48 $9.33 -1.6% $9.38 $1.04 $1.04 0.0% 99.5% 11.1% quarter). Inflows of investable funds through stock issuance Saratoga Investment Corp SAR $16.16 $15.65 -3.2% $23.77 $0.00 $0.00 nm 65.8% 0.0% and incremental new borrowings ($1.85 billion) outpaced net Triangle Capital Corp TCAP $29.37 $27.65 -5.9% $15.94 $2.16 $2.16 0.0% 173.5% 7.8% investment origination ($1.13 billion). Management teams will KCAP Financial Inc KCAP $8.70 $8.07 -7.2% $7.96 $1.00 $1.00 0.0% 101.4% 12.4% be anxious to put this money to work – it remains to be seen what the implications of this dry powder are for yields on new originations and dividend paying capacity. Ultimately, the health of the economy will determine whether loan demand from BDC Fifth Street Finance Corp FSC $10.09 $9.25 -8.3% $9.85 $1.00 $1.15 -13.0% 93.9% 10.8% MCGC $4.91 $4.40 -10.4% $5.10 $0.50 $0.50 0.0% 86.3% 11.4% Full Circle Capital Corp FULL $8.47 $7.04 -16.9% $7.48 $0.80 $0.92 -12.6% 94.1% 11.4% GSV Capital Corp GSVC $14.82 $12.09 -18.4% $13.16 $0.00 $0.00 nm 91.9% 0.0% 106.6% 8.4% -2.4% 98.4% 9.6% 2.2% 101.4% 8.6% MCG Capital Corp customers will keep up with capital being supplied to BDCs by MEDIAN (Top Half of Group) investors. MEDIAN (Bottom Half of Group) OVERALL MEDIAN 9.0%
- 2. Valuation Services for BDCs & Other Investment Funds Business development companies are an important and growing source of funding for middle market companies. Along with private equity and other investment funds, BDCs provide billions of dollars of investment capital to private companies in every segment of the economy. For over thirty years, Mercer Capital has met the valuation needs of the same middle market companies to which BDCs and other funds provide capital. We offer the following services for BDCs and other investment funds: • Ongoing fair value measurement and review for portfolio investments • Fair value measurement process consulting • Solvency and fairness opinions • Regulatory review and litigation support • Purchase price allocation for portfolio companies • Goodwill impairment testing for portfolio companies • Equity compensation fair value measurement for portfolio companies • Buy-sell agreement consulting and valuation dispute resolution Mercer Capital’s senior valuation professionals bring broad and deep experience to the range of valuation needs faced by BDCs and other investment funds. For more information about Mercer Capital, visit www.mercercapital.com. Contact Us Travis W. Harms, CFA, CPA/ABV 901.322.9760 harmst@mercercapital.com Tread B. Thompson, CPA 901.322.9753 thompsont@mercercapital.com Mercer Capital 5100 Poplar Avenue, Suite 2600 Memphis, Tennessee 38137 901.685.2120 (P) www.mercercapital.com Copyright © 2014 Mercer Capital Management, Inc. All rights reserved. It is illegal under Federal law to reproduce this publication or any portion of its contents without the publisher’s permission. Media quotations with source attribution are encouraged. Reporters requesting additional information or editorial comment should contact Barbara Walters Price at 901.685.2120. Mercer Capital’s Industry Focus is published quarterly and does not constitute legal or financial consulting advice. It is offered as an information service to our clients and friends. Those interested in specific guidance for legal or accounting matters should seek competent professional advice. Inquiries to discuss specific valuation matters are welcomed. To add your name to our mailing list to receive this complimentary publication, visit our web site at www.mercercapital.com.