SlideShare ist ein Scribd-Unternehmen logo
1 von 9
Downloaden Sie, um offline zu lesen
Houston Area Single‐Family Residential Market by Area for July 2010
Real Estate Data ©2010 Real Estate Center at Texas A and M University and HAR.
Data computations ©2010 Prudential Gary Greene, Realtors.


                                                                   Sales        Sold
                                        Average       Median       Price        to List     Coop        New         Active       Pending                 Months
Year    Month              Sales        Price         Price        per Sqft     Price       Sales       Listings    Listings     Sales       DOM         Inventory
Area    1- Atascocita

2009    YTD                1222         $178,276      $155,000     $70          94%         86%         2,322       1,121        952         95          6.2
2010    YTD                1234         $173,037      $148,900     $69          96%         85%         2,765       1,274        871         75          7.0
        Difference         12           -$5,239       -$6,100      -$1          0.02        -0.01       443         153          -81         -20         0.8
        % Difference       0.98%        -2.94%        -3.94%       -1.43%       2.13%       -1.16%      19.08%      13.65%       -8.51%      -21.05%     12.90%


Area    2- East

2009    YTD                1045         $91,093       $85,500      $53          96%         77%         1,988       1,052        861         92          6.4
2010    YTD                1122         $88,299       $86,480      $51          97%         76%         2,352       1,183        918         81          7.7
        Difference         77           -$2,794       $980         -$2          0.01        -0.01       364         131          57          -11         1.3
        % Difference       7.37%        -3.07%        1.15%        -3.77%       1.04%       -1.30%      18.31%      12.45%       6.62%       -11.96%     20.31%


Area    3- Southeast

2009    YTD                895          $98,136       $94,500      $56          96%         83%         1,570       689          741         84          5.1
2010    YTD                930          $103,274      $103,000     $60          97%         85%         2,001       857          665         68          6.5
        Difference         35           $5,138        $8,500       $4           0.01        0.02        431         168          -76         -16         1.4
        % Difference       3.91%        5.24%         8.99%        7.14%        1.04%       2.41%       27.45%      24.38%       -10.26%     -19.05%     27.45%


Area    4- South

2009    YTD                182          $98,744       $76,500      $60          93%         71%         475         286          161         96          8.7
2010    YTD                211          $110,609      $84,200      $71          96%         77%         565         296          161         78          9.3
        Difference         29           $11,865       $7,700       $11          0.03        0.06        90          10           0           -18         0.6
        % Difference       15.93%       12.02%        10.07%       18.33%       3.23%       8.45%       18.95%      3.50%        0.00%       -18.75%     6.90%


Area:   5 - Brazoria

2009    YTD                1522         $176,361      $163,920     $76          95%         82%         2,831       1,343        1,080       89          6.2
2010    YTD                1523         $172,257      $165,180     $76          96%         85%         3,364       1,575        988         81          7.0
        Difference         1            -$4,104       $1,260       $0           0.01        0.03        533         232          -92         -8          0.8
        % Difference       0.07%        -2.33%        0.77%        0.00%        1.05%       3.66%       18.83%      17.27%       -8.52%      -8.99%      12.90%


Area:   6- Pasadena

2009    YTD                595          $119,165      $114,500     $65          97%         83%         1,007       387          427         81          4.3
2010    YTD                600          $112,685      $109,950     $65          97%         84%         1,228       514          384         76          6.2
        Difference         5            -$6,480       -$4,550      $0           0           0.01        221         127          -43         -5          1.9
        % Difference       0.84%        -5.44%        -3.97%       0.00%        0.00%       1.20%       21.95%      32.82%       -10.07%     -6.17%      44.19%


Area:   7- Clear Lake

2009    YTD                970          $182,944      $157,250     $80          96%         82%         1,651       586          596         66          4.4
2010    YTD                856          $184,771      $155,000     $83          97%         82%         1,940       827          487         66          6.2
        Difference         -114         $1,827        -$2,250      $3           0.01        0           289         241          -109        0           1.8
        % Difference       -11.75%      1.00%         -1.43%       3.75%        1.04%       0.00%       17.50%      41.13%       -18.29%     0.00%       40.91%


Area:   8- Bear Creek

2009    YTD                1050         $163,804      $145,000     $68          97%         89%         1,907       765          697         83          4.9
2010    YTD                1030         $168,912      $143,000     $70          97%         90%         2,266       868          629         63          5.5
        Difference         -20          $5,108        -$2,000      $2           0           0.01        359         103          -68         -20         0.6
        % Difference       -1.90%       3.12%         -1.38%       2.94%        0.00%       1.12%       18.83%      13.46%       -9.76%      -24.10%     12.24%


              Real Estate Data ©2010 Real Estate Center at Texas A and M University and HAR. Data computations ©2010 Prudential Gary Greene, Realtors.
Sales        Sold
                                        Average       Median       Price        to List     Coop        New         Active       Pending                 Months
Year    Month              Sales        Price         Price        per Sqft     Price       Sales       Listings    Listings     Sales       DOM         Inventory
Area:   9- The Heights

2009    YTD                1023         $250,979      $238,000     $136         96%         83%         2,232       1,104        572         85          7.3
2010    YTD                1091         $258,827      $249,000     $143         97%         81%         2,388       1,123        542         68          6.9
        Difference         68           $7,848        $11,000      $7           0.01        -0.02       156         19           -30         -17         -0.4
        % Difference       6.65%        3.13%         4.62%        5.15%        1.04%       -2.41%      6.99%       1.72%        -5.24%      -20.00%     -5.48%


Area:   10- Hempstead East

2009    YTD                1005         $178,182      $159,900     $71          96%         89%         1,796       730          650         84          4.9
2010    YTD                1070         $172,903      $154,500     $71          97%         89%         2,215       888          627         68          5.8
        Difference         65           -$5,279       -$5,400      $0           0.01        0           419         158          -23         -16         0.9
        % Difference       6.47%        -2.96%        -3.38%       0.00%        1.04%       0.00%       23.33%      21.64%       -3.54%      -19.05%     18.37%


Area:   11-Near North

2009    YTD                491          $92,983       $85,000      $51          96%         87%         902         441          413         88          5.7
2010    YTD                574          $96,005       $89,900      $53          97%         87%         1,113       456          451         70          5.7
        Difference         83           $3,022        $4,900       $2           0.01        0           211         15           38          -18         0
        % Difference       16.90%       3.25%         5.76%        3.92%        1.04%       0.00%       23.39%      3.40%        9.20%       -20.45%     0.00%


Area:   12- North

2009    YTD                1013         $100,921      $95,000      $50          97%         89%         1,604       778          835         85          5.4
2010    YTD                1011         $101,780      $95,550      $51          98%         88%         1,783       713          790         68          4.9
        Difference         -2           $859          $550         $1           0.01        -0.01       179         -65          -45         -17         -0.5
        % Difference       -0.20%       0.85%         0.58%        2.00%        1.03%       -1.12%      11.16%      -8.35%       -5.39%      -20.00%     -9.26%


Area:   13- Northwest

2009    YTD                1293         $156,175      $136,000     $60          97%         87%         2,440       1,111        956         91          5.6
2010    YTD                1243         $160,723      $139,950     $62          96%         88%         2,834       1,217        849         75          6.4
        Difference         -50          $4,548        $3,950       $2           -0.01       0.01        394         106          -107        -16         0.8
        % Difference       -3.87%       2.91%         2.90%        3.33%        -1.03%      1.15%       16.15%      9.54%        -11.19%     -17.58%     14.29%


Area:   14- Far Northwest

2009    YTD                929          $195,233      $151,000     $77          95%         85%         1,804       821          638         95          6.0
2010    YTD                951          $205,183      $154,000     $80          95%         89%         2,050       903          581         75          6.4
        Difference         22           $9,950        $3,000       $3           0           0.04        246         82           -57         -20         0.4
        % Difference       2.37%        5.10%         1.99%        3.90%        0.00%       4.71%       13.64%      9.99%        -8.93%      -21.05%     6.67%


Area:   15-Montgomery County Southwest

2009    YTD                1814         $276,106      $212,000     $101         96%         83%         3,753       1,676        1,244       79          6.4
2010    YTD                1899         $278,772      $212,000     $103         96%         85%         4,230       1,788        1,260       75          6.6
        Difference         85           $2,666        $0           $2           0           0.02        477         112          16          -4          0.2
        % Difference       4.69%        0.97%         0.00%        1.98%        0.00%       2.41%       12.71%      6.68%        1.29%       -5.06%      3.12%


Area:   16- Central Inner Loop

2009    YTD                358          $549,669      $370,000     $207         95%         81%         997         557          188         85          10.0
2010    YTD                389          $634,874      $419,000     $220         94%         84%         968         524          181         103         9.5
        Difference         31           $85,205       $49,000      $13          -0.01       0.03        -29         -33          -7          18          -0.5
        % Difference       8.66%        15.50%        13.24%       6.28%        -1.05%      3.70%       -2.91%      -5.92%       -3.72%      21.18%      -5.00%


              Real Estate Data ©2010 Real Estate Center at Texas A and M University and HAR. Data computations ©2010 Prudential Gary Greene, Realtors.
Sales        Sold
                                        Average       Median       Price        to List     Coop        New         Active       Pending                 Months
Year    Month               Sales       Price         Price        per Sqft     Price       Sales       Listings    Listings     Sales       DOM         Inventory
Area:   17-Southwest Inner Loop

2009    YTD                 497         $704,246      $640,000     $220         95%         81%         1,277       726          181         91          10.1
2010    YTD                 589         $675,724      $589,000     $219         95%         85%         1,198       635          186         86          8.0
        Difference          92          -$28,522      -$51,000     -$1          0           0.04        -79         -91          5           -5          -2.1
        % Difference        18.51%      -4.05%        -7.97%       -0.45%       0.00%       4.94%       -6.19%      -12.53%      2.76%       -5.49%      -20.79%


Area:   18- South Central

2009    YTD                 134         $80,284       $70,000      $48          98%         85%         243         120          117         83          5.8
2010    YTD                 103         $93,603       $84,950      $57          98%         77%         273         110          68          68          6.7
        Difference          -31         $13,319       $14,950      $9           0           -0.08       30          -10          -49         -15         0.9
        % Difference        -23.13%     16.59%        21.36%       18.75%       0.00%       -9.41%      12.35%      -8.33%       -41.88%     -18.07%     15.52%


Area:   19- Montgomery County Northeast

2009    YTD                 414         $134,485      $109,000     $68          95%         71%         862         454          341         95          6.6
2010    YTD                 498         $136,345      $113,500     $66          96%         82%         957         466          333         84          6.9
        Difference          84          $1,860        $4,500       -$2          0.01        0.11        95          12           -8          -11         0.3
        % Difference        20.29%      1.38%         4.13%        -2.94%       1.05%       15.49%      11.02%      2.64%        -2.35%      -11.58%     4.55%


Area:   20- Bellaire South

2009    YTD                 528         $172,347      $145,000     $84          96%         85%         912         385          327         70          4.8
2010    YTD                 479         $186,602      $155,000     $88          96%         88%         1,034       421          281         64          5.7
        Difference          -49         $14,255       $10,000      $4           0           0.03        122         36           -46         -6          0.9
        % Difference        -9.28%      8.27%         6.90%        4.76%        0.00%       3.53%       13.38%      9.35%        -14.07%     -8.57%      18.75%


Area:   21-Bellaire West

2009    YTD                 126         $116,728      $115,500     $63          96%         88%         216         86           88          90          4.8
2010    YTD                 111         $122,383      $116,250     $65          94%         83%         251         105          66          64          5.8
        Difference          -15         $5,655        $750         $2           -0.02       -0.05       35          19           -22         -26         1
        % Difference        -11.90%     4.84%         0.65%        3.17%        -2.08%      -5.68%      16.20%      22.09%       -25.00%     -28.89%     20.83%


Area:   22 - Central West

2009    YTD                 223         $604,030      $450,000     $197         94%         79%         576         360          89          92          10.3
2010    YTD                 272         $645,006      $480,000     $202         94%         85%         641         354          94          99          8.7
        Difference          49          $40,976       $30,000      $5           0           0.06        65          -6           5           7           -1.6
        % Difference        21.97%      6.78%         6.67%        2.54%        0.00%       7.59%       11.28%      -1.67%       5.62%       7.61%       -15.53%


Area:   23- Memorial

2009    YTD                 307         $837,985      $575,000     $215         94%         82%         743         370          140         90          8.0
2010    YTD                 386         $803,689      $559,980     $214         93%         83%         717         313          124         90          6.3
        Difference          79          -$34,296      -$15,020     -$1          -0.01       0.01        -26         -57          -16         0           -1.7
        % Difference        25.73%      -4.09%        -2.61%       -0.47%       -1.06%      1.22%       -3.50%      -15.41%      -11.43%     0.00%       -21.25%


Area:   24 - Spring Branch

2009    YTD                 351         $236,440      $169,900     $115         95%         84%         718         312          199         73          6.0
2010    YTD                 369         $222,703      $172,000     $108         96%         84%         794         344          192         78          6.6
        Difference          18          -$13,737      $2,100       -$7          0.01        0           76          32           -7          5           0.6
        % Difference        5.13%       -5.81%        1.24%        -6.09%       1.05%       0.00%       10.58%      10.26%       -3.52%      6.85%       10.00%


              Real Estate Data ©2010 Real Estate Center at Texas A and M University and HAR. Data computations ©2010 Prudential Gary Greene, Realtors.
Sales        Sold
                                        Average       Median       Price        to List     Coop        New         Active       Pending                 Months
Year    Month               Sales       Price         Price        per Sqft     Price       Sales       Listings    Listings     Sales       DOM         Inventory
Area:   25- Far West

2009    YTD                 1465        $133,542      $118,590     $60          96%         91%         2,461       1,015        1,148       86          4.6
2010    YTD                 1550        $140,440      $121,000     $64          97%         91%         3,070       1,150        1,183       62          5.1
        Difference          85          $6,898        $2,410       $4           0.01        0           609         135          35          -24         0.5
        % Difference        5.80%       5.17%         2.03%        6.67%        1.04%       0.00%       24.75%      13.30%       3.05%       -27.91%     10.87%


Area:   26- Waller County

2009    YTD                 93          $106,642      $80,000      $62          96%         73%         231         144          80          121         7.9
2010    YTD                 114         $137,177      $111,000     $66          95%         71%         283         161          91          104         10.5
        Difference          21          $30,535       $31,000      $4           -0.01       -0.02       52          17           11          -17         2.6
        % Difference        22.58%      28.63%        38.75%       6.45%        -1.04%      -2.74%      22.51%      11.81%       13.75%      -14.05%     32.91%


Area:   28- Alief Area

2009    YTD                 382         $97,216       $87,780      $52          96%         87%         699         322          292         90          6.0
2010    YTD                 370         $95,913       $90,000      $51          96%         88%         791         333          290         71          5.9
        Difference          -12         -$1,303       $2,220       -$1          0           0.01        92          11           -2          -19         -0.1
        % Difference        -3.14%      -1.34%        2.53%        -1.92%       0.00%       1.15%       13.16%      3.42%        -0.68%      -21.11%     -1.67%


Area:   29 - Fort Bend - Sugar Land/Stafford

2009    YTD                 781         $272,667      $233,800     $96          94%         88%         1,567       594          496         73          4.9
2010    YTD                 872         $281,082      $244,250     $99          95%         89%         1,826       689          455         64          5.2
        Difference          91          $8,415        $10,450      $3           0.01        0.01        259         95           -41         -9          0.3
        % Difference        11.65%      3.09%         4.47%        3.13%        1.06%       1.14%       16.53%      15.99%       -8.27%      -12.33%     6.12%


Area:   30 - Fort Bend East - Missouri City

2009    YTD                 735         $220,061      $190,000     $81          95%         85%         1,293       580          556         94          6.0
2010    YTD                 762         $221,983      $190,000     $84          95%         89%         1,649       677          524         73          6.3
        Difference          27          $1,922        $0           $3           0           0.04        356         97           -32         -21         0.3
        % Difference        3.67%       0.87%         0.00%        3.70%        0.00%       4.71%       27.53%      16.72%       -5.76%      -22.34%     5.00%


Area:   31-West

2009    YTD                 392         $292,936      $218,500     $107         95%         88%         781         390          246         96          6.4
2010    YTD                 434         $305,178      $220,000     $112         97%         89%         929         402          182         75          6.6
        Difference          42          $12,242       $1,500       $5           0.02        0.01        148         12           -64         -21         0.2
        % Difference        10.71%      4.18%         0.69%        4.67%        2.11%       1.14%       18.95%      3.08%        -26.02%     -21.88%     3.12%


Area:   32- Far Northeast

2009    YTD                 578         $210,132      $175,000     $78          97%         74%         1,106       455          395         79          5.5
2010    YTD                 559         $218,087      $174,440     $82          97%         77%         1,210       506          384         71          5.9
        Difference          -19         $7,955        -$560        $4           0           0.03        104         51           -11         -8          0.4
        % Difference        -3.29%      3.79%         -0.32%       5.13%        0.00%       4.05%       9.40%       11.21%       -2.78%      -10.13%     7.27%


Area:   33- Galveston

2009    YTD                 1890        $181,631      $155,000     $83          95%         77%         3,831       2,021        1,263       90          7.2
2010    YTD                 1888        $199,062      $165,000     $91          95%         79%         4,851       2,730        1,171       88          10.1
        Difference          -2          $17,431       $10,000      $8           0           0.02        1020        709          -92         -2          2.9
        % Difference        -0.11%      9.60%         6.45%        9.64%        0.00%       2.60%       26.62%      35.08%       -7.28%      -2.22%      40.28%


              Real Estate Data ©2010 Real Estate Center at Texas A and M University and HAR. Data computations ©2010 Prudential Gary Greene, Realtors.
Sales        Sold
                                        Average       Median       Price        to List     Coop        New         Active       Pending                 Months
Year    Month              Sales        Price         Price        per Sqft     Price       Sales       Listings    Listings     Sales       DOM         Inventory
Area:   34- Aldine Westfield

2009    YTD                135          $74,754       $69,800      $48          94%         79%         277         186          119         94          8.4
2010    YTD                158          $82,064       $78,000      $53          95%         84%         349         189          131         85          8.3
        Difference         23           $7,310        $8,200       $5           0.01        0.05        72          3            12          -9          -0.1
        % Difference       17.04%       9.78%         11.75%       10.42%       1.06%       6.33%       25.99%      1.61%        10.08%      -9.57%      -1.19%


Area:   35- Hempstead West

2009    YTD                724          $199,066      $165,720     $76          95%         90%         1,393       614          525         83          5.9
2010    YTD                767          $199,859      $165,000     $76          96%         91%         1,600       679          499         73          6.0
        Difference         43           $793          -$720        $0           0.01        0.01        207         65           -26         -10         0.1
        % Difference       5.94%        0.40%         -0.43%       0.00%        1.05%       1.11%       14.86%      10.59%       -4.95%      -12.05%     1.69%


Area:   36 - South Katy Area

2009    YTD                1596         $258,204      $232,000     $88          95%         91%         2,402       854          1,057       77          3.8
2010    YTD                1605         $269,314      $240,000     $90          96%         91%         2,981       926          960         56          3.9
        Difference         9            $11,110       $8,000       $2           0.01        0           579         72           -97         -21         0.1
        % Difference       0.56%        4.30%         3.45%        2.27%        1.05%       0.00%       24.10%      8.43%        -9.18%      -27.27%     2.63%


Area:   37 - Fort Bend West

2009    YTD                1080         $182,447      $156,000     $71          95%         90%         1,874       817          816         93          5.2
2010    YTD                1034         $180,882      $155,000     $73          95%         91%         2,328       960          710         70          6.1
        Difference         -46          -$1,565       -$1,000      $2           0           0.01        454         143          -106        -23         0.9
        % Difference       -4.26%       -0.86%        -0.64%       2.82%        0.00%       1.11%       24.23%      17.50%       -12.99%     -24.73%     17.31%


Area:   38 - Fort Bend East

2009    YTD                876          $157,857      $125,660     $66          94%         88%         1,455       647          682         95          4.6
2010    YTD                830          $170,703      $136,000     $70          96%         88%         1,710       746          595         72          6.1
        Difference         -46          $12,846       $10,340      $4           0.02        0           255         99           -87         -23         1.5
        % Difference       -5.25%       8.14%         8.23%        6.06%        2.13%       0.00%       17.53%      15.30%       -12.76%     -24.21%     32.61%


Area:   39 - Montgomery County Northwest

2009    YTD                665          $234,286      $177,000     $95          95%         80%         1,476       903          451         109         10.1
2010    YTD                646          $244,614      $179,450     $100         95%         86%         1,634       885          411         92          9.5
        Difference         -19          $10,328       $2,450       $5           0           0.06        158         -18          -40         -17         -0.6
        % Difference       -2.86%       4.41%         1.38%        5.26%        0.00%       7.50%       10.70%      -1.99%       -8.87%      -15.60%     -5.94%


Area:   40 - Montgomery County Southeast

2009    YTD                253          $155,595      $137,500     $71          95%         79%         573         296          202         98          8.1
2010    YTD                326          $163,869      $149,000     $74          95%         79%         719         360          221         78          7.9
        Difference         73           $8,274        $11,500      $3           0           0           146         64           19          -20         -0.2
        % Difference       28.85%       5.32%         8.36%        4.23%        0.00%       0.00%       25.48%      21.62%       9.41%       -20.41%     -2.47%


Area:   41 - Montgomery County Northwest

2009    YTD                9            $70,917       $60,000      $39          86%         67%         13          15           5           112         15.1
2010    YTD                10           $104,872      $110,860     $60          94%         40%         20          18           8           126         14.1
        Difference         1            $33,955       $50,860      $21          0.08        -0.27       7           3            3           14          -1
        % Difference       11.11%       47.88%        84.77%       53.85%       9.30%       0.00%       53.85%      20.00%       60.00%      12.50%      -6.62%


              Real Estate Data ©2010 Real Estate Center at Texas A and M University and HAR. Data computations ©2010 Prudential Gary Greene, Realtors.
Sales        Sold
                                        Average       Median       Price        to List     Coop        New         Active       Pending                 Months
Year    Month              Sales        Price         Price        per Sqft     Price       Sales       Listings    Listings     Sales       DOM         Inventory
Area:   42 - Liberty County

2009    YTD                41           $96,827       $83,000      $58          92%         39%         128         114          31          151         17.2
2010    YTD                42           $109,564      $80,500      $68          93%         40%         155         117          28          181         16.7
        Difference         1            $12,737       -$2,500      $10          0.01        0.01        27          3            -3          30          -0.5
        % Difference       2.44%        13.15%        -3.01%       17.24%       1.09%       2.56%       21.09%      2.63%        -9.68%      19.87%      -2.91%


Area:   43 - Walker County

2009    YTD                150          $136,498      $128,950     $75          95%         50%         316         173          127         101         8.5
2010    YTD                121          $126,851      $121,000     $68          94%         55%         315         194          91          104         9.2
        Difference         -29          -$9,647       -$7,950      -$7          -0.01       0.05        -1          21           -36         3           0.7
        % Difference       -19.33%      -7.07%        -6.17%       -9.33%       -1.05%      10.00%      -0.32%      12.14%       -28.35%     2.97%       8.24%


Area:   44 - Polk County

2009    YTD                172          $116,772      $88,500      $74          92%         52%         410         312          105         152         13.1
2010    YTD                152          $139,627      $106,500     $84          92%         55%         479         388          99          142         15.6
        Difference         -20          $22,855       $18,000      $10          0           0.03        69          76           -6          -10         2.5
        % Difference       -11.63%      19.57%        20.34%       13.51%       0.00%       5.77%       16.83%      24.36%       -5.71%      -6.58%      19.08%


Area:   45
2009    YTD                3            $66,667       $50,000      $48          96%         33%                     2            2           185         7.5
2010    YTD                3            $42,667       $33,000      $32          99%         67%         4           3                        94          10.0
        Difference         0            -$24,000      -$17,000     -$16         0.03        0.34        4           1            -2          -91         2.5
        % Difference       0.00%        -36.00%       -34.00%      -33.33%      3.13%       0.00%       0.00%       50.00%       200.00%     -49.19%     33.33%


Area:   46
2009    YTD                1            $30,000       $30,000      $17          78%         0%                      1                        106         12.0
2010    YTD                4            $32,000       $31,500      $19          82%         0%                      2            4           76          17.0
        Difference         3            $2,000        $1,500       $2           0.04        0           0           1            4           -30         5
        % Difference       300.00%      6.67%         5.00%        11.76%       5.13%       0.00%       0.00%       100.00%      200.00%     -28.30%     41.67%


Area:   47
2009    YTD                1            $13,000       $13,000      $10          58%         0%                      1                        45          12.0
        % Difference       0.00%        0.00%         0.00%        0.00%        0.00%       0.00%       0.00%       0.00%        0.00%       0.00%       0.00%


Area:   48
2009    YTD                11           $76,896       $47,000      $56          88%         45%         8           12           3           133         6.9
2010    YTD                13           $97,392       $87,500      $53          93%         38%         47          27           11          100         15.2
        Difference         2            $20,496       $40,500      -$3          0.05        -0.07       39          15           8           -33         8.3
        % Difference       18.18%       26.65%        86.17%       -5.36%       5.68%       -15.56%     487.50%     125.00%      0.00%       -24.81%     120.29%


Area:   49
2009    YTD                2            $105,630      $105,630     $84          92%         0%          1                        2           93
2010    YTD                2            $55,575       $55,580      $28          99%         50%         6           7            1           10          32.0
        Difference         0            -$50,055      -$50,050     -$56         0.07        0.5         5           7            -1          -83         32
        % Difference       0.00%        -47.39%       -47.38%      -66.67%      7.61%       0.00%       500.00%     0.00%        0.00%       -89.25%     #DIV/0!


Area:   50
2009    YTD                1            $114,000      $114,000     $77          99%         0%                                               45
2010    YTD                2            $37,750       $37,750      $29          89%         0%          1           1            1           101         6.0
        Difference         1            -$76,250      -$76,250     -$48         -0.1        0           1           1            1           56          6
        % Difference       100.00%      -66.89%       -66.89%      -62.34%      -10.10%     0%          0.00%       0.00%        0.00%       124.44%     0.00%


Area:   51
2009    YTD                15           $51,250       $41,680      $33          95%         60%         34          13           21          55          4.4
2010    YTD                25           $52,404       $40,500      $30          88%         96%         43          19           37          74          6.5
        Difference         10           $1,154        -$1,180      $14          -0.07       0.36        9           6            16          19          2.1
        % Difference       66.67%       2.25%         -2.83%       0.00%        -7.37%      60.00%      26.47%      46.15%       76.19%      34.55%      47.73%


              Real Estate Data ©2010 Real Estate Center at Texas A and M University and HAR. Data computations ©2010 Prudential Gary Greene, Realtors.
Sales        Sold
                                        Average       Median       Price        to List     Coop        New         Active       Pending                 Months
Year    Month              Sales        Price         Price        per Sqft     Price       Sales       Listings    Listings     Sales       DOM         Inventory

Area:   52 - Liberty County
2009    YTD                167          $89,992       $78,500      $52          96%         51%         353         190          154         94          7.0
2010    YTD                169          $95,433       $80,660      $54          95%         49%         392         243          115         94          10.2
        Difference         2            $5,441        $2,160       $2           -0.01       -0.02       39          53           -39         0           3.2
        % Difference       1.20%        6.05%         2.75%        3.85%        -1.04%      -3.92%      11.05%      27.89%       -25.32%     0.00%       45.71%


Area:   53 - Chambers County
2009    YTD                145          $174,994      $168,900     $77          96%         72%         253         138          78          133         7.0
2010    YTD                170          $170,724      $165,000     $75          97%         78%         345         164          100         77          7.4
        Difference         25           -$4,270       -$3,900      -$2          0.01        0.06        92          26           22          -56         0.4
        % Difference       17.24%       -2.44%        -2.31%       -2.60%       1.04%       8.33%       36.36%      18.84%       28.21%      -42.11%     5.71%


Area:   54
2009    YTD                22           $126,537      $116,250     $96          87%         27%         89          106          12          131         30.7
2010    YTD                28           $125,494      $107,380     $97          89%         46%         108         136          17          175         39.4
        Difference         6            -$1,043       -$8,870      $1           0.02        0.19        19          30           5           44          8.7
        % Difference       27.27%       -0.82%        -7.63%       1.04%        2.30%       70.37%      21.35%      28.30%       41.67%      33.59%      28.34%


Area:   55 - Wharton County
2009    YTD                73           $113,918      $109,000     $66          94%         45%         160         117          46          107         11.6
2010    YTD                72           $114,118      $103,150     $68          94%         57%         157         115          47          105         10.4
        Difference         -1           $200          -$5,850      $2           0           0.12        -3          -2           1           -2          -1.2
        % Difference       -1.37%       0.18%         -5.37%       3.03%        0.00%       26.67%      -1.88%      -1.71%       2.17%       -1.87%      -10.34%


Area:   56
2009    YTD                18           $97,954       $92,450      $58          92%         61%         46          52           17          103         18.2
2010    YTD                26           $143,913      $150,450     $78          94%         50%         63          53           16          136         14.7
        Difference         8            $45,959       $58,000      $20          0.02        -0.11       17          1            -1          33          -3.5
        % Difference       44.44%       46.92%        62.74%       34.48%       2.17%       -18.03%     36.96%      1.92%        -5.88%      32.04%      -19.23%


Area:   57 - Austin County
2009    YTD                94           $147,557      $134,900     $81          95%         59%         201         156          69          110         11.6
2010    YTD                57           $146,191      $137,500     $79          94%         63%         204         189          50          137         18.5
        Difference         -37          -$1,366       $2,600       -$2          -0.01       0.04        3           33           -19         27          6.9
        % Difference       -39.36%      -0.93%        1.93%        -2.47%       -1.05%      6.78%       1.49%       21.15%       -27.54%     24.55%      59.48%


Area:   58
2009    YTD                45           $168,770      $149,900     $87          95%         56%         76          51           31          117         8.8
2010    YTD                35           $178,755      $149,000     $93          94%         66%         94          59           20          131         12.5
        Difference         -10          9985          -900         6            -0.01       0.1         18          8            -11         14          3.7
        % Difference       -22.22%      5.92%         -0.60%       6.90%        -1.05%      17.86%      23.68%      15.69%       -35.48%     11.97%      42.05%


Area:   59
2009    YTD                2            $45,450       $45,450      $25          91%         50%         3           7                        39          10.5
2010    YTD                4            $85,500       $64,000      $58          93%         75%         8           7            2           55          12.6
        Difference         2            40050         18550        33           0.02        0.25        5           0            2           16          2.1
        % Difference       100.00%      88.12%        40.81%       132.00%      2.20%       50.00%      166.67%     0.00%        0.00%       41.03%      20.00%


              Real Estate Data ©2010 Real Estate Center at Texas A and M University and HAR. Data computations ©2010 Prudential Gary Greene, Realtors.
Sales        Sold

                                        Average       Median       Price        to List     Coop        New         Active       Pending                 Months
Year    Month              Sales        Price         Price        per Sqft     Price       Sales       Listings    Listings     Sales       DOM         Inventory

Area:   60
2009    YTD                46           $86,887       $70,750      $54          92%         43%         86          53           35          134         9.1
2010    YTD                34           $107,597      $87,600      $64          94%         32%         85          52           32          133         9.5
        Difference         -12          $20,710       $16,850      $10          0.02        -0.11       -1          -1           -3          -1          0.4
        % Difference       -26.09%      23.84%        23.82%       18.52%       2.17%       -25.58%     -1.16%      -1.89%       -8.57%      -0.75%      4.40%


Area:   61
2009    YTD                32           $147,838      $128,700     $74          96%         88%         67          25           29          73          5.5
2010    YTD                38           $143,541      $148,250     $84          97%         92%         95          34           37          55          5.6
        Difference         6            -$4,297       $19,550      $10          0.01        0.04        28          9            8           -18         0.1
        % Difference       18.75%       -2.91%        15.19%       13.51%       1.04%       4.55%       41.79%      36.00%       27.59%      -24.66%     1.82%


Area:   62
2009    YTD                13           $79,877       $80,000      $45          93%         0%          24          26           10          106         11.8
2010    YTD                19           $78,132       $69,000      $51          96%         37%         34          23           17          124         8.8
        Difference         6            -$1,745       -$11,000     $6           0.03        0.37        10          -3           7           18          -3
        % Difference       46.15%       -2.18%        -13.75%      13.33%       3.23%       0.00%       41.67%      -11.54%      0.00%       16.98%      -25.42%


Area:   63
2009    YTD                8            $107,838      $115,000     $41          94%         0%          15          23           5           139         21.9
2010    YTD                23           $95,587       $72,000      $56          93%         9%          70          45           14          141         27.7
        Difference         15           -$12,251      -$43,000     $15          -0.01       0.09        55          22           9           2           5.8
        % Difference       187.50%      -11.36%       -37.39%      36.59%       -1.06%      25.00%      366.67%     95.65%       0.00%       1.44%       26.48%


Area:   64 - San Jacinto County
2009    YTD                92           $155,306      $112,000     $88          93%         42%         248         152          68          133         10.6
2010    YTD                95           $136,480      $88,700      $84          93%         63%         232         190          60          110         13.7
        Difference         3            -$18,826      -$23,300     -$4          0           0.21        -16         38           -8          -23         3.1
        % Difference       3.26%        -12.12%       -20.80%      -4.55%       0.00%       50.00%      -6.45%      25.00%       -11.76%     -17.29%     29.25%


Area:   65

2010    YTD                1            $80,000       $80,000      $75          100%        0%                      6            1           154         36.0
        % Difference       0.00%        0.00%         0.00%        0.00%        0.00%       0.00%       0.00%       0.00%        0.00%       0.00%       0.00%


Area:   66

2009    YTD                1            $14,900       $14,900      $18          100%        0%                                   1           8
2010    YTD                2            $182,500      $182,500     $60          92%         50%         7           23           0           156         37
        Difference         1            $167,600      $167,600     $42          -8%         50%         7           23           -1          148         36.8
        % Difference       100.00%      1124.83%      1124.83%     233.33%      -8.00%      50.00%      0.00%       0.00%        0.00%       1850.00%    0.00%


Area:   67

2010    YTD                1            $85,000       $85,000      $26          85%         0%                      5                        35          30.0
        Difference         0            $0            $0           $0           0%          0%          0           0                        0           0
        % Difference       0.00%        0.00%         0.00%        0.00%        0.00%       0.00%       0.00%       0.00%        0.00%       0.00%       0.00%


Area:   68

2009    YTD                1            $52,400       $52,400      $44          79%         100%        1           3            0           319         36.0
        Difference         0            $0            $0           $0           0%          0%          0           0            0           0           0
        % Difference       0.00%        0.00%         0.00%        0.00%        0.00%       100.00%     100.00%     0.00%        0.00%       0.00%       0.00%


              Real Estate Data ©2010 Real Estate Center at Texas A and M University and HAR. Data computations ©2010 Prudential Gary Greene, Realtors.
Area:   69
2009    YTD                3            $146,867      $182,500     $108         98%         0%          7           12           1           37          24.8
2010    YTD                7            $190,129      $145,000     $118         83%         57%         14          19           1           109         26.7
        Difference         4            $43,262       -$37,500     $10          -15%        57%         7           7            0           72          1.9
        % Difference       133.33%      29.46%        -20.55%      9.26%        -15.31%     0.00%       0.00%       58.33%       0.00%       194.59%     7.66%


Area:   70

2010    YTD                1            $90,000       $90,000      $1           100%        100%        1           4            1           69          48.0
        % Difference       0.00%        0.00%         0.00%        0.00%        0.00%       0.00%       0.00%       0.00%        0.00%       0.00%       0.00%


Area:   72

2009    YTD                2            $73,000       $73,000      $9           91%         0%          2           3                        73          4.8
2010    YTD                4            $39,975       $40,450      $27          91%         75%         5           5            3           89          23.8
        Difference         2            -$33,025      -$32,550     $18          0%          75%         3           2            3           16          19
        % Difference       100.00%      -45.24%       -44.59%      200.00%      0.00%       100.00%     100.00%     0.00%        0.00%       21.92%      395.83%


Area:   73
2009    YTD                2            $149,500      $149,500     $79          88%         0%                      7            2           192         28.0
2010    YTD                2            $152,450      $152,450     $11          78%         50%                     7                        402         13.0
        Difference         0            $2,950        $2,950       -$68         -10%        50%         0           0            -2          210         -15
        % Difference       0.00%        1.97%         1.97%        -86.08%      -11.36%     0.00%       0.00%       0.00%        -100.00%    109.38%     -53.57%


Area:   76
2009    YTD                1            $237,867      $237,870     $96          114%        100%                    1                        97          6.0
        % Difference       0.00%        0.00%         0.00%        0.00%        0.00%       0.00%       0.00%       0.00%        0.00%       0.00%       0.00%


Area:   77
2009    YTD                10           $144,850      $118,750     $74          96%         70%         12          13           6           73          9.6
2010    YTD                8            $112,750      $122,750     $62          96%         50%         21          13           8           102         8.2
        Difference         -2           -$32,100      $4,000       -$12         0           -0.2        9           0            2           29          -1.4

        % Difference       -20.00%      -22.16%       3.37%        -16.22%      0.00%       0.00%       75.00%      0.00%        33.33%      39.73%      -14.58%


Area:   78
2009    YTD                1            $38,000       $38,000      $26          92%         0%          1           2                        30          24.0
        % Difference       0.00%        0.00%         0.00%        0.00%        0.00%       0.00%       0.00%       0.00%        0.00%       0.00%       0.00%


              Real Estate Data ©2010 Real Estate Center at Texas A and M University and HAR. Data computations ©2010 Prudential Gary Greene, Realtors.

Weitere ähnliche Inhalte

Was ist angesagt?

Mk version2
Mk version2Mk version2
Mk version2owlpics
 
Middlesex Water Company Shareholder Presentation
Middlesex Water Company Shareholder PresentationMiddlesex Water Company Shareholder Presentation
Middlesex Water Company Shareholder PresentationCompany Spotlight
 
2012 Investment Review (Us)
2012 Investment Review (Us)2012 Investment Review (Us)
2012 Investment Review (Us)andrewyoungkofc
 
Strategic Valuation of Pizza Market leaders
Strategic Valuation of Pizza Market leadersStrategic Valuation of Pizza Market leaders
Strategic Valuation of Pizza Market leadersaxvacho
 
1Q10 final
1Q10 final 1Q10 final
1Q10 final Localiza
 
H W 2010 07 De
H W 2010 07 DeH W 2010 07 De
H W 2010 07 Dechipwags
 
30-06-2012 - 2Q12 Results Presentation
30-06-2012 - 2Q12 Results Presentation30-06-2012 - 2Q12 Results Presentation
30-06-2012 - 2Q12 Results Presentationsonaeri
 
ecolab 2003BusinessDescription
ecolab  2003BusinessDescriptionecolab  2003BusinessDescription
ecolab 2003BusinessDescriptionfinance37
 
brunswick annual reports 2006
brunswick annual reports 2006brunswick annual reports 2006
brunswick annual reports 2006finance36
 
Financial Statement Analysis
Financial Statement AnalysisFinancial Statement Analysis
Financial Statement Analysismmclean487
 
Tech M&A Outlook - presented by Mgi research bloomberg l.p. march 2012 conf...
Tech M&A Outlook - presented by Mgi research   bloomberg l.p. march 2012 conf...Tech M&A Outlook - presented by Mgi research   bloomberg l.p. march 2012 conf...
Tech M&A Outlook - presented by Mgi research bloomberg l.p. march 2012 conf...MGI_Research
 
Analysis of S&P500 financial sector
Analysis of S&P500 financial sectorAnalysis of S&P500 financial sector
Analysis of S&P500 financial sectorJean. G. Ndoutoum
 

Was ist angesagt? (19)

Dalkeith
DalkeithDalkeith
Dalkeith
 
Mk version2
Mk version2Mk version2
Mk version2
 
2010 HAR REALTOR® Expo- Ted Jones, PhD
2010 HAR REALTOR® Expo- Ted Jones, PhD2010 HAR REALTOR® Expo- Ted Jones, PhD
2010 HAR REALTOR® Expo- Ted Jones, PhD
 
Middlesex Water Company Shareholder Presentation
Middlesex Water Company Shareholder PresentationMiddlesex Water Company Shareholder Presentation
Middlesex Water Company Shareholder Presentation
 
Jan Tmo
Jan TmoJan Tmo
Jan Tmo
 
Wmt Model Template
Wmt Model TemplateWmt Model Template
Wmt Model Template
 
2012 Investment Review (Us)
2012 Investment Review (Us)2012 Investment Review (Us)
2012 Investment Review (Us)
 
Strategic Valuation of Pizza Market leaders
Strategic Valuation of Pizza Market leadersStrategic Valuation of Pizza Market leaders
Strategic Valuation of Pizza Market leaders
 
1Q10 final
1Q10 final 1Q10 final
1Q10 final
 
H W 2010 07 De
H W 2010 07 DeH W 2010 07 De
H W 2010 07 De
 
Ohl Apr Eng
Ohl Apr EngOhl Apr Eng
Ohl Apr Eng
 
1
11
1
 
30-06-2012 - 2Q12 Results Presentation
30-06-2012 - 2Q12 Results Presentation30-06-2012 - 2Q12 Results Presentation
30-06-2012 - 2Q12 Results Presentation
 
ecolab 2003BusinessDescription
ecolab  2003BusinessDescriptionecolab  2003BusinessDescription
ecolab 2003BusinessDescription
 
2011 Orange County Development Briefing
2011 Orange County Development Briefing2011 Orange County Development Briefing
2011 Orange County Development Briefing
 
brunswick annual reports 2006
brunswick annual reports 2006brunswick annual reports 2006
brunswick annual reports 2006
 
Financial Statement Analysis
Financial Statement AnalysisFinancial Statement Analysis
Financial Statement Analysis
 
Tech M&A Outlook - presented by Mgi research bloomberg l.p. march 2012 conf...
Tech M&A Outlook - presented by Mgi research   bloomberg l.p. march 2012 conf...Tech M&A Outlook - presented by Mgi research   bloomberg l.p. march 2012 conf...
Tech M&A Outlook - presented by Mgi research bloomberg l.p. march 2012 conf...
 
Analysis of S&P500 financial sector
Analysis of S&P500 financial sectorAnalysis of S&P500 financial sector
Analysis of S&P500 financial sector
 

Ähnlich wie Houston Market Report July 2010

Caída Publicidad EEUU 2009
Caída Publicidad EEUU 2009Caída Publicidad EEUU 2009
Caída Publicidad EEUU 2009Juan Varela
 
Palm Springs Area Listings Sold By Calendar Quarter (Through March 2010)
Palm Springs Area Listings Sold By Calendar Quarter (Through March 2010)Palm Springs Area Listings Sold By Calendar Quarter (Through March 2010)
Palm Springs Area Listings Sold By Calendar Quarter (Through March 2010)SDM: Music Venture
 
Naa Annual Newspaper Ad Expenditures 09
Naa Annual Newspaper Ad Expenditures 09Naa Annual Newspaper Ad Expenditures 09
Naa Annual Newspaper Ad Expenditures 09Juan Varela
 
Federal Budget Outlays
Federal Budget OutlaysFederal Budget Outlays
Federal Budget Outlaysbrucekaufman
 
Vancouver real estate february 2012 stats package rebgv
Vancouver real estate february 2012 stats package rebgvVancouver real estate february 2012 stats package rebgv
Vancouver real estate february 2012 stats package rebgvMatt Collinge
 
101842285 july-2012-rebgv-stats-package-adam-scalena
101842285 july-2012-rebgv-stats-package-adam-scalena101842285 july-2012-rebgv-stats-package-adam-scalena
101842285 july-2012-rebgv-stats-package-adam-scalenavancouverhomesteam
 
Gta office market statistics q3 2011
Gta office market statistics q3 2011Gta office market statistics q3 2011
Gta office market statistics q3 2011Chris Fyvie
 
REBGV Stats Package August 2012
REBGV Stats Package August 2012REBGV Stats Package August 2012
REBGV Stats Package August 2012vancouverhomesteam
 
Electronic Security Expo 2012 Attrition Toolbox
Electronic Security Expo 2012 Attrition ToolboxElectronic Security Expo 2012 Attrition Toolbox
Electronic Security Expo 2012 Attrition Toolboxstevespott
 
Realogics Urbnlivn Presentation
Realogics Urbnlivn PresentationRealogics Urbnlivn Presentation
Realogics Urbnlivn Presentationurbnlivn
 
July 2021 - Market Report
July 2021 - Market Report July 2021 - Market Report
July 2021 - Market Report Michelle Makos
 
Chicagoland Quarterly Supply/Demand Report - 7/1/2011
Chicagoland Quarterly Supply/Demand Report - 7/1/2011Chicagoland Quarterly Supply/Demand Report - 7/1/2011
Chicagoland Quarterly Supply/Demand Report - 7/1/2011chipwags
 
Vancouver real estate rebgv stats package january 2011
Vancouver real estate rebgv stats package january 2011Vancouver real estate rebgv stats package january 2011
Vancouver real estate rebgv stats package january 2011Matt Collinge
 
2008 Annual Newspaper Ad Expenditures
2008 Annual Newspaper Ad Expenditures2008 Annual Newspaper Ad Expenditures
2008 Annual Newspaper Ad ExpendituresJuan Varela
 
Vancouver Real Estate December 2012 Stats Package REBGV
Vancouver Real Estate December 2012 Stats Package REBGVVancouver Real Estate December 2012 Stats Package REBGV
Vancouver Real Estate December 2012 Stats Package REBGVMatt Collinge
 

Ähnlich wie Houston Market Report July 2010 (20)

Caída Publicidad EEUU 2009
Caída Publicidad EEUU 2009Caída Publicidad EEUU 2009
Caída Publicidad EEUU 2009
 
Palm Springs Area Listings Sold By Calendar Quarter (Through March 2010)
Palm Springs Area Listings Sold By Calendar Quarter (Through March 2010)Palm Springs Area Listings Sold By Calendar Quarter (Through March 2010)
Palm Springs Area Listings Sold By Calendar Quarter (Through March 2010)
 
Roy Fisher Outlook 2012
Roy Fisher Outlook 2012Roy Fisher Outlook 2012
Roy Fisher Outlook 2012
 
Naa Annual Newspaper Ad Expenditures 09
Naa Annual Newspaper Ad Expenditures 09Naa Annual Newspaper Ad Expenditures 09
Naa Annual Newspaper Ad Expenditures 09
 
Rebgv june 2012 stats
Rebgv june 2012 statsRebgv june 2012 stats
Rebgv june 2012 stats
 
Federal Budget Outlays
Federal Budget OutlaysFederal Budget Outlays
Federal Budget Outlays
 
Vancouver real estate february 2012 stats package rebgv
Vancouver real estate february 2012 stats package rebgvVancouver real estate february 2012 stats package rebgv
Vancouver real estate february 2012 stats package rebgv
 
101842285 july-2012-rebgv-stats-package-adam-scalena
101842285 july-2012-rebgv-stats-package-adam-scalena101842285 july-2012-rebgv-stats-package-adam-scalena
101842285 july-2012-rebgv-stats-package-adam-scalena
 
Gta office market statistics q3 2011
Gta office market statistics q3 2011Gta office market statistics q3 2011
Gta office market statistics q3 2011
 
REBGV Stats Package Oct 2012
REBGV Stats Package Oct 2012REBGV Stats Package Oct 2012
REBGV Stats Package Oct 2012
 
REBGV Stats Package August 2012
REBGV Stats Package August 2012REBGV Stats Package August 2012
REBGV Stats Package August 2012
 
Monthly Market Watch - September 2012
Monthly Market Watch - September 2012Monthly Market Watch - September 2012
Monthly Market Watch - September 2012
 
Electronic Security Expo 2012 Attrition Toolbox
Electronic Security Expo 2012 Attrition ToolboxElectronic Security Expo 2012 Attrition Toolbox
Electronic Security Expo 2012 Attrition Toolbox
 
Realogics Urbnlivn Presentation
Realogics Urbnlivn PresentationRealogics Urbnlivn Presentation
Realogics Urbnlivn Presentation
 
July 2021 - Market Report
July 2021 - Market Report July 2021 - Market Report
July 2021 - Market Report
 
Chicagoland Quarterly Supply/Demand Report - 7/1/2011
Chicagoland Quarterly Supply/Demand Report - 7/1/2011Chicagoland Quarterly Supply/Demand Report - 7/1/2011
Chicagoland Quarterly Supply/Demand Report - 7/1/2011
 
Vancouver real estate rebgv stats package january 2011
Vancouver real estate rebgv stats package january 2011Vancouver real estate rebgv stats package january 2011
Vancouver real estate rebgv stats package january 2011
 
Coldwell Banker C&C Properties Sales Dec 2010
Coldwell Banker C&C Properties Sales Dec 2010Coldwell Banker C&C Properties Sales Dec 2010
Coldwell Banker C&C Properties Sales Dec 2010
 
2008 Annual Newspaper Ad Expenditures
2008 Annual Newspaper Ad Expenditures2008 Annual Newspaper Ad Expenditures
2008 Annual Newspaper Ad Expenditures
 
Vancouver Real Estate December 2012 Stats Package REBGV
Vancouver Real Estate December 2012 Stats Package REBGVVancouver Real Estate December 2012 Stats Package REBGV
Vancouver Real Estate December 2012 Stats Package REBGV
 

Houston Market Report July 2010

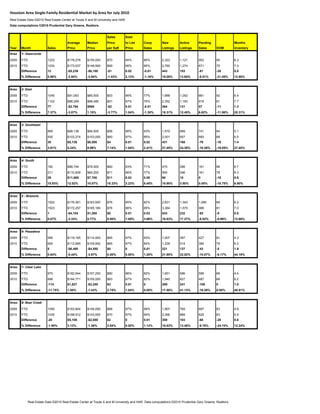
  • 1. Houston Area Single‐Family Residential Market by Area for July 2010 Real Estate Data ©2010 Real Estate Center at Texas A and M University and HAR. Data computations ©2010 Prudential Gary Greene, Realtors. Sales Sold Average Median Price to List Coop New Active Pending Months Year Month Sales Price Price per Sqft Price Sales Listings Listings Sales DOM Inventory Area 1- Atascocita 2009 YTD 1222 $178,276 $155,000 $70 94% 86% 2,322 1,121 952 95 6.2 2010 YTD 1234 $173,037 $148,900 $69 96% 85% 2,765 1,274 871 75 7.0 Difference 12 -$5,239 -$6,100 -$1 0.02 -0.01 443 153 -81 -20 0.8 % Difference 0.98% -2.94% -3.94% -1.43% 2.13% -1.16% 19.08% 13.65% -8.51% -21.05% 12.90% Area 2- East 2009 YTD 1045 $91,093 $85,500 $53 96% 77% 1,988 1,052 861 92 6.4 2010 YTD 1122 $88,299 $86,480 $51 97% 76% 2,352 1,183 918 81 7.7 Difference 77 -$2,794 $980 -$2 0.01 -0.01 364 131 57 -11 1.3 % Difference 7.37% -3.07% 1.15% -3.77% 1.04% -1.30% 18.31% 12.45% 6.62% -11.96% 20.31% Area 3- Southeast 2009 YTD 895 $98,136 $94,500 $56 96% 83% 1,570 689 741 84 5.1 2010 YTD 930 $103,274 $103,000 $60 97% 85% 2,001 857 665 68 6.5 Difference 35 $5,138 $8,500 $4 0.01 0.02 431 168 -76 -16 1.4 % Difference 3.91% 5.24% 8.99% 7.14% 1.04% 2.41% 27.45% 24.38% -10.26% -19.05% 27.45% Area 4- South 2009 YTD 182 $98,744 $76,500 $60 93% 71% 475 286 161 96 8.7 2010 YTD 211 $110,609 $84,200 $71 96% 77% 565 296 161 78 9.3 Difference 29 $11,865 $7,700 $11 0.03 0.06 90 10 0 -18 0.6 % Difference 15.93% 12.02% 10.07% 18.33% 3.23% 8.45% 18.95% 3.50% 0.00% -18.75% 6.90% Area: 5 - Brazoria 2009 YTD 1522 $176,361 $163,920 $76 95% 82% 2,831 1,343 1,080 89 6.2 2010 YTD 1523 $172,257 $165,180 $76 96% 85% 3,364 1,575 988 81 7.0 Difference 1 -$4,104 $1,260 $0 0.01 0.03 533 232 -92 -8 0.8 % Difference 0.07% -2.33% 0.77% 0.00% 1.05% 3.66% 18.83% 17.27% -8.52% -8.99% 12.90% Area: 6- Pasadena 2009 YTD 595 $119,165 $114,500 $65 97% 83% 1,007 387 427 81 4.3 2010 YTD 600 $112,685 $109,950 $65 97% 84% 1,228 514 384 76 6.2 Difference 5 -$6,480 -$4,550 $0 0 0.01 221 127 -43 -5 1.9 % Difference 0.84% -5.44% -3.97% 0.00% 0.00% 1.20% 21.95% 32.82% -10.07% -6.17% 44.19% Area: 7- Clear Lake 2009 YTD 970 $182,944 $157,250 $80 96% 82% 1,651 586 596 66 4.4 2010 YTD 856 $184,771 $155,000 $83 97% 82% 1,940 827 487 66 6.2 Difference -114 $1,827 -$2,250 $3 0.01 0 289 241 -109 0 1.8 % Difference -11.75% 1.00% -1.43% 3.75% 1.04% 0.00% 17.50% 41.13% -18.29% 0.00% 40.91% Area: 8- Bear Creek 2009 YTD 1050 $163,804 $145,000 $68 97% 89% 1,907 765 697 83 4.9 2010 YTD 1030 $168,912 $143,000 $70 97% 90% 2,266 868 629 63 5.5 Difference -20 $5,108 -$2,000 $2 0 0.01 359 103 -68 -20 0.6 % Difference -1.90% 3.12% -1.38% 2.94% 0.00% 1.12% 18.83% 13.46% -9.76% -24.10% 12.24% Real Estate Data ©2010 Real Estate Center at Texas A and M University and HAR. Data computations ©2010 Prudential Gary Greene, Realtors.
  • 2. Sales Sold Average Median Price to List Coop New Active Pending Months Year Month Sales Price Price per Sqft Price Sales Listings Listings Sales DOM Inventory Area: 9- The Heights 2009 YTD 1023 $250,979 $238,000 $136 96% 83% 2,232 1,104 572 85 7.3 2010 YTD 1091 $258,827 $249,000 $143 97% 81% 2,388 1,123 542 68 6.9 Difference 68 $7,848 $11,000 $7 0.01 -0.02 156 19 -30 -17 -0.4 % Difference 6.65% 3.13% 4.62% 5.15% 1.04% -2.41% 6.99% 1.72% -5.24% -20.00% -5.48% Area: 10- Hempstead East 2009 YTD 1005 $178,182 $159,900 $71 96% 89% 1,796 730 650 84 4.9 2010 YTD 1070 $172,903 $154,500 $71 97% 89% 2,215 888 627 68 5.8 Difference 65 -$5,279 -$5,400 $0 0.01 0 419 158 -23 -16 0.9 % Difference 6.47% -2.96% -3.38% 0.00% 1.04% 0.00% 23.33% 21.64% -3.54% -19.05% 18.37% Area: 11-Near North 2009 YTD 491 $92,983 $85,000 $51 96% 87% 902 441 413 88 5.7 2010 YTD 574 $96,005 $89,900 $53 97% 87% 1,113 456 451 70 5.7 Difference 83 $3,022 $4,900 $2 0.01 0 211 15 38 -18 0 % Difference 16.90% 3.25% 5.76% 3.92% 1.04% 0.00% 23.39% 3.40% 9.20% -20.45% 0.00% Area: 12- North 2009 YTD 1013 $100,921 $95,000 $50 97% 89% 1,604 778 835 85 5.4 2010 YTD 1011 $101,780 $95,550 $51 98% 88% 1,783 713 790 68 4.9 Difference -2 $859 $550 $1 0.01 -0.01 179 -65 -45 -17 -0.5 % Difference -0.20% 0.85% 0.58% 2.00% 1.03% -1.12% 11.16% -8.35% -5.39% -20.00% -9.26% Area: 13- Northwest 2009 YTD 1293 $156,175 $136,000 $60 97% 87% 2,440 1,111 956 91 5.6 2010 YTD 1243 $160,723 $139,950 $62 96% 88% 2,834 1,217 849 75 6.4 Difference -50 $4,548 $3,950 $2 -0.01 0.01 394 106 -107 -16 0.8 % Difference -3.87% 2.91% 2.90% 3.33% -1.03% 1.15% 16.15% 9.54% -11.19% -17.58% 14.29% Area: 14- Far Northwest 2009 YTD 929 $195,233 $151,000 $77 95% 85% 1,804 821 638 95 6.0 2010 YTD 951 $205,183 $154,000 $80 95% 89% 2,050 903 581 75 6.4 Difference 22 $9,950 $3,000 $3 0 0.04 246 82 -57 -20 0.4 % Difference 2.37% 5.10% 1.99% 3.90% 0.00% 4.71% 13.64% 9.99% -8.93% -21.05% 6.67% Area: 15-Montgomery County Southwest 2009 YTD 1814 $276,106 $212,000 $101 96% 83% 3,753 1,676 1,244 79 6.4 2010 YTD 1899 $278,772 $212,000 $103 96% 85% 4,230 1,788 1,260 75 6.6 Difference 85 $2,666 $0 $2 0 0.02 477 112 16 -4 0.2 % Difference 4.69% 0.97% 0.00% 1.98% 0.00% 2.41% 12.71% 6.68% 1.29% -5.06% 3.12% Area: 16- Central Inner Loop 2009 YTD 358 $549,669 $370,000 $207 95% 81% 997 557 188 85 10.0 2010 YTD 389 $634,874 $419,000 $220 94% 84% 968 524 181 103 9.5 Difference 31 $85,205 $49,000 $13 -0.01 0.03 -29 -33 -7 18 -0.5 % Difference 8.66% 15.50% 13.24% 6.28% -1.05% 3.70% -2.91% -5.92% -3.72% 21.18% -5.00% Real Estate Data ©2010 Real Estate Center at Texas A and M University and HAR. Data computations ©2010 Prudential Gary Greene, Realtors.
  • 3. Sales Sold Average Median Price to List Coop New Active Pending Months Year Month Sales Price Price per Sqft Price Sales Listings Listings Sales DOM Inventory Area: 17-Southwest Inner Loop 2009 YTD 497 $704,246 $640,000 $220 95% 81% 1,277 726 181 91 10.1 2010 YTD 589 $675,724 $589,000 $219 95% 85% 1,198 635 186 86 8.0 Difference 92 -$28,522 -$51,000 -$1 0 0.04 -79 -91 5 -5 -2.1 % Difference 18.51% -4.05% -7.97% -0.45% 0.00% 4.94% -6.19% -12.53% 2.76% -5.49% -20.79% Area: 18- South Central 2009 YTD 134 $80,284 $70,000 $48 98% 85% 243 120 117 83 5.8 2010 YTD 103 $93,603 $84,950 $57 98% 77% 273 110 68 68 6.7 Difference -31 $13,319 $14,950 $9 0 -0.08 30 -10 -49 -15 0.9 % Difference -23.13% 16.59% 21.36% 18.75% 0.00% -9.41% 12.35% -8.33% -41.88% -18.07% 15.52% Area: 19- Montgomery County Northeast 2009 YTD 414 $134,485 $109,000 $68 95% 71% 862 454 341 95 6.6 2010 YTD 498 $136,345 $113,500 $66 96% 82% 957 466 333 84 6.9 Difference 84 $1,860 $4,500 -$2 0.01 0.11 95 12 -8 -11 0.3 % Difference 20.29% 1.38% 4.13% -2.94% 1.05% 15.49% 11.02% 2.64% -2.35% -11.58% 4.55% Area: 20- Bellaire South 2009 YTD 528 $172,347 $145,000 $84 96% 85% 912 385 327 70 4.8 2010 YTD 479 $186,602 $155,000 $88 96% 88% 1,034 421 281 64 5.7 Difference -49 $14,255 $10,000 $4 0 0.03 122 36 -46 -6 0.9 % Difference -9.28% 8.27% 6.90% 4.76% 0.00% 3.53% 13.38% 9.35% -14.07% -8.57% 18.75% Area: 21-Bellaire West 2009 YTD 126 $116,728 $115,500 $63 96% 88% 216 86 88 90 4.8 2010 YTD 111 $122,383 $116,250 $65 94% 83% 251 105 66 64 5.8 Difference -15 $5,655 $750 $2 -0.02 -0.05 35 19 -22 -26 1 % Difference -11.90% 4.84% 0.65% 3.17% -2.08% -5.68% 16.20% 22.09% -25.00% -28.89% 20.83% Area: 22 - Central West 2009 YTD 223 $604,030 $450,000 $197 94% 79% 576 360 89 92 10.3 2010 YTD 272 $645,006 $480,000 $202 94% 85% 641 354 94 99 8.7 Difference 49 $40,976 $30,000 $5 0 0.06 65 -6 5 7 -1.6 % Difference 21.97% 6.78% 6.67% 2.54% 0.00% 7.59% 11.28% -1.67% 5.62% 7.61% -15.53% Area: 23- Memorial 2009 YTD 307 $837,985 $575,000 $215 94% 82% 743 370 140 90 8.0 2010 YTD 386 $803,689 $559,980 $214 93% 83% 717 313 124 90 6.3 Difference 79 -$34,296 -$15,020 -$1 -0.01 0.01 -26 -57 -16 0 -1.7 % Difference 25.73% -4.09% -2.61% -0.47% -1.06% 1.22% -3.50% -15.41% -11.43% 0.00% -21.25% Area: 24 - Spring Branch 2009 YTD 351 $236,440 $169,900 $115 95% 84% 718 312 199 73 6.0 2010 YTD 369 $222,703 $172,000 $108 96% 84% 794 344 192 78 6.6 Difference 18 -$13,737 $2,100 -$7 0.01 0 76 32 -7 5 0.6 % Difference 5.13% -5.81% 1.24% -6.09% 1.05% 0.00% 10.58% 10.26% -3.52% 6.85% 10.00% Real Estate Data ©2010 Real Estate Center at Texas A and M University and HAR. Data computations ©2010 Prudential Gary Greene, Realtors.
  • 4. Sales Sold Average Median Price to List Coop New Active Pending Months Year Month Sales Price Price per Sqft Price Sales Listings Listings Sales DOM Inventory Area: 25- Far West 2009 YTD 1465 $133,542 $118,590 $60 96% 91% 2,461 1,015 1,148 86 4.6 2010 YTD 1550 $140,440 $121,000 $64 97% 91% 3,070 1,150 1,183 62 5.1 Difference 85 $6,898 $2,410 $4 0.01 0 609 135 35 -24 0.5 % Difference 5.80% 5.17% 2.03% 6.67% 1.04% 0.00% 24.75% 13.30% 3.05% -27.91% 10.87% Area: 26- Waller County 2009 YTD 93 $106,642 $80,000 $62 96% 73% 231 144 80 121 7.9 2010 YTD 114 $137,177 $111,000 $66 95% 71% 283 161 91 104 10.5 Difference 21 $30,535 $31,000 $4 -0.01 -0.02 52 17 11 -17 2.6 % Difference 22.58% 28.63% 38.75% 6.45% -1.04% -2.74% 22.51% 11.81% 13.75% -14.05% 32.91% Area: 28- Alief Area 2009 YTD 382 $97,216 $87,780 $52 96% 87% 699 322 292 90 6.0 2010 YTD 370 $95,913 $90,000 $51 96% 88% 791 333 290 71 5.9 Difference -12 -$1,303 $2,220 -$1 0 0.01 92 11 -2 -19 -0.1 % Difference -3.14% -1.34% 2.53% -1.92% 0.00% 1.15% 13.16% 3.42% -0.68% -21.11% -1.67% Area: 29 - Fort Bend - Sugar Land/Stafford 2009 YTD 781 $272,667 $233,800 $96 94% 88% 1,567 594 496 73 4.9 2010 YTD 872 $281,082 $244,250 $99 95% 89% 1,826 689 455 64 5.2 Difference 91 $8,415 $10,450 $3 0.01 0.01 259 95 -41 -9 0.3 % Difference 11.65% 3.09% 4.47% 3.13% 1.06% 1.14% 16.53% 15.99% -8.27% -12.33% 6.12% Area: 30 - Fort Bend East - Missouri City 2009 YTD 735 $220,061 $190,000 $81 95% 85% 1,293 580 556 94 6.0 2010 YTD 762 $221,983 $190,000 $84 95% 89% 1,649 677 524 73 6.3 Difference 27 $1,922 $0 $3 0 0.04 356 97 -32 -21 0.3 % Difference 3.67% 0.87% 0.00% 3.70% 0.00% 4.71% 27.53% 16.72% -5.76% -22.34% 5.00% Area: 31-West 2009 YTD 392 $292,936 $218,500 $107 95% 88% 781 390 246 96 6.4 2010 YTD 434 $305,178 $220,000 $112 97% 89% 929 402 182 75 6.6 Difference 42 $12,242 $1,500 $5 0.02 0.01 148 12 -64 -21 0.2 % Difference 10.71% 4.18% 0.69% 4.67% 2.11% 1.14% 18.95% 3.08% -26.02% -21.88% 3.12% Area: 32- Far Northeast 2009 YTD 578 $210,132 $175,000 $78 97% 74% 1,106 455 395 79 5.5 2010 YTD 559 $218,087 $174,440 $82 97% 77% 1,210 506 384 71 5.9 Difference -19 $7,955 -$560 $4 0 0.03 104 51 -11 -8 0.4 % Difference -3.29% 3.79% -0.32% 5.13% 0.00% 4.05% 9.40% 11.21% -2.78% -10.13% 7.27% Area: 33- Galveston 2009 YTD 1890 $181,631 $155,000 $83 95% 77% 3,831 2,021 1,263 90 7.2 2010 YTD 1888 $199,062 $165,000 $91 95% 79% 4,851 2,730 1,171 88 10.1 Difference -2 $17,431 $10,000 $8 0 0.02 1020 709 -92 -2 2.9 % Difference -0.11% 9.60% 6.45% 9.64% 0.00% 2.60% 26.62% 35.08% -7.28% -2.22% 40.28% Real Estate Data ©2010 Real Estate Center at Texas A and M University and HAR. Data computations ©2010 Prudential Gary Greene, Realtors.
  • 5. Sales Sold Average Median Price to List Coop New Active Pending Months Year Month Sales Price Price per Sqft Price Sales Listings Listings Sales DOM Inventory Area: 34- Aldine Westfield 2009 YTD 135 $74,754 $69,800 $48 94% 79% 277 186 119 94 8.4 2010 YTD 158 $82,064 $78,000 $53 95% 84% 349 189 131 85 8.3 Difference 23 $7,310 $8,200 $5 0.01 0.05 72 3 12 -9 -0.1 % Difference 17.04% 9.78% 11.75% 10.42% 1.06% 6.33% 25.99% 1.61% 10.08% -9.57% -1.19% Area: 35- Hempstead West 2009 YTD 724 $199,066 $165,720 $76 95% 90% 1,393 614 525 83 5.9 2010 YTD 767 $199,859 $165,000 $76 96% 91% 1,600 679 499 73 6.0 Difference 43 $793 -$720 $0 0.01 0.01 207 65 -26 -10 0.1 % Difference 5.94% 0.40% -0.43% 0.00% 1.05% 1.11% 14.86% 10.59% -4.95% -12.05% 1.69% Area: 36 - South Katy Area 2009 YTD 1596 $258,204 $232,000 $88 95% 91% 2,402 854 1,057 77 3.8 2010 YTD 1605 $269,314 $240,000 $90 96% 91% 2,981 926 960 56 3.9 Difference 9 $11,110 $8,000 $2 0.01 0 579 72 -97 -21 0.1 % Difference 0.56% 4.30% 3.45% 2.27% 1.05% 0.00% 24.10% 8.43% -9.18% -27.27% 2.63% Area: 37 - Fort Bend West 2009 YTD 1080 $182,447 $156,000 $71 95% 90% 1,874 817 816 93 5.2 2010 YTD 1034 $180,882 $155,000 $73 95% 91% 2,328 960 710 70 6.1 Difference -46 -$1,565 -$1,000 $2 0 0.01 454 143 -106 -23 0.9 % Difference -4.26% -0.86% -0.64% 2.82% 0.00% 1.11% 24.23% 17.50% -12.99% -24.73% 17.31% Area: 38 - Fort Bend East 2009 YTD 876 $157,857 $125,660 $66 94% 88% 1,455 647 682 95 4.6 2010 YTD 830 $170,703 $136,000 $70 96% 88% 1,710 746 595 72 6.1 Difference -46 $12,846 $10,340 $4 0.02 0 255 99 -87 -23 1.5 % Difference -5.25% 8.14% 8.23% 6.06% 2.13% 0.00% 17.53% 15.30% -12.76% -24.21% 32.61% Area: 39 - Montgomery County Northwest 2009 YTD 665 $234,286 $177,000 $95 95% 80% 1,476 903 451 109 10.1 2010 YTD 646 $244,614 $179,450 $100 95% 86% 1,634 885 411 92 9.5 Difference -19 $10,328 $2,450 $5 0 0.06 158 -18 -40 -17 -0.6 % Difference -2.86% 4.41% 1.38% 5.26% 0.00% 7.50% 10.70% -1.99% -8.87% -15.60% -5.94% Area: 40 - Montgomery County Southeast 2009 YTD 253 $155,595 $137,500 $71 95% 79% 573 296 202 98 8.1 2010 YTD 326 $163,869 $149,000 $74 95% 79% 719 360 221 78 7.9 Difference 73 $8,274 $11,500 $3 0 0 146 64 19 -20 -0.2 % Difference 28.85% 5.32% 8.36% 4.23% 0.00% 0.00% 25.48% 21.62% 9.41% -20.41% -2.47% Area: 41 - Montgomery County Northwest 2009 YTD 9 $70,917 $60,000 $39 86% 67% 13 15 5 112 15.1 2010 YTD 10 $104,872 $110,860 $60 94% 40% 20 18 8 126 14.1 Difference 1 $33,955 $50,860 $21 0.08 -0.27 7 3 3 14 -1 % Difference 11.11% 47.88% 84.77% 53.85% 9.30% 0.00% 53.85% 20.00% 60.00% 12.50% -6.62% Real Estate Data ©2010 Real Estate Center at Texas A and M University and HAR. Data computations ©2010 Prudential Gary Greene, Realtors.
  • 6. Sales Sold Average Median Price to List Coop New Active Pending Months Year Month Sales Price Price per Sqft Price Sales Listings Listings Sales DOM Inventory Area: 42 - Liberty County 2009 YTD 41 $96,827 $83,000 $58 92% 39% 128 114 31 151 17.2 2010 YTD 42 $109,564 $80,500 $68 93% 40% 155 117 28 181 16.7 Difference 1 $12,737 -$2,500 $10 0.01 0.01 27 3 -3 30 -0.5 % Difference 2.44% 13.15% -3.01% 17.24% 1.09% 2.56% 21.09% 2.63% -9.68% 19.87% -2.91% Area: 43 - Walker County 2009 YTD 150 $136,498 $128,950 $75 95% 50% 316 173 127 101 8.5 2010 YTD 121 $126,851 $121,000 $68 94% 55% 315 194 91 104 9.2 Difference -29 -$9,647 -$7,950 -$7 -0.01 0.05 -1 21 -36 3 0.7 % Difference -19.33% -7.07% -6.17% -9.33% -1.05% 10.00% -0.32% 12.14% -28.35% 2.97% 8.24% Area: 44 - Polk County 2009 YTD 172 $116,772 $88,500 $74 92% 52% 410 312 105 152 13.1 2010 YTD 152 $139,627 $106,500 $84 92% 55% 479 388 99 142 15.6 Difference -20 $22,855 $18,000 $10 0 0.03 69 76 -6 -10 2.5 % Difference -11.63% 19.57% 20.34% 13.51% 0.00% 5.77% 16.83% 24.36% -5.71% -6.58% 19.08% Area: 45 2009 YTD 3 $66,667 $50,000 $48 96% 33% 2 2 185 7.5 2010 YTD 3 $42,667 $33,000 $32 99% 67% 4 3 94 10.0 Difference 0 -$24,000 -$17,000 -$16 0.03 0.34 4 1 -2 -91 2.5 % Difference 0.00% -36.00% -34.00% -33.33% 3.13% 0.00% 0.00% 50.00% 200.00% -49.19% 33.33% Area: 46 2009 YTD 1 $30,000 $30,000 $17 78% 0% 1 106 12.0 2010 YTD 4 $32,000 $31,500 $19 82% 0% 2 4 76 17.0 Difference 3 $2,000 $1,500 $2 0.04 0 0 1 4 -30 5 % Difference 300.00% 6.67% 5.00% 11.76% 5.13% 0.00% 0.00% 100.00% 200.00% -28.30% 41.67% Area: 47 2009 YTD 1 $13,000 $13,000 $10 58% 0% 1 45 12.0 % Difference 0.00% 0.00% 0.00% 0.00% 0.00% 0.00% 0.00% 0.00% 0.00% 0.00% 0.00% Area: 48 2009 YTD 11 $76,896 $47,000 $56 88% 45% 8 12 3 133 6.9 2010 YTD 13 $97,392 $87,500 $53 93% 38% 47 27 11 100 15.2 Difference 2 $20,496 $40,500 -$3 0.05 -0.07 39 15 8 -33 8.3 % Difference 18.18% 26.65% 86.17% -5.36% 5.68% -15.56% 487.50% 125.00% 0.00% -24.81% 120.29% Area: 49 2009 YTD 2 $105,630 $105,630 $84 92% 0% 1 2 93 2010 YTD 2 $55,575 $55,580 $28 99% 50% 6 7 1 10 32.0 Difference 0 -$50,055 -$50,050 -$56 0.07 0.5 5 7 -1 -83 32 % Difference 0.00% -47.39% -47.38% -66.67% 7.61% 0.00% 500.00% 0.00% 0.00% -89.25% #DIV/0! Area: 50 2009 YTD 1 $114,000 $114,000 $77 99% 0% 45 2010 YTD 2 $37,750 $37,750 $29 89% 0% 1 1 1 101 6.0 Difference 1 -$76,250 -$76,250 -$48 -0.1 0 1 1 1 56 6 % Difference 100.00% -66.89% -66.89% -62.34% -10.10% 0% 0.00% 0.00% 0.00% 124.44% 0.00% Area: 51 2009 YTD 15 $51,250 $41,680 $33 95% 60% 34 13 21 55 4.4 2010 YTD 25 $52,404 $40,500 $30 88% 96% 43 19 37 74 6.5 Difference 10 $1,154 -$1,180 $14 -0.07 0.36 9 6 16 19 2.1 % Difference 66.67% 2.25% -2.83% 0.00% -7.37% 60.00% 26.47% 46.15% 76.19% 34.55% 47.73% Real Estate Data ©2010 Real Estate Center at Texas A and M University and HAR. Data computations ©2010 Prudential Gary Greene, Realtors.
  • 7. Sales Sold Average Median Price to List Coop New Active Pending Months Year Month Sales Price Price per Sqft Price Sales Listings Listings Sales DOM Inventory Area: 52 - Liberty County 2009 YTD 167 $89,992 $78,500 $52 96% 51% 353 190 154 94 7.0 2010 YTD 169 $95,433 $80,660 $54 95% 49% 392 243 115 94 10.2 Difference 2 $5,441 $2,160 $2 -0.01 -0.02 39 53 -39 0 3.2 % Difference 1.20% 6.05% 2.75% 3.85% -1.04% -3.92% 11.05% 27.89% -25.32% 0.00% 45.71% Area: 53 - Chambers County 2009 YTD 145 $174,994 $168,900 $77 96% 72% 253 138 78 133 7.0 2010 YTD 170 $170,724 $165,000 $75 97% 78% 345 164 100 77 7.4 Difference 25 -$4,270 -$3,900 -$2 0.01 0.06 92 26 22 -56 0.4 % Difference 17.24% -2.44% -2.31% -2.60% 1.04% 8.33% 36.36% 18.84% 28.21% -42.11% 5.71% Area: 54 2009 YTD 22 $126,537 $116,250 $96 87% 27% 89 106 12 131 30.7 2010 YTD 28 $125,494 $107,380 $97 89% 46% 108 136 17 175 39.4 Difference 6 -$1,043 -$8,870 $1 0.02 0.19 19 30 5 44 8.7 % Difference 27.27% -0.82% -7.63% 1.04% 2.30% 70.37% 21.35% 28.30% 41.67% 33.59% 28.34% Area: 55 - Wharton County 2009 YTD 73 $113,918 $109,000 $66 94% 45% 160 117 46 107 11.6 2010 YTD 72 $114,118 $103,150 $68 94% 57% 157 115 47 105 10.4 Difference -1 $200 -$5,850 $2 0 0.12 -3 -2 1 -2 -1.2 % Difference -1.37% 0.18% -5.37% 3.03% 0.00% 26.67% -1.88% -1.71% 2.17% -1.87% -10.34% Area: 56 2009 YTD 18 $97,954 $92,450 $58 92% 61% 46 52 17 103 18.2 2010 YTD 26 $143,913 $150,450 $78 94% 50% 63 53 16 136 14.7 Difference 8 $45,959 $58,000 $20 0.02 -0.11 17 1 -1 33 -3.5 % Difference 44.44% 46.92% 62.74% 34.48% 2.17% -18.03% 36.96% 1.92% -5.88% 32.04% -19.23% Area: 57 - Austin County 2009 YTD 94 $147,557 $134,900 $81 95% 59% 201 156 69 110 11.6 2010 YTD 57 $146,191 $137,500 $79 94% 63% 204 189 50 137 18.5 Difference -37 -$1,366 $2,600 -$2 -0.01 0.04 3 33 -19 27 6.9 % Difference -39.36% -0.93% 1.93% -2.47% -1.05% 6.78% 1.49% 21.15% -27.54% 24.55% 59.48% Area: 58 2009 YTD 45 $168,770 $149,900 $87 95% 56% 76 51 31 117 8.8 2010 YTD 35 $178,755 $149,000 $93 94% 66% 94 59 20 131 12.5 Difference -10 9985 -900 6 -0.01 0.1 18 8 -11 14 3.7 % Difference -22.22% 5.92% -0.60% 6.90% -1.05% 17.86% 23.68% 15.69% -35.48% 11.97% 42.05% Area: 59 2009 YTD 2 $45,450 $45,450 $25 91% 50% 3 7 39 10.5 2010 YTD 4 $85,500 $64,000 $58 93% 75% 8 7 2 55 12.6 Difference 2 40050 18550 33 0.02 0.25 5 0 2 16 2.1 % Difference 100.00% 88.12% 40.81% 132.00% 2.20% 50.00% 166.67% 0.00% 0.00% 41.03% 20.00% Real Estate Data ©2010 Real Estate Center at Texas A and M University and HAR. Data computations ©2010 Prudential Gary Greene, Realtors.
  • 8. Sales Sold Average Median Price to List Coop New Active Pending Months Year Month Sales Price Price per Sqft Price Sales Listings Listings Sales DOM Inventory Area: 60 2009 YTD 46 $86,887 $70,750 $54 92% 43% 86 53 35 134 9.1 2010 YTD 34 $107,597 $87,600 $64 94% 32% 85 52 32 133 9.5 Difference -12 $20,710 $16,850 $10 0.02 -0.11 -1 -1 -3 -1 0.4 % Difference -26.09% 23.84% 23.82% 18.52% 2.17% -25.58% -1.16% -1.89% -8.57% -0.75% 4.40% Area: 61 2009 YTD 32 $147,838 $128,700 $74 96% 88% 67 25 29 73 5.5 2010 YTD 38 $143,541 $148,250 $84 97% 92% 95 34 37 55 5.6 Difference 6 -$4,297 $19,550 $10 0.01 0.04 28 9 8 -18 0.1 % Difference 18.75% -2.91% 15.19% 13.51% 1.04% 4.55% 41.79% 36.00% 27.59% -24.66% 1.82% Area: 62 2009 YTD 13 $79,877 $80,000 $45 93% 0% 24 26 10 106 11.8 2010 YTD 19 $78,132 $69,000 $51 96% 37% 34 23 17 124 8.8 Difference 6 -$1,745 -$11,000 $6 0.03 0.37 10 -3 7 18 -3 % Difference 46.15% -2.18% -13.75% 13.33% 3.23% 0.00% 41.67% -11.54% 0.00% 16.98% -25.42% Area: 63 2009 YTD 8 $107,838 $115,000 $41 94% 0% 15 23 5 139 21.9 2010 YTD 23 $95,587 $72,000 $56 93% 9% 70 45 14 141 27.7 Difference 15 -$12,251 -$43,000 $15 -0.01 0.09 55 22 9 2 5.8 % Difference 187.50% -11.36% -37.39% 36.59% -1.06% 25.00% 366.67% 95.65% 0.00% 1.44% 26.48% Area: 64 - San Jacinto County 2009 YTD 92 $155,306 $112,000 $88 93% 42% 248 152 68 133 10.6 2010 YTD 95 $136,480 $88,700 $84 93% 63% 232 190 60 110 13.7 Difference 3 -$18,826 -$23,300 -$4 0 0.21 -16 38 -8 -23 3.1 % Difference 3.26% -12.12% -20.80% -4.55% 0.00% 50.00% -6.45% 25.00% -11.76% -17.29% 29.25% Area: 65 2010 YTD 1 $80,000 $80,000 $75 100% 0% 6 1 154 36.0 % Difference 0.00% 0.00% 0.00% 0.00% 0.00% 0.00% 0.00% 0.00% 0.00% 0.00% 0.00% Area: 66 2009 YTD 1 $14,900 $14,900 $18 100% 0% 1 8 2010 YTD 2 $182,500 $182,500 $60 92% 50% 7 23 0 156 37 Difference 1 $167,600 $167,600 $42 -8% 50% 7 23 -1 148 36.8 % Difference 100.00% 1124.83% 1124.83% 233.33% -8.00% 50.00% 0.00% 0.00% 0.00% 1850.00% 0.00% Area: 67 2010 YTD 1 $85,000 $85,000 $26 85% 0% 5 35 30.0 Difference 0 $0 $0 $0 0% 0% 0 0 0 0 % Difference 0.00% 0.00% 0.00% 0.00% 0.00% 0.00% 0.00% 0.00% 0.00% 0.00% 0.00% Area: 68 2009 YTD 1 $52,400 $52,400 $44 79% 100% 1 3 0 319 36.0 Difference 0 $0 $0 $0 0% 0% 0 0 0 0 0 % Difference 0.00% 0.00% 0.00% 0.00% 0.00% 100.00% 100.00% 0.00% 0.00% 0.00% 0.00% Real Estate Data ©2010 Real Estate Center at Texas A and M University and HAR. Data computations ©2010 Prudential Gary Greene, Realtors.
  • 9. Area: 69 2009 YTD 3 $146,867 $182,500 $108 98% 0% 7 12 1 37 24.8 2010 YTD 7 $190,129 $145,000 $118 83% 57% 14 19 1 109 26.7 Difference 4 $43,262 -$37,500 $10 -15% 57% 7 7 0 72 1.9 % Difference 133.33% 29.46% -20.55% 9.26% -15.31% 0.00% 0.00% 58.33% 0.00% 194.59% 7.66% Area: 70 2010 YTD 1 $90,000 $90,000 $1 100% 100% 1 4 1 69 48.0 % Difference 0.00% 0.00% 0.00% 0.00% 0.00% 0.00% 0.00% 0.00% 0.00% 0.00% 0.00% Area: 72 2009 YTD 2 $73,000 $73,000 $9 91% 0% 2 3 73 4.8 2010 YTD 4 $39,975 $40,450 $27 91% 75% 5 5 3 89 23.8 Difference 2 -$33,025 -$32,550 $18 0% 75% 3 2 3 16 19 % Difference 100.00% -45.24% -44.59% 200.00% 0.00% 100.00% 100.00% 0.00% 0.00% 21.92% 395.83% Area: 73 2009 YTD 2 $149,500 $149,500 $79 88% 0% 7 2 192 28.0 2010 YTD 2 $152,450 $152,450 $11 78% 50% 7 402 13.0 Difference 0 $2,950 $2,950 -$68 -10% 50% 0 0 -2 210 -15 % Difference 0.00% 1.97% 1.97% -86.08% -11.36% 0.00% 0.00% 0.00% -100.00% 109.38% -53.57% Area: 76 2009 YTD 1 $237,867 $237,870 $96 114% 100% 1 97 6.0 % Difference 0.00% 0.00% 0.00% 0.00% 0.00% 0.00% 0.00% 0.00% 0.00% 0.00% 0.00% Area: 77 2009 YTD 10 $144,850 $118,750 $74 96% 70% 12 13 6 73 9.6 2010 YTD 8 $112,750 $122,750 $62 96% 50% 21 13 8 102 8.2 Difference -2 -$32,100 $4,000 -$12 0 -0.2 9 0 2 29 -1.4 % Difference -20.00% -22.16% 3.37% -16.22% 0.00% 0.00% 75.00% 0.00% 33.33% 39.73% -14.58% Area: 78 2009 YTD 1 $38,000 $38,000 $26 92% 0% 1 2 30 24.0 % Difference 0.00% 0.00% 0.00% 0.00% 0.00% 0.00% 0.00% 0.00% 0.00% 0.00% 0.00% Real Estate Data ©2010 Real Estate Center at Texas A and M University and HAR. Data computations ©2010 Prudential Gary Greene, Realtors.