SlideShare ist ein Scribd-Unternehmen logo
1 von 1
Downloaden Sie, um offline zu lesen
FIGURE 1: POTENCY BINDING CURVES OF
TRASTUZUMAB (HERCEPTIN) WITH FCRI/CD64
The standard deviations of the triplicate measurements were smaller
than the plotted symbols.
COMPARABILITY METHODS FOR BIOSIMILAR TESTING USING THE BIACORE T200
INTRODUCTION
Regulatory organizations have issued detailed guidelines for biosimilar products which includes a demonstration of biosimilarity with the licensed originator
product. Because monoclonal antibodies represent a major class of biosimilar products, target ligand binding assays and Fc Receptor binding assays
(FcRI/CD64, FcRII/CD32, FcRIII/CD16 and FcRn) are essential to support characterization, development, lot-to-lot variability and product release. Our
laboratory has developed and validated methods using Surface Plasmon Resonance (SPR) technology that conform to ICH, FDA, and EMA guidelines to
assess the comparability of functional activity of the proposed biosimilar product to its reference product.
METHODS
For the presented studies, the Biacore™ T200 (GE Healthcare) was used to perform side-by-side comparability binding assays.
Ligands (R&D systems) or Fc Receptors (R&D systems or SinoBiologicals) were immobilized or captured respectively onto a CM5 sensor chip. Originator
(Bionical Ltd) and biosimilar product were flowed over the ligand/FcR of interest and binding assay endpoints information reported appropriately. All
experiments were carried out in HBS-EP+ buffer (GE Healthcare) at a constant temperature of 25 °C.
For potency comparability (relative binding), triplicate independent serial dilutions (8 concentrations) of the originator and biosimilar product were prepared
and injections performed at a flow rate of 5 μL/min over two flow cells; one reference surface and one with captured Fc Receptor (FcR) or immobilized
ligand. After each sample injection, the sensor chip was regenerated and FcR/ligand re-captured appropriately. BiacoreTM T200 Control Software 2.0 was
used for data collection and export of data to PLA 2.1 Software (Stegmann systems) for potency evaluation.
For kinetics association constant (ka or k-on), dissociation constant (kd or k-off) and affinity constant (KD) comparability, independent dilutions of the
originator and biosimilar product were prepared and injections performed in quadruplicate at a flow rate of 30 μL/min. After each sample, the sensor chip
was regenerated. BiacoreTM T200 Control Software 2.0 was used for data collection. BiacoreTM T200 Evaluation Software 2.0 was used with 1:1 binding
model fitting for kinetics/affinity evaluation.
RESULTS
Potency comparability:
In each potency experiment up to three test samples can be compared to a reference sample (with an assigned potency of 1). The following potency results
present the binding of Trastuzumab (Herceptin) to recombinant FcRI/CD64. Trastuzumab (standard/reference) and the test samples were injected in
triplicate and analyzed using a 4PL model with all test sample curves were deemed to be parallel to the reference sample curve (p>0.05). Between each
injection the surface was regenerated with 30 μL of 10 mM glycine pH1.5. The obtained potency binding curves are shown in Figure 1.
MELANIE VERNERET, JOHN BLACK, CHRISTOPHE IOCHEM, ARCHIE LOVATT
SGS LIFE SCIENCE SERVICES, GLASGOW, UK
The assay showed good linearity with an r2 = 0.974 with all measured potencies in the range of 88.9% to 101.6% as show in Table 1. Moreover, the assay
showed good repeatability, with a %CV < 15% for each concentration per potency levels and high precision with a %CV < 5% for replicate potency levels.
TABLE 1: TRASTUZUMAB - FCRI/CD64 ASSAY ACCURACY
Kinetics/Affinity comparability:
The following kinetics results present the binding of Bevacizumab to recombinant Vascular Endothelial Growth Factor A (VEGFA). In the presented
experiment, five test samples were compared to a reference sample. Between each injection the surface was regenerated with 30 μL of 10 mM glycine
pH1.5. The obtained kinetics binding curves are shown in Figure 3.
During qualification, to assess the assay linearity, accuracy and precision evaluation, the test samples and reference samples were all prepared from a
single batch of Bevacizumab and the concentration of the test samples were adjusted to simulate samples of different response.
The correlation between measured and nominal response for three separate experiments, over different flow cells, is shown in Figure 4. The nominal
response is the concentration at which the test samples were prepared relative to the reference and the measured response is the test sample response
which is calculated from assay data relative to the reference.
The assay showed good linearity with an r2 = 0.959 for the nominal response range of 0.5 - 1.5 and all measured response were within 15% of the nominal
value (range 85.2% - 106.6%) as show in Table 2. Moreover, the assay showed good repeatability, with a %CV < 10% for each concentration and high
precision with a %CV < 15% for replicate nominal response levels (Table 3).
TABLE 2: BEVACIZUMAB - VEGFA ASSAY ACCURACY
TABLE 3: BEVACIZUMAB - VEGFA ASSAY PRECISION
Conclusions
Biacore potency or kinetic assays can provide valuable in vitro data regarding functional interaction properties of the products without the need for animal
studies and the variability due to biological complexity and/or statistical noise of the cell-based assays (e.g. Antibody Dependant cell-mediated Cytotoxicity -
ADCC). Furthermore, when considering costs and speed, Biacore assays provide a more economical and faster alternative to cell-based assays.
More importantly, as shown in the presented examples, Biacore assays can easily distinguish differences in the biosimilars sample in comparison to the
reference product with high levels of accuracy, precision and linearity, making them fit-for purpose for comparability studies in compliance with regulatory
requirements for quality control and biosimilar license approval.
Similar approaches can be used with the full range of FcRs and target binding for any monoclonal antibody.
References
1. ICH Topic Q 2 (R1) Validation of Analytical Procedures: Text and Methodology (1995)
2. Bioanalytical Method Validation – FDA (2011) – Draft 2013
3. Guideline on bioanalytical method validation – EMA (2012)
4. Guideline on Similar Biological Medicinal Products – EMA (2014)
5. Guideline on similar biological medicinal products containing biotechnology-derived proteins as active substance: non-clinical and clinical issues – EMA
(2015)
6. Guideline on similar biological medicinal products containing monoclonal antibodies – non-clinical and clinical issues – EMA (2012)
7. Quality Considerations in Demonstrating Biosimilarity to a Reference Protein Product – FDA (2015)
8. Scientific Considerations in Demonstrating Biosimilarity to a Reference Product – FDA (2015)
9. ICH Topic Q 6 B Specifications: Test Procedures and Acceptance Criteria for Biotechnological/Biological Products (1999)
10. The United States Pharmacopeial Convention – Chapter <1032> <1033> <1034>
11. European Pharmacopeia, European Pharmacopoeia. 8.0. Section 5.3. Statistical Analysis of results of Biological Assays and tests.
During qualification, to evaluate the assay, linearity, accuracy and precision,
the test samples and reference samples were all prepared from a single batch
of Trastuzumab and the concentration of the test samples were adjusted to
simulate samples of different nominal potencies.
The correlation between measured and nominal potencies for three separate
experiments is shown in Figure 2. The nominal potency is the concentration at
which the test samples were prepared relative to the reference and the
measured potency is the concentration which is calculated from assay data
relative to the reference.
FIGURE 2: CORRELATION BETWEEN MEASURED AND NOMINAL
POTENCY FOR TRASTUZUMAB - FCRI/CD64
0
0.5
1
1.5
2
0 0.5 1 1.5 2
Measuredpotency
Nominal potency
PARAMETERS
ACCEPTANCE
CRITERIA
VALUE
r² > 0.95 0.974
Intercept -0.2 to 0.2 0.04
Slope 0.8 to 1.2 0.91
POTENCY ACCEPTANCE CRITERIA ACCURACY (%)
0.5 80 to 120 % 97.4
0.7 80 to 120 % 92.0
0.8 80 to 120 % 88.9
1.0 80 to 120 % 100.8
1.2 80 to 120 % 101.6
1.3 80 to 120 % 91.1
1.5 80 to 120 % 93.3
FIGURE 3: KINETIC BINDING CURVES OF BEVACIZUMAB
(AVASTIN) WITH VEGFA
FIGURE 2: CORRELATION BETWEEN MEASURED AND NOMINAL
RESPONSE FOR BEVACIZUMAB - VEGFA
0
0.5
1
1.5
2
0 0.5 1 1.5 2
MeasuredResponse
Nominal Response
PARAMETERS
ACCEPTANCE
CRITERIA
VALUE
r² > 0.95 0.959
Intercept -0.2 to 0.2 0.16
Slope 0.7 to 1.3 0.77
NOMINAL RESPONSE ACCEPTANCE CRITERIA ACCURACY (%)
0.5 80 to 120 % 106.6
0.8 80 to 120 % 103.5
1.0 80 to 120 % 99.9
1.2 80 to 120 % 93.2
1.5 80 to 120 % 85.2
NOMINAL RESPONSE % CV
0.5 10.7
0.8 11.8
1.0 4.9
1.2 14.5
1.5 0.9
GSK PCGSK PC

Weitere ähnliche Inhalte

Was ist angesagt?

Pharmacophore extraction from Matched Molecular Pair Analysis
Pharmacophore extraction from Matched Molecular Pair AnalysisPharmacophore extraction from Matched Molecular Pair Analysis
Pharmacophore extraction from Matched Molecular Pair AnalysisEd Griffen
 
Size-Exclusion Chromatography with On-Line Light-Scattering, Absorbance, and ...
Size-Exclusion Chromatography with On-Line Light-Scattering, Absorbance, and ...Size-Exclusion Chromatography with On-Line Light-Scattering, Absorbance, and ...
Size-Exclusion Chromatography with On-Line Light-Scattering, Absorbance, and ...KBI Biopharma
 
Antibacterial Activity of Schiff Bases Derived from OrthoDiaminocyclohexane, ...
Antibacterial Activity of Schiff Bases Derived from OrthoDiaminocyclohexane, ...Antibacterial Activity of Schiff Bases Derived from OrthoDiaminocyclohexane, ...
Antibacterial Activity of Schiff Bases Derived from OrthoDiaminocyclohexane, ...inventionjournals
 
UV Spectroscopic Assay Method Development and Validation of Amoxicillin in ...
UV Spectroscopic Assay Method Development  and Validation of Amoxicillin in ...UV Spectroscopic Assay Method Development  and Validation of Amoxicillin in ...
UV Spectroscopic Assay Method Development and Validation of Amoxicillin in ...Imran al
 
Qsar and drug design ppt
Qsar and drug design pptQsar and drug design ppt
Qsar and drug design pptAbhik Seal
 
Accelrys UGM slides 2011
Accelrys UGM slides 2011Accelrys UGM slides 2011
Accelrys UGM slides 2011Sean Ekins
 
Alta Peg X%20 Poster
Alta Peg X%20 PosterAlta Peg X%20 Poster
Alta Peg X%20 Posterrgoodin
 
QSAR Studies of the Inhibitory Activity of a Series of Substituted Indole and...
QSAR Studies of the Inhibitory Activity of a Series of Substituted Indole and...QSAR Studies of the Inhibitory Activity of a Series of Substituted Indole and...
QSAR Studies of the Inhibitory Activity of a Series of Substituted Indole and...inventionjournals
 
consensus superiority of the pharmacophore based alignment, over maximum comm...
consensus superiority of the pharmacophore based alignment, over maximum comm...consensus superiority of the pharmacophore based alignment, over maximum comm...
consensus superiority of the pharmacophore based alignment, over maximum comm...Deepak Rohilla
 
The use of functionalized afm tips as molecular sensors in the detection of p...
The use of functionalized afm tips as molecular sensors in the detection of p...The use of functionalized afm tips as molecular sensors in the detection of p...
The use of functionalized afm tips as molecular sensors in the detection of p...Grupo de Pesquisa em Nanoneurobiofisica
 
Methods to Detect Protein-Protein Interaction
Methods to Detect Protein-Protein InteractionMethods to Detect Protein-Protein Interaction
Methods to Detect Protein-Protein InteractionCreative Proteomics
 
Mass Spectrometry-Based Proteomics Quantification: iTRAQ
Mass Spectrometry-Based Proteomics Quantification: iTRAQ Mass Spectrometry-Based Proteomics Quantification: iTRAQ
Mass Spectrometry-Based Proteomics Quantification: iTRAQ Creative Proteomics
 

Was ist angesagt? (19)

Pharmacophore extraction from Matched Molecular Pair Analysis
Pharmacophore extraction from Matched Molecular Pair AnalysisPharmacophore extraction from Matched Molecular Pair Analysis
Pharmacophore extraction from Matched Molecular Pair Analysis
 
Size-Exclusion Chromatography with On-Line Light-Scattering, Absorbance, and ...
Size-Exclusion Chromatography with On-Line Light-Scattering, Absorbance, and ...Size-Exclusion Chromatography with On-Line Light-Scattering, Absorbance, and ...
Size-Exclusion Chromatography with On-Line Light-Scattering, Absorbance, and ...
 
Antibacterial Activity of Schiff Bases Derived from OrthoDiaminocyclohexane, ...
Antibacterial Activity of Schiff Bases Derived from OrthoDiaminocyclohexane, ...Antibacterial Activity of Schiff Bases Derived from OrthoDiaminocyclohexane, ...
Antibacterial Activity of Schiff Bases Derived from OrthoDiaminocyclohexane, ...
 
UV Spectroscopic Assay Method Development and Validation of Amoxicillin in ...
UV Spectroscopic Assay Method Development  and Validation of Amoxicillin in ...UV Spectroscopic Assay Method Development  and Validation of Amoxicillin in ...
UV Spectroscopic Assay Method Development and Validation of Amoxicillin in ...
 
Cook2010web
Cook2010webCook2010web
Cook2010web
 
Qsar and drug design ppt
Qsar and drug design pptQsar and drug design ppt
Qsar and drug design ppt
 
Yasset iso point-cigb-2012
Yasset iso point-cigb-2012Yasset iso point-cigb-2012
Yasset iso point-cigb-2012
 
Accelrys UGM slides 2011
Accelrys UGM slides 2011Accelrys UGM slides 2011
Accelrys UGM slides 2011
 
Alta Peg X%20 Poster
Alta Peg X%20 PosterAlta Peg X%20 Poster
Alta Peg X%20 Poster
 
Cadd ppt
Cadd pptCadd ppt
Cadd ppt
 
Dispensing Processes Impact Apparent Biological Activity as Determined by Com...
Dispensing Processes Impact Apparent Biological Activity as Determined by Com...Dispensing Processes Impact Apparent Biological Activity as Determined by Com...
Dispensing Processes Impact Apparent Biological Activity as Determined by Com...
 
QSAR Studies of the Inhibitory Activity of a Series of Substituted Indole and...
QSAR Studies of the Inhibitory Activity of a Series of Substituted Indole and...QSAR Studies of the Inhibitory Activity of a Series of Substituted Indole and...
QSAR Studies of the Inhibitory Activity of a Series of Substituted Indole and...
 
consensus superiority of the pharmacophore based alignment, over maximum comm...
consensus superiority of the pharmacophore based alignment, over maximum comm...consensus superiority of the pharmacophore based alignment, over maximum comm...
consensus superiority of the pharmacophore based alignment, over maximum comm...
 
List of Publications
List of PublicationsList of Publications
List of Publications
 
The use of functionalized afm tips as molecular sensors in the detection of p...
The use of functionalized afm tips as molecular sensors in the detection of p...The use of functionalized afm tips as molecular sensors in the detection of p...
The use of functionalized afm tips as molecular sensors in the detection of p...
 
Methods to Detect Protein-Protein Interaction
Methods to Detect Protein-Protein InteractionMethods to Detect Protein-Protein Interaction
Methods to Detect Protein-Protein Interaction
 
Mass Spectrometry-Based Proteomics Quantification: iTRAQ
Mass Spectrometry-Based Proteomics Quantification: iTRAQ Mass Spectrometry-Based Proteomics Quantification: iTRAQ
Mass Spectrometry-Based Proteomics Quantification: iTRAQ
 
ppt
pptppt
ppt
 
2016_15_3_18
2016_15_3_182016_15_3_18
2016_15_3_18
 

Ähnlich wie Biosimilar Binding Assay Validation

Regulatory analysis & approval of Biosimilars
Regulatory analysis & approval of BiosimilarsRegulatory analysis & approval of Biosimilars
Regulatory analysis & approval of BiosimilarsBhaswat Chakraborty
 
Bioanalytical Method Validation
Bioanalytical Method ValidationBioanalytical Method Validation
Bioanalytical Method ValidationSanket Shinde
 
USFDA guidelines for bioanalytical method validation
USFDA guidelines for bioanalytical method validationUSFDA guidelines for bioanalytical method validation
USFDA guidelines for bioanalytical method validationbhatiaji123
 
PRINT THIS POSTER
PRINT THIS POSTERPRINT THIS POSTER
PRINT THIS POSTERJuhi Patel
 
Pharmaceutical Assay and Multicomponent Analysis
Pharmaceutical Assay and Multicomponent AnalysisPharmaceutical Assay and Multicomponent Analysis
Pharmaceutical Assay and Multicomponent AnalysisPerkinElmer, Inc.
 
2014-Yeo-A Multiplex Two-Color Real-Time PCR Method(1)
2014-Yeo-A Multiplex Two-Color Real-Time PCR Method(1)2014-Yeo-A Multiplex Two-Color Real-Time PCR Method(1)
2014-Yeo-A Multiplex Two-Color Real-Time PCR Method(1)Ji-Youn Yeo
 
Bioequivalence Study of the Two Products of Efavirenz by Validated Analytical...
Bioequivalence Study of the Two Products of Efavirenz by Validated Analytical...Bioequivalence Study of the Two Products of Efavirenz by Validated Analytical...
Bioequivalence Study of the Two Products of Efavirenz by Validated Analytical...BRNSS Publication Hub
 
Azithromycin oral suspension
Azithromycin oral suspensionAzithromycin oral suspension
Azithromycin oral suspensionAlok Singh
 
usfda guidelines for bioanalytical method validation.pptx
usfda guidelines for bioanalytical method validation.pptxusfda guidelines for bioanalytical method validation.pptx
usfda guidelines for bioanalytical method validation.pptxanumalagundam sreekanth
 
housman_mini_4_5 foot PPT poster template 50 percent
housman_mini_4_5 foot PPT poster template 50 percenthousman_mini_4_5 foot PPT poster template 50 percent
housman_mini_4_5 foot PPT poster template 50 percentJonathan Oyler
 
To perform Analytical method validation of Paracetamol and Ibuprofen in pure ...
To perform Analytical method validation of Paracetamol and Ibuprofen in pure ...To perform Analytical method validation of Paracetamol and Ibuprofen in pure ...
To perform Analytical method validation of Paracetamol and Ibuprofen in pure ...Aakashdeep Raval
 
A visual chip-based coimmunoprecipitation technique for analysis of protein–p...
A visual chip-based coimmunoprecipitation technique for analysis of protein–p...A visual chip-based coimmunoprecipitation technique for analysis of protein–p...
A visual chip-based coimmunoprecipitation technique for analysis of protein–p...Qing Chen
 
Validation of Analytical Procedures.pdf
Validation of Analytical Procedures.pdfValidation of Analytical Procedures.pdf
Validation of Analytical Procedures.pdfpharma344
 
Ich guidelines for validation final
Ich guidelines for validation finalIch guidelines for validation final
Ich guidelines for validation finalsumel ashique
 
Stability Indicating RP HPLC Method Development and Validation of Everolimus ...
Stability Indicating RP HPLC Method Development and Validation of Everolimus ...Stability Indicating RP HPLC Method Development and Validation of Everolimus ...
Stability Indicating RP HPLC Method Development and Validation of Everolimus ...ijtsrd
 
Analytical method validation
Analytical method validationAnalytical method validation
Analytical method validationAJAYKUMAR4872
 
Q biomarkersomaticmutation
Q biomarkersomaticmutationQ biomarkersomaticmutation
Q biomarkersomaticmutationElsa von Licy
 

Ähnlich wie Biosimilar Binding Assay Validation (20)

Regulatory analysis & approval of Biosimilars
Regulatory analysis & approval of BiosimilarsRegulatory analysis & approval of Biosimilars
Regulatory analysis & approval of Biosimilars
 
Bioanalytical Method Validation
Bioanalytical Method ValidationBioanalytical Method Validation
Bioanalytical Method Validation
 
USFDA guidelines for bioanalytical method validation
USFDA guidelines for bioanalytical method validationUSFDA guidelines for bioanalytical method validation
USFDA guidelines for bioanalytical method validation
 
PRINT THIS POSTER
PRINT THIS POSTERPRINT THIS POSTER
PRINT THIS POSTER
 
Pharmaceutical Assay and Multicomponent Analysis
Pharmaceutical Assay and Multicomponent AnalysisPharmaceutical Assay and Multicomponent Analysis
Pharmaceutical Assay and Multicomponent Analysis
 
2014-Yeo-A Multiplex Two-Color Real-Time PCR Method(1)
2014-Yeo-A Multiplex Two-Color Real-Time PCR Method(1)2014-Yeo-A Multiplex Two-Color Real-Time PCR Method(1)
2014-Yeo-A Multiplex Two-Color Real-Time PCR Method(1)
 
Bioequivalence Study of the Two Products of Efavirenz by Validated Analytical...
Bioequivalence Study of the Two Products of Efavirenz by Validated Analytical...Bioequivalence Study of the Two Products of Efavirenz by Validated Analytical...
Bioequivalence Study of the Two Products of Efavirenz by Validated Analytical...
 
Azithromycin oral suspension
Azithromycin oral suspensionAzithromycin oral suspension
Azithromycin oral suspension
 
usfda guidelines for bioanalytical method validation.pptx
usfda guidelines for bioanalytical method validation.pptxusfda guidelines for bioanalytical method validation.pptx
usfda guidelines for bioanalytical method validation.pptx
 
housman_mini_4_5 foot PPT poster template 50 percent
housman_mini_4_5 foot PPT poster template 50 percenthousman_mini_4_5 foot PPT poster template 50 percent
housman_mini_4_5 foot PPT poster template 50 percent
 
Chims poster
Chims posterChims poster
Chims poster
 
To perform Analytical method validation of Paracetamol and Ibuprofen in pure ...
To perform Analytical method validation of Paracetamol and Ibuprofen in pure ...To perform Analytical method validation of Paracetamol and Ibuprofen in pure ...
To perform Analytical method validation of Paracetamol and Ibuprofen in pure ...
 
A visual chip-based coimmunoprecipitation technique for analysis of protein–p...
A visual chip-based coimmunoprecipitation technique for analysis of protein–p...A visual chip-based coimmunoprecipitation technique for analysis of protein–p...
A visual chip-based coimmunoprecipitation technique for analysis of protein–p...
 
Validation of Analytical Procedures.pdf
Validation of Analytical Procedures.pdfValidation of Analytical Procedures.pdf
Validation of Analytical Procedures.pdf
 
Ich guidelines for validation final
Ich guidelines for validation finalIch guidelines for validation final
Ich guidelines for validation final
 
Q2R1.pptx
Q2R1.pptxQ2R1.pptx
Q2R1.pptx
 
SANJAY Q2R1.pptx
SANJAY Q2R1.pptxSANJAY Q2R1.pptx
SANJAY Q2R1.pptx
 
Stability Indicating RP HPLC Method Development and Validation of Everolimus ...
Stability Indicating RP HPLC Method Development and Validation of Everolimus ...Stability Indicating RP HPLC Method Development and Validation of Everolimus ...
Stability Indicating RP HPLC Method Development and Validation of Everolimus ...
 
Analytical method validation
Analytical method validationAnalytical method validation
Analytical method validation
 
Q biomarkersomaticmutation
Q biomarkersomaticmutationQ biomarkersomaticmutation
Q biomarkersomaticmutation
 

Biosimilar Binding Assay Validation

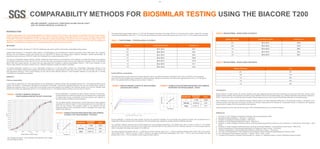
  • 1. FIGURE 1: POTENCY BINDING CURVES OF TRASTUZUMAB (HERCEPTIN) WITH FCRI/CD64 The standard deviations of the triplicate measurements were smaller than the plotted symbols. COMPARABILITY METHODS FOR BIOSIMILAR TESTING USING THE BIACORE T200 INTRODUCTION Regulatory organizations have issued detailed guidelines for biosimilar products which includes a demonstration of biosimilarity with the licensed originator product. Because monoclonal antibodies represent a major class of biosimilar products, target ligand binding assays and Fc Receptor binding assays (FcRI/CD64, FcRII/CD32, FcRIII/CD16 and FcRn) are essential to support characterization, development, lot-to-lot variability and product release. Our laboratory has developed and validated methods using Surface Plasmon Resonance (SPR) technology that conform to ICH, FDA, and EMA guidelines to assess the comparability of functional activity of the proposed biosimilar product to its reference product. METHODS For the presented studies, the Biacore™ T200 (GE Healthcare) was used to perform side-by-side comparability binding assays. Ligands (R&D systems) or Fc Receptors (R&D systems or SinoBiologicals) were immobilized or captured respectively onto a CM5 sensor chip. Originator (Bionical Ltd) and biosimilar product were flowed over the ligand/FcR of interest and binding assay endpoints information reported appropriately. All experiments were carried out in HBS-EP+ buffer (GE Healthcare) at a constant temperature of 25 °C. For potency comparability (relative binding), triplicate independent serial dilutions (8 concentrations) of the originator and biosimilar product were prepared and injections performed at a flow rate of 5 μL/min over two flow cells; one reference surface and one with captured Fc Receptor (FcR) or immobilized ligand. After each sample injection, the sensor chip was regenerated and FcR/ligand re-captured appropriately. BiacoreTM T200 Control Software 2.0 was used for data collection and export of data to PLA 2.1 Software (Stegmann systems) for potency evaluation. For kinetics association constant (ka or k-on), dissociation constant (kd or k-off) and affinity constant (KD) comparability, independent dilutions of the originator and biosimilar product were prepared and injections performed in quadruplicate at a flow rate of 30 μL/min. After each sample, the sensor chip was regenerated. BiacoreTM T200 Control Software 2.0 was used for data collection. BiacoreTM T200 Evaluation Software 2.0 was used with 1:1 binding model fitting for kinetics/affinity evaluation. RESULTS Potency comparability: In each potency experiment up to three test samples can be compared to a reference sample (with an assigned potency of 1). The following potency results present the binding of Trastuzumab (Herceptin) to recombinant FcRI/CD64. Trastuzumab (standard/reference) and the test samples were injected in triplicate and analyzed using a 4PL model with all test sample curves were deemed to be parallel to the reference sample curve (p>0.05). Between each injection the surface was regenerated with 30 μL of 10 mM glycine pH1.5. The obtained potency binding curves are shown in Figure 1. MELANIE VERNERET, JOHN BLACK, CHRISTOPHE IOCHEM, ARCHIE LOVATT SGS LIFE SCIENCE SERVICES, GLASGOW, UK The assay showed good linearity with an r2 = 0.974 with all measured potencies in the range of 88.9% to 101.6% as show in Table 1. Moreover, the assay showed good repeatability, with a %CV < 15% for each concentration per potency levels and high precision with a %CV < 5% for replicate potency levels. TABLE 1: TRASTUZUMAB - FCRI/CD64 ASSAY ACCURACY Kinetics/Affinity comparability: The following kinetics results present the binding of Bevacizumab to recombinant Vascular Endothelial Growth Factor A (VEGFA). In the presented experiment, five test samples were compared to a reference sample. Between each injection the surface was regenerated with 30 μL of 10 mM glycine pH1.5. The obtained kinetics binding curves are shown in Figure 3. During qualification, to assess the assay linearity, accuracy and precision evaluation, the test samples and reference samples were all prepared from a single batch of Bevacizumab and the concentration of the test samples were adjusted to simulate samples of different response. The correlation between measured and nominal response for three separate experiments, over different flow cells, is shown in Figure 4. The nominal response is the concentration at which the test samples were prepared relative to the reference and the measured response is the test sample response which is calculated from assay data relative to the reference. The assay showed good linearity with an r2 = 0.959 for the nominal response range of 0.5 - 1.5 and all measured response were within 15% of the nominal value (range 85.2% - 106.6%) as show in Table 2. Moreover, the assay showed good repeatability, with a %CV < 10% for each concentration and high precision with a %CV < 15% for replicate nominal response levels (Table 3). TABLE 2: BEVACIZUMAB - VEGFA ASSAY ACCURACY TABLE 3: BEVACIZUMAB - VEGFA ASSAY PRECISION Conclusions Biacore potency or kinetic assays can provide valuable in vitro data regarding functional interaction properties of the products without the need for animal studies and the variability due to biological complexity and/or statistical noise of the cell-based assays (e.g. Antibody Dependant cell-mediated Cytotoxicity - ADCC). Furthermore, when considering costs and speed, Biacore assays provide a more economical and faster alternative to cell-based assays. More importantly, as shown in the presented examples, Biacore assays can easily distinguish differences in the biosimilars sample in comparison to the reference product with high levels of accuracy, precision and linearity, making them fit-for purpose for comparability studies in compliance with regulatory requirements for quality control and biosimilar license approval. Similar approaches can be used with the full range of FcRs and target binding for any monoclonal antibody. References 1. ICH Topic Q 2 (R1) Validation of Analytical Procedures: Text and Methodology (1995) 2. Bioanalytical Method Validation – FDA (2011) – Draft 2013 3. Guideline on bioanalytical method validation – EMA (2012) 4. Guideline on Similar Biological Medicinal Products – EMA (2014) 5. Guideline on similar biological medicinal products containing biotechnology-derived proteins as active substance: non-clinical and clinical issues – EMA (2015) 6. Guideline on similar biological medicinal products containing monoclonal antibodies – non-clinical and clinical issues – EMA (2012) 7. Quality Considerations in Demonstrating Biosimilarity to a Reference Protein Product – FDA (2015) 8. Scientific Considerations in Demonstrating Biosimilarity to a Reference Product – FDA (2015) 9. ICH Topic Q 6 B Specifications: Test Procedures and Acceptance Criteria for Biotechnological/Biological Products (1999) 10. The United States Pharmacopeial Convention – Chapter <1032> <1033> <1034> 11. European Pharmacopeia, European Pharmacopoeia. 8.0. Section 5.3. Statistical Analysis of results of Biological Assays and tests. During qualification, to evaluate the assay, linearity, accuracy and precision, the test samples and reference samples were all prepared from a single batch of Trastuzumab and the concentration of the test samples were adjusted to simulate samples of different nominal potencies. The correlation between measured and nominal potencies for three separate experiments is shown in Figure 2. The nominal potency is the concentration at which the test samples were prepared relative to the reference and the measured potency is the concentration which is calculated from assay data relative to the reference. FIGURE 2: CORRELATION BETWEEN MEASURED AND NOMINAL POTENCY FOR TRASTUZUMAB - FCRI/CD64 0 0.5 1 1.5 2 0 0.5 1 1.5 2 Measuredpotency Nominal potency PARAMETERS ACCEPTANCE CRITERIA VALUE r² > 0.95 0.974 Intercept -0.2 to 0.2 0.04 Slope 0.8 to 1.2 0.91 POTENCY ACCEPTANCE CRITERIA ACCURACY (%) 0.5 80 to 120 % 97.4 0.7 80 to 120 % 92.0 0.8 80 to 120 % 88.9 1.0 80 to 120 % 100.8 1.2 80 to 120 % 101.6 1.3 80 to 120 % 91.1 1.5 80 to 120 % 93.3 FIGURE 3: KINETIC BINDING CURVES OF BEVACIZUMAB (AVASTIN) WITH VEGFA FIGURE 2: CORRELATION BETWEEN MEASURED AND NOMINAL RESPONSE FOR BEVACIZUMAB - VEGFA 0 0.5 1 1.5 2 0 0.5 1 1.5 2 MeasuredResponse Nominal Response PARAMETERS ACCEPTANCE CRITERIA VALUE r² > 0.95 0.959 Intercept -0.2 to 0.2 0.16 Slope 0.7 to 1.3 0.77 NOMINAL RESPONSE ACCEPTANCE CRITERIA ACCURACY (%) 0.5 80 to 120 % 106.6 0.8 80 to 120 % 103.5 1.0 80 to 120 % 99.9 1.2 80 to 120 % 93.2 1.5 80 to 120 % 85.2 NOMINAL RESPONSE % CV 0.5 10.7 0.8 11.8 1.0 4.9 1.2 14.5 1.5 0.9 GSK PCGSK PC