SlideShare ist ein Scribd-Unternehmen logo
1 von 31
McKinsey & Company 1
We have seen four fundamental shifts to consumer behavior, some
of which will have a lasting impact
Up to 40%
net increase in intent to
spend online even
post-COVID-19
2. Flight to digital
and omnichannel
Up to 40%
of consumers (net) say
they will decrease
spend on discretionary
categories
1. Shift to value
and essentials
76%
of consumers have
changed stores,
brands or the way
they shop
3. Shock to
loyalty
64%
of US consumers are
not yet resuming
“normal” out-of-home
activities
4. Homebody
economy
Source: McKinsey & Company COVID-19 US Consumer Pulse Survey 11/9–11/13/2020, n = 2,024, sampled and weighted to match the US general population 18+ years
McKinsey & Company 2
Confidence in own country’s economic recovery after COVID-191
% of respondents
1 Q: How is your overall confidence level in economic conditions after the COVID-19 situation? Rated from 1 “very optimistic” to 6 “very pessimistic.” Bars may not sum to 100% due to rounding.
Source: McKinsey & Company COVID-19 Consumer Pulse Survey
Spain
11/9–16
UK
11/9–16
Italy
11/9–16
China
11/9–22
Brazil
11/9–16
France
11/9–16
7 12 15 18
31
40
33 37 33
31 40
51
53
59
52
47
54 52 60
62 58
38 33
23 17 14 13 11 7
2
US
11/9–13
Mexico
11/9–17
Japan
11/9–15
India
11/9–20
13
46
41
Unsure: The economy will be
impacted for 6–12 months or
longer and will stagnate or
show slow growth thereafter
Pessimistic: COVID-19 will
have lasting impact on the
economy and show regression/
fall into lengthy recession
Optimistic: The economy will
rebound within 2–3 months and
grow just as strong as or
stronger than before COVID-19
Germany
11/9–13
Shift to value and essentials
The US is more optimistic than European countries but less so than
India or China
McKinsey & Company 3
Confidence in own country’s economic recovery after COVID-191
% of respondents
1 Q: How is your overall confidence level in economic conditions after the COVID-19 situation? Rated from 1 “very optimistic” to 6 “very pessimistic”; figures may not sum to 100% because of rounding.
Source: McKinsey & Company COVID-19 US Consumer Pulse Survey 11/9–11/13/2020, n = 2,024; 10/23–10/27/2020, n = 2,021; 9/18–9/24/2020, n = 1,026 8/19–8/23/2020, n = 2,026; 7/30–8/2/2020, n = 2,024;
7/7–7/12/2020, n = 1,923; 6/15–6/21/2020, n = 2,006; 6/1–6/7/2020, n = 1,966; 5/18–5/24/2020, n = 1,975; 5/11–5/17/2020, n = 2,002; 5/4–5/10/2020, n = 1,993; 4/27–5/3/2020, n = 2,105; 4/20–4/26/2020, n =
1,052; 4/13–4/19/2020, n = 1,052; 4/6–4/12/2020, n = 1,063; 3/30–4/5/2020, n = 1,484; 3/23–3/29/2020, n = 1,119; 3/20–3/22/2020, n = 1,073; 3/16–3/17/2020, n = 1,042; sampled and weighted to match the US general population 18+ years
13% 16% 14% 15% 16% 16% 16% 15% 15%
20% 18% 17% 18% 19% 21%
17% 17% 14% 13%
43%
45%
45%
47% 46%
48% 48% 52% 52%
49% 49% 49% 47% 46%
46%
46% 45%
44% 46%
44%
39% 41%
37% 39%
35% 36% 33% 34% 32% 33% 34% 36% 35% 32%
36% 39% 42% 41%
Mar
16–17
Mar
20–22
Mar
23–29
Apr
13–19
April
6–12
Apr 27–
May 3
Apr
20–26
May
4–10
May
11–17
May
18–24
Jun
1–7
Jun
15–21
Jul
7–12
Jul 30–
Aug 2
Aug
19–23
Sep
18–24
Oct
23–27
Nov
9–13
Mar 30–
Apr 5
US
Unsure: The economy
will be impacted for 6–12
months or longer and will
stagnate or show slow
growth thereafter
Pessimistic: COVID-19
will have lasting impact
on the economy and
show regression / fall into
lengthy recession
Optimistic: The economy
will rebound within 2–3
months and grow just as
strong as or stronger than
before COVID-19
Shift to value and essentials
Optimism regarding US economic recovery has improved steadily
since summer
McKinsey & Company 4
1 Q: When do you expect your routines will return to normal? Figures may not sum to 100% because of rounding.
2 Q: When do you expect your personal/household finances will return to normal? Figures may not sum to 100% because of rounding.
38%
11%
Jul–Dec 2021
Jan–Jun 2021 36%
15%
Already returned to normal
2022 or beyond
22%
10%
30%
24%
15%
No impact
Already returned to normal
Jan–Jun 2021
Jul–Dec 2021
2022 or beyond
Expectations on routines returning to normal1
% of respondents
Expectations on finances returning to normal2
% of respondents
~53%
believe their routines
will not return to
normal until the second
half of 2021 or beyond
~39%
believe their finances will
not return to normal until
the second half of 2021
or beyond
Shift to value and essentials
Americans believe that their routines will take longer to return to
normal than their finances
Source: McKinsey & Company COVID-19 US Consumer Pulse Survey 11/9–11/13/2020, n = 2,024, sampled and weighted to match the US general population 18+ years
McKinsey & Company 5
Household income1,2
% of respondents
1 Q: How has the COVID-19 situation affected your (family’s) overall available income, spending, and savings in the past two weeks? Figures may not sum to 100% because of rounding.
2 Q: How do you think your overall available income, spending, and savings may change in the next two weeks? Figures may not sum to 100% because of rounding.
Household spending1,2
% of respondents
October 23–27 November 9–13 October 23–27 November 9–13
Household savings1,2
% of respondents
October 23–27 November 9–13
Shift to value and essentials
Increase slightly / increase a lotReduce slightly / reduce a lot About the same
34%
9%
35%
56%
Past 2 weeks
9%
57%
Past 2 weeks
11%
71%
18%
Next 2 weeks
16%
41%
42%
14%
42%
Past 2 weeks
45%
Past 2 weeks
14%
58%
27%
Next 2 weeks
Household income, spending, and savings have held steady in the
past two weeks
24%
40%
36%
21%
Past 2 weeks
42%
37%
Past 2 weeks
15%
61%
23%
Next 2 weeks
Source: McKinsey & Company COVID-19 US Consumer Pulse Survey 11/9–11/13/2020, n = 2,024; 10/23–10/27/2020, n = 2,021, sampled and weighted to match the US general population 18+ years
McKinsey & Company 6
Change in shopping mindset since COVID-191
% of respondents
1 Q: Which best describes how often you are doing each of the following items? Possible answers: “doing less since coronavirus started”; “doing about the same since coronavirus started”; “doing more since coronavirus started”; figures
may not sum to 100% because of rounding.
Shift to value and essentials
6%
7%
9%
10%
11%
54%
55%
61%
62%
69%
40%
39%
30%
28%
20%
Becoming more mindful of where I spend my money
Looking for ways to save money when shopping
Changing to less expensive products to save money
100%
Researching brand and product choices before buying
Spending time planning / making lists for shopping trips
Doing less Doing about the same Doing more
Americans are becoming more mindful of how they spend their
money, and adopting new saving habits
Source: McKinsey & Company COVID-19 US Consumer Pulse Survey 11/9–11/13/2020, n = 2,024, sampled and weighted to match the US general population 18+ years
McKinsey & Company 7
Expected spending per category over the next two weeks compared to usual1
% of respondents
1 Q: Over the next two weeks, do you expect that you will spend more, about the same, or less money on these categories than usual? Figures may not sum to 100% because of rounding.
2 Net intent is calculated by subtracting the % of respondents stating they expect to decrease spending from the % of respondents stating they expect to increase spending.
3 Data not available or insufficient sample (n = < 75) in first survey.
4 Based on small subset (n < 100) of sample population.
9
19
25
29
28
34
46
46
45
58
55
27
13
15
34
51
21
27
16
13
17
14
11
9
7
8
8
13
16
12
11
Alcohol
Footwear
Groceries
Snacks
Quick-service restaurant
Tobacco products
Food takeout & delivery
Restaurant
Apparel
Jewelry
Accessories
Non-food child products
Household supplies
Personal-care products
10Skin care & makeup
Furnishing & appliances
OTC medicines
10
10
Decrease
Stay the same
Increase
17
19
36
48
58
32
35
39
25
50
34
56
60
66
64
65
15
18
11
11
15
12
9
12
15
13
12
7
8
Fitness & wellness
Vitamins/supplements
Pet-care services
Entertainment at home
10
Books/magazines/newspapers
Consumer electronics
Out-of-home entertainment
Personal-care services
Gasoline
Vehicle purchases
Short-term home rentals
International flights
Travel by car
Hotel/resort stays
Cruises4
Adventures & tours
Domestic flights
10
10
Net intent2Net intent2
+18
-14
+3
-39
-3
-12
-17
-14
-23
-37
-39
-35
-50
-47
-5
-24
-11
-1
-26
-37
-47
-22
-20
-29
-13
N/A3
-41
-22
-41
-47
-54
-57
-57
-2
Net intent: Above +1
Net intent: -15 to 0
Net intent: Below -15
Change since
first survey
Change since
first survey
Shift to value and essentials
Consumers report negative spending net intent across all categories
except household essentials
Source: McKinsey & Company COVID-19 US Consumer Pulse Survey 11/9–11/13/2020, n = 2,024; 3/16–3/172020, n = 1,042, sampled and weighted to match the US general population 18+ years
+4
+4
+2
+5
+9
+26
+27
+8
+16
+3
+7
-17
+2
+7
+13
+15
N/A3
N/A3
-4
-15
-1
+15
+13
+20
+21
+24
N/A3
-11
+27
+10
+5
-1
+5
+7
McKinsey & Company 8
Shift to value and essentials
Spending net intent in discretionary categories is trending down as
COVID-19 cases rise
-70
20
-60
-30
-20
-40
10
-50
-10
0
Household supplies
May3
Jun7
Mar17
Nov9
Mar22
May10
Mar29
Apr5
Apr12
Apr19
Apr26
May24
May17
Jun21
Jul12
Aug2
Aug23
Sep24
Personal care products
Groceries
Skin care & makeup
Consumer electronics
Fitness & wellness
Apparel
Oct23
Expected spending per category over the next two weeks compared to usual1
Net intent2
1 Q: Over the next two weeks, do you expect that you will spend more, about the same, or less money on these categories than usual? Figures may not sum to 100% because of rounding.
2 Net intent is calculated by subtracting the % of respondents stating they expect to decrease spending from the % of respondents stating they expect to increase spending.
Source: McKinsey & Company COVID-19 US Consumer Pulse Survey 11/9–11/13/2020, n = 2,024; 10/23–10/27/2020, n = 2,021; 9/18–9/24/2020, n = 1,026 8/19–8/23/2020, n = 2,026; 7/30–8/2/2020, n = 2,024;
7/7–7/12/2020, n = 1,923; 6/15–6/21/2020, n = 2,006; 6/1–6/7/2020, n = 1,966; 5/18–5/24/2020, n = 1,975; 5/11–5/17/2020, n = 2,002; 5/4–5/10/2020, n = 1,993; 4/27–5/3/2020, n = 2,105; 4/20–4/26/2020, n =
1,052; 4/13–4/19/2020, n = 1,052; 4/6–4/12/2020, n = 1,063; 3/30–4/5/2020, n = 1,484; 3/23–3/29/2020, n = 1,119; 3/20–3/22/2020, n = 1,073; 3/16–3/17/2020, n = 1,042; sampled and weighted to match the US general population 18+ years
McKinsey & Company 9
More people expect to make a portion of their purchases online
post-COVID-19 than before…
Consumers’ use of online channel before and expected use after COVID-191,2
% of respondents purchasing online3
1 Q: Before the coronavirus (COVID-19) situation started, what proportion of your purchases in this category were online vs from a physical store/in person?
2 Q: Once the coronavirus (COVID-19) situation has subsided, tell us what proportion of your purchases in this category you think will be online vs from a physical store/in person?
3 Includes respondents who chose “some online,” “most online,” and “all online.” Respondents who indicated that they have not bought the category online and do not intend to do so in the next two weeks are classified as not purchasing online.
4 Expected growth after COVID-19 compared to pre-COVID-19 slightly lower than previous waves due to respondents reporting higher online activity in pre-COVID-19 situation.
27
22
28
27
40
44
33
40
43
29
29
45
50
54
45
48
57
52
59
73
11
+9
Groceries
+7
+9
Accessories
Alcohol
+10
+6
Over-the-counter medicine
Non-food child products
Snacks
+13Fitness & wellness
+13
Food takeout & delivery
+10Personal-care products
Jewelry
+11
+12
Books, magazines, newspapers
Footwear
Vitamins/supplements
+8
+7Household supplies
Tobacco
+9
+10Furnishings & appliances
+11
+11Apparel
+8Skin care & makeup
+9
+8
Consumer electronics
Entertainment at home
Before Expected growth after COVID-19
% growth in customers
purchasing category online
42%
41%
36%
34%
32%
30%
30%
27%
27%
24%
23%
22%
22%
20%
19%
17%
16%
15%
15%
9%
Flight to digital and omnichannel
~20–40%
growth in consumers
who purchase online for
most categories4
Source: McKinsey & Company COVID-19 US Consumer Pulse Survey 11/9–11/13/2020, n = 2,024; sampled and weighted to match the US general population 18+ years
McKinsey & Company 10
Consumers’ use of online channel before and expected use after COVID-191,2
% of respondents purchasing most or all online3
1 Q: Before the coronavirus (COVID-19) situation started, what proportion of your purchases in this category were online vs from a physical store/in person?
2 Q: Once the coronavirus (COVID-19) situation has subsided, tell us what proportion of your purchases in this category you think will be online vs from a physical store/in person?
3 Respondents who indicated that they have not bought the category online and do not intend to do so in the next two weeks are classified as not purchasing online.
4 Expected growth after COVID-19 compared to pre-COVID-19 slightly lower than previous waves due to respondents reporting higher online activity in pre-COVID-19 situation.
9
8
9
9
18
15
11
17
21
10
14
17
23
24
17
24
33
26
34
54
Groceries
+6
+9
+7Alcohol
+7
Jewelry
Over-the-counter medicine
Snacks
+14
+9
Fitness & wellness
+12
+12
Non-food child products
+8Personal-care products
Books, magazines, newspapers
+12
+5
Food takeout & delivery
+9Vitamins/supplements
+10
+7Household supplies
+10
+7Tobacco
Furnishings & appliances
+9Accessories
Apparel
Skin care & makeup +11
Entertainment at home
Footwear
Consumer electronics
+9
+10
Pre-COVID-19 Expected growth after COVID-19
% growth in customers purchasing
category most or all online
51%
83%
91%
81%
76%
75%
77%
70%
43%
71%
48%
56%
39%
41%
68%
40%
31%
45%
18%
17%
~30–80%
growth in consumers who
purchase most or all
online for most
categories4
…with many consumers planning to shift almost completely online
Flight to digital and omnichannel
Source: McKinsey & Company COVID-19 US Consumer Pulse Survey 11/9–11/13/2020, n = 2,024; sampled and weighted to match the US general population 18+ years
McKinsey & Company 11
Have you used or done any of the
following since COVID-19 started1
% of respondents
1 Q: Have you used or done any of the following since the COVID-19 situation started? If yes, Q: Which best describes when you have done or used each of these items? Possible answers: “just started using since COVID-19 started”; “using more
since COVID-19 started”; “using about the same since COVID-19 started”; “using less since COVID-19 started.”
2 Q: Compared to now, will you do or use the following more, less, or not at all, once the coronavirus (COVID-19) situation has subsided? Possible answers: “will stop this”; ”will reduce this”; “will keep doing what I am doing now”; “will increase
this.” Number indicates respondents who chose “will keep doing what I am doing now” and “will increase this” among new or increased users.
7%
6%
3%
24%
17%
4%
8%
4%
5%
7%
5%
3%
19%
16%
5%
25%
19%
16%
19%
11%
15%
7%
8%
5%
8%
10%
4%
3%
4%
13%
9%
12%
8%
2%
4%
3%
Store curbside pickup
Purchased directly from social media
Purchased pre-owned products
Used deal-finding plug-ins
In-store self-checkout
Quick-serve restaurant drive-thru
Meal-kit delivery
Restaurant delivery
Used a new store/restaurant app
Restaurant curbside pickup
Buy online for in-store pickup
Grocery delivery
Just started using Using more Using same/less Not using
Intent to
continue,2 %
46%
55%
58%
62%
79%
51%
65%
57%
62%
71%
57%
83%
Flight to digital and omnichannel
Americans continue to try pickup and delivery services for the first
time, and to intensify their usage of them
Source: McKinsey & Company COVID-19 US Consumer Pulse Survey 11/9–11/13/2020, n = 2,024, sampled and weighted to match the US general population 18+ years
McKinsey & Company 12
0 59 63 775150 706143
50
53 60 80
0
100
45 67 69 73 853 81 8765 79751 47 7149 55 57 83
Purchased from social media
Restaurant delivery
In-store self-checkout
Grocery delivery
Meal-kit delivery
Quick-serve
restaurant
drive-thru
Deal-finding plug-ins
Restaurant curbside pickup
Buy online for in-store pickup
Store curbside pickup
New store/restaurant app
Purchased pre-owned products online
Intent to use after COVID-191
Percent of new or increased users who intend to keep doing activity after COVID-19
1 Q: Compared to now, will you do or use the following more, less, or not at all, once the coronavirus (COVID-19) situation has subsided? Possible answers: “will stop this”; ”will reduce this”; “will keep doing what I am doing now”; “will increase this.”
Number indicates respondents who chose “will keep doing what I am doing now” and “will increase this” among new or increased users.
2 User growth is calculated as % of respondents who replied that they are new users over % of respondents who replied that they were using the product/service pre-COVID-19 (using more, using the same, or using less).
Flight to digital and omnichannel
Consumers say most food-related pickup and delivery habits work
for now; just over half report intending to continue after COVID-19
Accelerated shifts
Potentially here to stay
Works for now
Source: McKinsey & Company COVID-19 US Consumer Pulse Survey 11/9–11/13/2020, n = 2,024, sampled and weighted to match the US general population 18+ years
UsegrowthsinceCOVID-192
McKinsey & Company 13
Trends during COVID-19 suggest that digital delivery for food seems
to work for now, while digital retail has more staying power
Flight to digital and omnichannel
Intent to use after COVID-191
% of new or increased users who intend to keep doing activity after
COVID-19
Low Medium-high
UsergrowthsinceCOVID-192
Medium-highLow
Works for now Accelerated
shifts
Potentially here
to stay
Status quo/
plateauing
1 Q: Compared to now, will you do or use the following more, less, or not at all, once the coronavirus (COVID-19) situation has subsided? Possible answers: “will stop this”; “will reduce this”; “will keep doing what I am doing now”;
“will increase this.”
2 User growth is calculated as % of respondents who replied that they are new users over % of respondents who replied that they were using the product/service pre-COVID-19 (using more, using the same or using less).
Accelerated shifts Potentially here to stay Works for now Status quo/plateauingData not available
Jun Jul Aug Sep Oct Nov
Meal-kit delivery
Restaurant delivery
Grocery delivery
Quick-serve restaurant drive-thru
Restaurant curbside pickup
Store curbside pickup (mostly
grocery)
Used a new store/restaurant app N/A
Buy online for in-store pickup
In-store self-checkout
Used deal-finding plug-ins
N/APurchased directly from social media
Purchased pre-owned products online
Source: McKinsey & Company COVID-19 US Consumer Pulse Survey 11/9–11/13/2020, n = 2,024; 10/23–10/272020, n = 2,021; 9/18–9/24/2020, n = 1,026; 8/19–8/23/2020, n = 2,026; 7/7–7/12/2020, n = 1,923;
6/15–6/21/2020, n = 2,006, sampled and weighted to match the US general population 18+ years
McKinsey & Company 14
Have you used any of the following since COVID-19 started1
% of respondents
Three out of four Americans have tried a new shopping behavior
and most intend to continue beyond the crisis
1 Q: Since the coronavirus (COVID-19) situation started (i.e., within the past ~3 months), which of the following have you done? 23% consumers selected “none of these.”
2 Q: Which best describes whether or not you plan to continue with these shopping changes once the coronavirus (COVID-19) situation has subsided? Possible answers: “will go back to what I did before coronavirus”; ”will keep doing both this and
what I did before coronavirus”; ”will keep doing this and NOT go back to what I did before coronavirus.” Intent to continue includes respondents who selected “will keep doing both this and what I did before coronavirus” and “will keep doing this
and NOT go back to what I did before coronavirus.”
3 “New shopping method” includes curbside pickup and delivery apps.
41%
37%
34%
29%
26%
Different brand
New shopping method3
New digital shopping method
Different retailer/store/website
Private label/store brand
Intent to
continue2
82%
80%
84%
75%
82%
76%
Consumers have tried
a new shopping
behavior
Shock to loyalty
Source: McKinsey & Company COVID-19 US Consumer Pulse Survey 11/9–11/13/2020, n = 2,024, sampled and weighted to match the US general population 18+ years
McKinsey & Company 15
More than 50 percent of consumers cite convenience and value as top
drivers for trying new places to shop
Reason for shopping at a new retailer/store/website since COVID-19 started1
% of respondents selecting reason in top three
1 Q: You mentioned you shopped from a new retailer/store/website since the coronavirus (COVID-19) situation started. What was the main reason you decided to try this new retailer/store/website? Select up to 3.
24%
22%
21%
19%
28%
22%
22%
29%
18%
6%
18%
6%
12%
Better prices/promotions
Offers good delivery/pickup options
More easily accessible from my home
Less crowded / has shorter lines
Can get all the items I need from one place
Better value
Better shipping/delivery costs
Products are in stock
Better quality
Offers natural/organic options
Supporting local businesses
The company treats its employees well
Cleaner/ has better hygiene measures
Convenience
Purpose-driven
Quality/organic
Health/hygiene
Availability
Value
x% Net % of respondents per
category
57%
64%
29%
23%
22%
12%
Shock to loyalty
Source: McKinsey & Company COVID-19 US Consumer Pulse Survey 11/9–11/13/2020, n = 2,024, sampled and weighted to match the US general population 18+ years
McKinsey & Company 16
More than two-thirds of consumers who tried a new brand cite
value as a driver
Reason for trying a new brand since COVID-19 started1
% of respondents selecting reason in top three
1 Q: You mentioned you tried a new/different brand than what you normally buy. What was the main reason that drove this decision? Select up to 3. “Brand” includes different brand, new private label/store brand.
Availability
Value
Health/hygiene
Quality/organic
Purpose-driven
Convenience
x% Net % of respondents per
category
39%
67%
30%
30%
20%
14%
Shock to loyalty
36%
33%
14%
12%
39%
30%
19%
16%
16%
5%
14%
Is available where I’m shopping
Larger package sizes
Better shipping/delivery costs
Better value
Better prices/promotions
Products are in stock
Better quality
Is natural/organic
Supporting local businesses
The company treats its employees well
Cleaner/ has better hygiene measures
Source: McKinsey & Company COVID-19 US Consumer Pulse Survey 11/9–11/13/2020, n = 2,024, sampled and weighted to match the US general population 18+ years
McKinsey & Company 17
Consumer buying based on company behavior1
% of respondents
1 Q: Which best describes how often you are doing each of the following items? Possible answers: “doing less since coronavirus started”; “doing about the same since coronavirus started”; “doing more since coronavirus started.”
Figures may not sum to 100% because of rounding.
Consumers are paying increased attention to how companies treat
their employees
8%
9%
11%
11%
11%
69%
69%
72%
74%
73%
23%
22%
17%
15%
16%
Sustainable/eco-friendly products
How companies take care of the safety of their employees
Healthy and hygienic packaging
Company’s purpose/values
Retailers promotion of sustainable solutions
Doing less Doing moreDoing about the same
Shock to loyalty
Source: McKinsey & Company COVID-19 US Consumer Pulse Survey 11/9–11/13/2020, n = 2,024; 10/23–10/27/2020, n = 2,021, sampled and weighted to match the US general population 18+ years
McKinsey & Company 18
Milestones for the US population not yet engaging with out-of-home activities1
% of respondents awaiting each milestone before engaging
Most Americans are still waiting to see indicators beyond lifting of
restrictions before fully reengaging with out-of-home activities
1 Q: Which best describes when you will regularly return to stores, restaurants, and other out-of-home activities? Chart rebased to exclude those already participating in these activities and those who do not deem any of these items important.
Figures may not sum to 100% because of rounding.
50
31
19
Government lifts
restrictions + other
requirement
Only once there’s a
vaccine or treatment
Government lifts restrictions
Medical authorities deem safe 24%
Stores, restaurants, and other indoor
places start taking safety measures 18%
I see other people returning 9%
Government lifts restrictions and…
64%
of people are not
currently engaging
in “normal” out-of-
home activities,
same as the last
survey
Homebody economy
Source: McKinsey & Company COVID-19 US Consumer Pulse Survey 11/9–11/13/2020, n = 2,024, sampled and weighted to match the US general population 18+ years
McKinsey & Company 19
Consumers engaging in “normal” out-of-home activities1
% of respondents
While more consumers have been engaging in ‘normal’ out-of-home
activities since May, the proportion has leveled off in recent months
1 Q: Which best describes when you will regularly return to stores, restaurants, and other out-of-home activities? Chart shows those already participating in these activities.
Homebody economy
20
27
30
32
36 36 36
12
18
24
30
36
Nov 13May 24 Jul 12Jun 21 Aug 23 Sep 24 Oct 27
Source: McKinsey & Company COVID-19 US Consumer Pulse Survey 11/9–11/13/2020, n = 2,024; 10/23–10/27/2020, n = 2,021; 9/18–9/24/2020, n = 1,026; 8/19–8/23/2020, n = 2,026; 7/30–8/2/2020, n = 2,024;
7/7–7/12/2020, n = 1,923; 6/15–6/21/2020, n = 2,006; 6/1–6/7/2020, n = 1,966; 5/18–5/24/2020, n = 1,975; sampled and weighted to match the US general population 18+ years
McKinsey & Company 20
Most Americans are concerned about traveling by airplane or
public transit, and about attending large events
Consumers’ level of concern undertaking various activities1
% of respondents
1 Q: How worried would you be if you were to do the following activities in the next two weeks? Possible answers: “not worried at all”; “not very worried”; “somewhat worried”; “very worried”; “extremely worried.”; figures may not sum to 100%
because of rounding.
2 Level of concern is calculated by subtracting the % of respondents stating they “not worried at all” and “not very worried” from “very worried” and “extremely worried.”
Level of concern2
38
36
35
27
30
22
25
21
12
5
13
12
7
-3
-16
-23
-15
-2947%
44%
46%
42%
37%
34%
33%
32%
30%
31%
29%
26%
26%
25%
24%
24%
22%
21%
21%
35%
34%
24%
31%
29%
29%
30%
29%
28%
26%
29%
27%
25%
25%
25%
22%
21%
22%
20%
18%
21%
30%
27%
34%
37%
38%
39%
42%
43%
42%
47%
48%
50%
51%
54%
57%
57%
59%
Worried
Go to a hair or nail salon
Shop for non-necessities
Work outside my home
Shop for groceries/necessities
Drive more than 2 hours from home
Get together with family
Get together with friends
Dine at a restaurant or bar
Stay in a hotel
Rent a short-term home
Go to a shopping mall
Go out for family entertainment
Use a clothing rental service
Use a ride-sharing service
Go to the gym or fitness studio
Visit a crowded outdoor public place
Travel by airplane
Use public transportation
Attend a large event
Somewhat worriedNot worried
Homebody economy
3
Source: McKinsey & Company COVID-19 US Consumer Pulse Survey 11/9–11/13/2020, n = 2,024, sampled and weighted to match the US general population 18+ years
McKinsey & Company 21
Masks and barriers continue to be a priority for consumers deciding
where to shop in-store, up eight percentage points since May
Top priorities when deciding where to shop in-store1
% of respondents for whom this criterion is the most important2
1 Q: Once restrictions lift, which of the following factors will be most important to you as you decide which of these places to visit in person? Respondents were asked to select the most important.
2 The following categories are included in each bucket: Cleaning and sanitization—increased cleaning, improved air filtration, availability of sanitizing supplies throughout the store; Health checks—customer wellness check (e.g., temperature) on
entry, employees' wellness check (e.g., temperature) on entry; Masks and barriers—customers and employees wear masks, customers and employees provided masks and gloves, plastic barrier with cashier; No-contact purchasing—curbside
pick-up, cashier-less checkout, no-contact delivery, buy online for pickup in store; Physical distancing—customer number limit, distancing in customer line, reduced employee activity during shopping hours; Store regulations—no customer product
testing, one-way store aisles, special hours for high-risk shoppers.
Homebody economy
Change since the
first measure, pp
+8
-5
+2
-1
-1
-1
33%
25%
13%
12%
9%
8%
Cleaning and sanitization
Physical distancing
Masks and barriers
Store regulations
No-contact purchasing
Health checks
Source: McKinsey & Company COVID-19 US Consumer Pulse Survey 11/9–11/13/2020, n = 2,024; 5/11–5/17/2020, n = 2,002, sampled and weighted to match the US general population 18+ years
McKinsey & Company 22
Americans intend to maintain their current level of engagement with
out-of-home activities for the next two weeks
Consumers’ engagement with activities outside home1,2
% of respondents
1 Q: Did you leave your house for the following activities over the past two weeks? Chart represents the percentage of respondents who indicated that they left home at least once during the past week to do this activity.
2 Q: For which of the following activities do you intend to leave your home to do in the next two weeks? Chart represents % of respondents who intend to leave their home to do this activity during the next two weeks.
78%
54%
43%
40%
36%
31%
23%
24%
16%
17%
15%
15%
15%
11%
10%
Past 2 weeks Next 2 weeks
Homebody economy
83%
54%
42%
42%
38%
32%
24%
23%
17%
16%
15%
15%
14%
10%
9%
Get together with family
Shop for groceries/necessities
Shop for non-necessities
Work outside my home
Go to a hair or nail salon
Drive more than 2 hours away from home
Dine at a restaurant or bar
Travel by airplane
Get together with friends
Visit a crowded outdoor public place
Go to the gym or fitness studio
Go out for family entertainment
Use ride-sharing service
Travel on public transportation
Attend a large event
Source: McKinsey & Company COVID-19 US Consumer Pulse Survey 11/9–11/13/2020, n = 2,024, sampled and weighted to match the US general population 18+ years
McKinsey & Company 23
44%
Somewhat
unsafe
24%
32%Feel unsafe
Feel safe
Top activities eager to get back to2
% of respondents for whom the activity is in their top 3 choices
Get together with family 42%
39%Get together with friends
Attend a concert, sporting event, movie, etc.
36%Dine indoors at a restaurant or bar
15%
26%
Go out for family entertainment
22%Travel by airplane
22%
17%Visit a crowded outdoor public place
16%
Shop for non-necessities
at shopping mall/department store
12%
Go to gym or fitness studio
16%Go to a hair or nail salon
Interact with coworkers in person
Americans are most eager to return to indoor dining and getting
together with friends and family
Level of comfort with out-of-home
activities,1 % of respondents
1 Q: What best describes your comfort participating in activities you did prior to COVID-19? Figures may not sum to 100% because of rounding.
2 Q: What best describes your comfort participating in activities you did prior to COVID-19? If answered “somewhat unsafe” or “unsafe,” Q: Which of the following activities are you most eager to get back to on a regular basis? Select up to 3.
Homebody economy
Source: McKinsey & Company COVID-19 US Consumer Pulse Survey 11/9–11/13/2020, n = 2,024, sampled and weighted to match the US general population 18+ years
McKinsey & Company 24
Compared to lower-income groups, higher-income consumers are
more eager to return to traveling and going to the gym or fitness studio
1 Q: Which of the following activities are you most eager to get back to on a regular basis when it feels totally safe?
2 Q: Difference between income group and overall % of respondents.
Homebody economy
Top activities consumers are eager to get back to1
% of respondents for whom the activity is in their top 3 choices
Income over/under index2
Low Medium High
+2% 0% -3%
2% -1% -1%
+4% -2% -9%
-3% +3% +2%
-9% 0% 12%
1% 0% -1%
-1% -2% 3%
+6% -5% +3%
+1% 0% -2%
-4% +0% +6%
-2% -1% 4%
Source: McKinsey & Company COVID-19 US Consumer Pulse Survey 11/9–11/13/2020, n = 2,024, sampled and weighted to match the US general population 18+ years
Go out for family entertainment
42%
Dine indoors at a restaurant/bar
Get together with family
Attend a concert, sporting event, movie, etc.
Get together with friends 39%
36%
26%
22%Travel by airplane
22%
17%Visit a crowded outdoor public place
16%Shop for non-necessities at shopping mall/department store
16%Go to a hair or nail salon
15%Go to gym or fitness studio
12%Interact with coworkers in person
McKinsey & Company 25
Americans have acquired at-home alternatives to out-of-home
activities, such as telemedicine and video chat
18%
3%
4%
3%
2%
2%
3%
4%
2%
25%
7%
5%
4%
21%
12%
37%
16%
12%
8%
8%
6%
7%
8%
5%
4%
34%
14%
7%
10%
35%
14%
5%
9%
7%
6%
8%
14%
4%
4%
8%
2%
2%
4%
6%
3%
3%
6%
Watching e-sports
Remote learning: my children
Wellness app
Cooked regularly for myself/my family
Video chat: personal
Social media
Playing online games
Videoconferencing: professional
TikTok
Online streaming
Remote learning: myself
Digital exercise machine
Personal care/grooming at home
Online fitness
Telemedicine: physical
2%
Telemedicine: mental
Not using Using moreUsing less / the same Just started usingHave you used or done any of the
following since COVID-19 started1
% of respondents
Intent to
continue,2 %
74%
57%
47%
60%
49%
50%
66%
79%
53%
65%
65%
82%
69%
59%
65%
59%
1 Q: Have you used or done any of the following since the COVID-19 situation started? If yes, Q: Which best describes when you have done or used each of these items? Possible answers: “just started using since COVID-19 started”; “using more
since COVID-19 started”; “using about the same since COVID-19 started”; “using less since COVID-19 started.”
2 Q: Compared to now, will you do or use the following more, less, or not at all, once the coronavirus (COVID-19) situation has subsided? Possible answers: “will stop this”; ”will reduce this”; “will keep doing what I am doing now”; “will increase
this.” Number indicates respondents who chose “will keep doing what I am doing now” and “will increase this” among new or increased users.
Homebody economy
Source: McKinsey & Company COVID-19 US Consumer Pulse Survey 11/9–11/13/2020, n = 2,024, sampled and weighted to match the US general population 18+ years
McKinsey & Company 26
UsergrowthsinceCOVID-192
Intent to use after COVID-191
Percent of new or increased users who intend to keep doing activity after COVID-19
1 Q: Compared to now, will you do or use the following more, less, or not at all, once the coronavirus (COVID-19) situation has subsided? Possible answers: “will stop this”; ”will reduce this”; “will keep doing what I am doing now”; “will increase this.”
Number indicates respondents who chose “will keep doing what I am doing now” and “will increase this” among new or increased users.
2 User growth is calculated as % of respondents who replied that they are new users over % of respondents who replied that they were using the product/service pre-COVID-19 (using more, using the same, or using less).
Online entertainment and wellness habits adopted during the crisis
are likely to remain for the medium to long term
Homebody economy
55
200
150
0 48
100
50 8260 8165 70 75 80
0
50
Video chat: personal Digital exercise machine
Remote learning: my children
Used social media
Playing online games
Remote learning: myself
Online fitness
Telemedicine: mental
Cooked regularlyPersonal care/grooming at home
Videoconferencing: professional
Wellness appWatching e-sports
Online streaming
Telemedicine: physical
TikTok
Works for now
Accelerated shifts
Potentially here to
stay
Source: McKinsey & Company COVID-19 US Consumer Pulse Survey 11/9–11/13/2020, n = 2,024, sampled and weighted to match the US general population 18+ years
McKinsey & Company 27
Video alternatives to communication seem to work for now, while
other at-home alternatives seem stickier
Homebody economy
1 Q: Compared to now, will you do or use the following more, less, or not at all, once the coronavirus (COVID-19) situation has subsided? Possible answers: “will stop this”; ”will reduce this”; “will keep doing what I am doing now”; “will increase
this.” Number indicates respondents who chose “will keep doing what I am doing now” and “will increase this” among new or increased users.
2 User growth is calculated as % of respondents who replied that they are new users over % of respondents who replied that they were using the product/service pre-COVID-19 (using more, using the same, or using less).
Intent to use after COVID-191
% of new or increased users who intend to keep doing activity once
pandemic subsides
Low Medium-high
UsergrowthsinceCOVID-192
Medium-highLow
Works for now Accelerated
shifts
Potentially here
to stay
Status quo /
plateauing
Accelerated shifts Potentially here to stay Works for now Status quo / plateauingData not available4
Jun Jul Aug Sep Oct Nov
Online fitness
Digital exercise machine
Wellness app
Online streaming
TikTok
Used social media
N/A
Cooked regularly
Videoconferencing: professional
Video chat: personal
Telemedicine: physical
Telemedicine: mental
Remote learning: myself
Remote learning: my children
Source: McKinsey & Company COVID-19 US Consumer Pulse Survey 11/9–11/13/2020, n = 2,024; 10/23–10/272020, n = 2,021; 9/18–9/24/2020, n = 1,026; 8/19–8/23/2020, n = 2,026; 7/7–7/12/2020, n = 1,923;
6/15–6/21/2020, n = 2,006, sampled and weighted to match the US general population 18+ years
McKinsey & Company 28
Omnichannel and telemedicine activity continue to grow, but at-home
social interaction alternatives have declined since April
1 Q: Have you used or done any of the following since the COVID-19 situation started? If yes, Q: Which best describes when you have done or used each of these items? Possible answers: “just started using since COVID-19 started”; “using more
since COVID-19 started”; “using about the same since COVID-19 started”; “using less since COVID-19 started.”
2 Q: Compared to now, will you do or use the following more, less, or not at all, once the coronavirus (COVID-19) situation has subsided? Possible answers: “will stop this”; ”will reduce this”; “will keep doing what I am doing now”; “will increase
this.” Number indicates respondents who chose “will keep doing what I am doing now” and “will increase this” among new or increased users.
3 Change since first survey is calculated by subtracting % new/increased users in April from % new/increased users in November.
Have you started/increased usage since COVID-19 started1,2
% of respondents
42
29
28
28
23
23
27
26
25
20
16
14
21
13
12
11
18
13
12
Online fitness
Online streaming
Wellness app
Quick-serve restaurant drive-thru
Restaurant curbside pickup
Store curbside pickup
Telemedicine: physical
Buy online for in-store pickup
In-store self-checkout
Remote learning: my children
Videoconferencing: professional
Video chat: personal
Remote learning: myself
Telemedicine: mental
Playing online games
TikTok
Watching e-sports
Restaurant delivery
Grocery delivery
Change from April,
(difference between November
and April %)3New/increased users
-4
-3
+4
+2
+2
+8
+9
+8
+8
+6
+8
+3
+7
+11
+0
+2
+2
+2
+4
Homebody economy
Source: McKinsey & Company COVID-19 US Consumer Pulse Survey 11/9–11/13/2020, n = 2,024, sampled and weighted to match the US general population 18+ years
McKinsey & Company 29
17%
33%
50%
Hybrid
Online only
In-person only
1 Q: What education format is your child/children’s school primarily using today? Figures may not sum to 100% because of rounding.
2 Q: Please indicate how strongly you agree or disagree with each of the following statements. Statements include: “I expect remote learning to be a key education format for formal and/or informal education for the next 3 months”; “given
the uncertainty of school openings, I am planning to spend more on at-home learning tools and equipment (e.g., tutoring services, desk equipment, electronics)”; “I have cut back my work hours given my child/children’s at-home learning
needs.” Rated from 1 “strongly disagree” to 6 “strongly agree.” Figures may not sum to 100% because of rounding.
Remote learning is widespread and families expect it to continue,
therefore many are making changes to adapt
Education format1
% of respondents
Homebody economy
52
44
35
Expect online to
continue for 3+ months
Invest in at-home
learning tools
Reduce work hours
Agree/Strongly agree
Change in beliefs/behaviors for those with children in remote
learning,2 % of respondents
~83%
of children in
some form of
remote learning
Source: McKinsey & Company COVID-19 US Consumer Pulse Survey 11/9–11/13/2020, n = 2,024, sampled and weighted to match the US general population 18+ years
McKinsey & Company 30
1 Q: Please indicate how strongly you agree or disagree with each of the following statements: “I have cut back my work hours given my child/children’s at-home
learning needs.” Rated from 1 “strongly disagree” to 6 “strongly agree.” Figures may not sum to 100% because of rounding.
$50K–$100K
Overall 35
30<$50K
>$100K
Agree/Strongly agree
27
43
Reduction in work hours for those with children in remote learning1
% of respondents
One-third of families with children have reduced work hours to
meet at-home learning needs
Homebody economy
43%
of high-income
families have reduced
work hours
Source: McKinsey & Company COVID-19 US Consumer Pulse Survey 11/9–11/13/2020, n = 2,024, sampled and weighted to match the US general population 18+ years
McKinsey & Company 31
Disclaimer
McKinsey does not provide legal, medical, or other regulated advice or
guarantee results. These materials reflect general insight and best practice
based on information currently available and do not contain all of the
information needed to determine a future course of action. Such information
has not been generated or independently verified by McKinsey and is
inherently uncertain and subject to change. McKinsey has no obligation to
update these materials and makes no representation or warranty and
expressly disclaims any liability with respect thereto.

Weitere ähnliche Inhalte

Was ist angesagt?

Was ist angesagt? (20)

18th Annual Global CEO Survey - Technology industry key findings
18th Annual Global CEO Survey - Technology industry key findings18th Annual Global CEO Survey - Technology industry key findings
18th Annual Global CEO Survey - Technology industry key findings
 
EY's European Banking Barometer – 2015
EY's European Banking Barometer – 2015 EY's European Banking Barometer – 2015
EY's European Banking Barometer – 2015
 
Strategy Study 2014 | A.T. Kearney
Strategy Study 2014 | A.T. KearneyStrategy Study 2014 | A.T. Kearney
Strategy Study 2014 | A.T. Kearney
 
IBOR transition: Opportunities and challenges for the asset management industry
IBOR transition: Opportunities and challenges for the asset management industryIBOR transition: Opportunities and challenges for the asset management industry
IBOR transition: Opportunities and challenges for the asset management industry
 
Booz Allen Hamilton and Market Connections: C4ISR Survey Report
Booz Allen Hamilton and Market Connections: C4ISR Survey ReportBooz Allen Hamilton and Market Connections: C4ISR Survey Report
Booz Allen Hamilton and Market Connections: C4ISR Survey Report
 
Top 8 Insights From the 2018 Beauty, Health & Wellness Survey
Top 8 Insights From the 2018 Beauty, Health & Wellness SurveyTop 8 Insights From the 2018 Beauty, Health & Wellness Survey
Top 8 Insights From the 2018 Beauty, Health & Wellness Survey
 
Australia: Taking Bigger Steps | A.T. Kearney
Australia: Taking Bigger Steps | A.T. KearneyAustralia: Taking Bigger Steps | A.T. Kearney
Australia: Taking Bigger Steps | A.T. Kearney
 
2019 Media and Entertainment Study
2019 Media and Entertainment Study2019 Media and Entertainment Study
2019 Media and Entertainment Study
 
Infrastructure Victoria - AZ/ZEV International Scan
Infrastructure Victoria - AZ/ZEV International ScanInfrastructure Victoria - AZ/ZEV International Scan
Infrastructure Victoria - AZ/ZEV International Scan
 
#BainWebinar Procurement Best Practices Through Covid19
#BainWebinar Procurement Best Practices Through Covid19 #BainWebinar Procurement Best Practices Through Covid19
#BainWebinar Procurement Best Practices Through Covid19
 
Navigating a digital-first home furnishings market
Navigating a digital-first home furnishings market Navigating a digital-first home furnishings market
Navigating a digital-first home furnishings market
 
Creating a Winning Recipe for a Meal Kits Program
Creating a Winning Recipe for a Meal Kits ProgramCreating a Winning Recipe for a Meal Kits Program
Creating a Winning Recipe for a Meal Kits Program
 
A.T. Kearney Consolidation of the US Banking Industry
A.T. Kearney Consolidation of the US Banking IndustryA.T. Kearney Consolidation of the US Banking Industry
A.T. Kearney Consolidation of the US Banking Industry
 
Turning big data into big revenue
Turning big data into big revenueTurning big data into big revenue
Turning big data into big revenue
 
#BainWebinar Next Generation Industrial Performance Post COVID-19
#BainWebinar Next Generation Industrial Performance Post COVID-19#BainWebinar Next Generation Industrial Performance Post COVID-19
#BainWebinar Next Generation Industrial Performance Post COVID-19
 
EY Germany FinTech Landscape
EY Germany FinTech LandscapeEY Germany FinTech Landscape
EY Germany FinTech Landscape
 
Global Capital Confidence Barometer 21st edition
Global Capital Confidence Barometer 21st editionGlobal Capital Confidence Barometer 21st edition
Global Capital Confidence Barometer 21st edition
 
Chinese Internet Economy White Paper 2.0 - Decoding the Chinese Internet 2.0:...
Chinese Internet Economy White Paper 2.0 - Decoding the Chinese Internet 2.0:...Chinese Internet Economy White Paper 2.0 - Decoding the Chinese Internet 2.0:...
Chinese Internet Economy White Paper 2.0 - Decoding the Chinese Internet 2.0:...
 
New horizons in transportation: mobility, innovation, economic development an...
New horizons in transportation: mobility, innovation, economic development an...New horizons in transportation: mobility, innovation, economic development an...
New horizons in transportation: mobility, innovation, economic development an...
 
Cracking the Code on Consumer Fraud | Accenture
Cracking the Code on Consumer Fraud | AccentureCracking the Code on Consumer Fraud | Accenture
Cracking the Code on Consumer Fraud | Accenture
 

Ähnlich wie McKinsey Survey: US consumer sentiment during the coronavirus crisis

Ähnlich wie McKinsey Survey: US consumer sentiment during the coronavirus crisis (20)

McKinsey Survey: Canadian consumer sentiment during the coronavirus crisis
McKinsey Survey: Canadian consumer sentiment during the coronavirus crisisMcKinsey Survey: Canadian consumer sentiment during the coronavirus crisis
McKinsey Survey: Canadian consumer sentiment during the coronavirus crisis
 
McKinsey Survey: Chinese consumer sentiment during the coronavirus crisis
McKinsey Survey: Chinese consumer sentiment during the coronavirus crisisMcKinsey Survey: Chinese consumer sentiment during the coronavirus crisis
McKinsey Survey: Chinese consumer sentiment during the coronavirus crisis
 
McKinsey Survey: Saudi consumer sentiment during the coronavirus crisis
McKinsey Survey: Saudi consumer sentiment during the coronavirus crisisMcKinsey Survey: Saudi consumer sentiment during the coronavirus crisis
McKinsey Survey: Saudi consumer sentiment during the coronavirus crisis
 
McKinsey Survey: Emirati consumer sentiment during the coronavirus crisis
McKinsey Survey: Emirati consumer sentiment during the coronavirus crisisMcKinsey Survey: Emirati consumer sentiment during the coronavirus crisis
McKinsey Survey: Emirati consumer sentiment during the coronavirus crisis
 
McKinsey Survey: Central American consumer sentiment during the coronavirus c...
McKinsey Survey: Central American consumer sentiment during the coronavirus c...McKinsey Survey: Central American consumer sentiment during the coronavirus c...
McKinsey Survey: Central American consumer sentiment during the coronavirus c...
 
McKinsey Survey: Chinese consumer sentiment during the coronavirus crisis
McKinsey Survey: Chinese consumer sentiment during the coronavirus crisisMcKinsey Survey: Chinese consumer sentiment during the coronavirus crisis
McKinsey Survey: Chinese consumer sentiment during the coronavirus crisis
 
McKinsey Survey: Chilean consumer sentiment during the coronavirus crisis
McKinsey Survey: Chilean consumer sentiment during the coronavirus crisisMcKinsey Survey: Chilean consumer sentiment during the coronavirus crisis
McKinsey Survey: Chilean consumer sentiment during the coronavirus crisis
 
McKinsey Survey: Filipino consumer sentiment during the coronavirus crisis
McKinsey Survey: Filipino consumer sentiment during the coronavirus crisisMcKinsey Survey: Filipino consumer sentiment during the coronavirus crisis
McKinsey Survey: Filipino consumer sentiment during the coronavirus crisis
 
McKinsey Survey: Emirati consumer sentiment during the coronavirus crisis
McKinsey Survey: Emirati consumer sentiment during the coronavirus crisisMcKinsey Survey: Emirati consumer sentiment during the coronavirus crisis
McKinsey Survey: Emirati consumer sentiment during the coronavirus crisis
 
McKinsey Survey: Belgian consumer sentiment during the coronavirus crisis
McKinsey Survey: Belgian consumer sentiment during the coronavirus crisisMcKinsey Survey: Belgian consumer sentiment during the coronavirus crisis
McKinsey Survey: Belgian consumer sentiment during the coronavirus crisis
 
McKinsey Survey: Spanish consumer sentiment during the coronavirus crisis
McKinsey Survey: Spanish consumer sentiment during the coronavirus crisisMcKinsey Survey: Spanish consumer sentiment during the coronavirus crisis
McKinsey Survey: Spanish consumer sentiment during the coronavirus crisis
 
McKinsey Survey: German consumer sentiment during the coronavirus crisis
McKinsey Survey: German consumer sentiment during the coronavirus crisisMcKinsey Survey: German consumer sentiment during the coronavirus crisis
McKinsey Survey: German consumer sentiment during the coronavirus crisis
 
McKinsey Survey: German consumer sentiment during the coronavirus crisis
McKinsey Survey: German consumer sentiment during the coronavirus crisisMcKinsey Survey: German consumer sentiment during the coronavirus crisis
McKinsey Survey: German consumer sentiment during the coronavirus crisis
 
McKinsey Survey: German consumer sentiment during the coronavirus crisis
McKinsey Survey: German consumer sentiment during the coronavirus crisisMcKinsey Survey: German consumer sentiment during the coronavirus crisis
McKinsey Survey: German consumer sentiment during the coronavirus crisis
 
McKinsey Survey: Saudi consumer sentiment during the coronavirus crisis
McKinsey Survey: Saudi consumer sentiment during the coronavirus crisisMcKinsey Survey: Saudi consumer sentiment during the coronavirus crisis
McKinsey Survey: Saudi consumer sentiment during the coronavirus crisis
 
McKinsey Survey: Colombian consumer sentiment during the coronavirus crisis
McKinsey Survey: Colombian consumer sentiment during the coronavirus crisisMcKinsey Survey: Colombian consumer sentiment during the coronavirus crisis
McKinsey Survey: Colombian consumer sentiment during the coronavirus crisis
 
McKinsey Survey: Argentinian consumer sentiment during the coronavirus crisis
McKinsey Survey: Argentinian consumer sentiment during the coronavirus crisisMcKinsey Survey: Argentinian consumer sentiment during the coronavirus crisis
McKinsey Survey: Argentinian consumer sentiment during the coronavirus crisis
 
McKinsey Survey: Chinese consumer sentiment during the coronavirus crisis
McKinsey Survey: Chinese consumer sentiment during the coronavirus crisisMcKinsey Survey: Chinese consumer sentiment during the coronavirus crisis
McKinsey Survey: Chinese consumer sentiment during the coronavirus crisis
 
McKinsey Survey: Peruvian consumer sentiment during the coronavirus crisis
McKinsey Survey: Peruvian consumer sentiment during the coronavirus crisisMcKinsey Survey: Peruvian consumer sentiment during the coronavirus crisis
McKinsey Survey: Peruvian consumer sentiment during the coronavirus crisis
 
McKinsey Survey: Australian consumer sentiment during the coronavirus crisis
McKinsey Survey: Australian consumer sentiment during the coronavirus crisisMcKinsey Survey: Australian consumer sentiment during the coronavirus crisis
McKinsey Survey: Australian consumer sentiment during the coronavirus crisis
 

Mehr von McKinsey on Marketing & Sales

Mehr von McKinsey on Marketing & Sales (20)

McKinsey European consumer sentiment survey: How current events are shaping S...
McKinsey European consumer sentiment survey: How current events are shaping S...McKinsey European consumer sentiment survey: How current events are shaping S...
McKinsey European consumer sentiment survey: How current events are shaping S...
 
McKinsey European consumer sentiment survey: How current events are shaping U...
McKinsey European consumer sentiment survey: How current events are shaping U...McKinsey European consumer sentiment survey: How current events are shaping U...
McKinsey European consumer sentiment survey: How current events are shaping U...
 
McKinsey European consumer sentiment survey: How current events are shaping I...
McKinsey European consumer sentiment survey: How current events are shaping I...McKinsey European consumer sentiment survey: How current events are shaping I...
McKinsey European consumer sentiment survey: How current events are shaping I...
 
McKinsey European consumer sentiment survey: How current events are shaping G...
McKinsey European consumer sentiment survey: How current events are shaping G...McKinsey European consumer sentiment survey: How current events are shaping G...
McKinsey European consumer sentiment survey: How current events are shaping G...
 
McKinsey European consumer sentiment survey: How current events are shaping F...
McKinsey European consumer sentiment survey: How current events are shaping F...McKinsey European consumer sentiment survey: How current events are shaping F...
McKinsey European consumer sentiment survey: How current events are shaping F...
 
McKinsey Survey: Japanese consumer sentiment during the coronavirus crisis
McKinsey Survey: Japanese consumer sentiment during the coronavirus crisisMcKinsey Survey: Japanese consumer sentiment during the coronavirus crisis
McKinsey Survey: Japanese consumer sentiment during the coronavirus crisis
 
McKinsey Survey: Australian consumer sentiment during the coronavirus crisis
McKinsey Survey: Australian consumer sentiment during the coronavirus crisisMcKinsey Survey: Australian consumer sentiment during the coronavirus crisis
McKinsey Survey: Australian consumer sentiment during the coronavirus crisis
 
McKinsey Survey: Indian consumer sentiment during the coronavirus crisis
McKinsey Survey: Indian consumer sentiment during the coronavirus crisisMcKinsey Survey: Indian consumer sentiment during the coronavirus crisis
McKinsey Survey: Indian consumer sentiment during the coronavirus crisis
 
McKinsey: Survey: Indonesian consumer sentiment during the coronavirus crisis
McKinsey: Survey: Indonesian consumer sentiment during the coronavirus crisisMcKinsey: Survey: Indonesian consumer sentiment during the coronavirus crisis
McKinsey: Survey: Indonesian consumer sentiment during the coronavirus crisis
 
McKinsey Survey: Korean consumer sentiment during the coronavirus crisis
McKinsey Survey: Korean consumer sentiment during the coronavirus crisisMcKinsey Survey: Korean consumer sentiment during the coronavirus crisis
McKinsey Survey: Korean consumer sentiment during the coronavirus crisis
 
McKinsey European consumer sentiment survey: How current events are shaping F...
McKinsey European consumer sentiment survey: How current events are shaping F...McKinsey European consumer sentiment survey: How current events are shaping F...
McKinsey European consumer sentiment survey: How current events are shaping F...
 
McKinsey European consumer sentiment survey: How current events are shaping U...
McKinsey European consumer sentiment survey: How current events are shaping U...McKinsey European consumer sentiment survey: How current events are shaping U...
McKinsey European consumer sentiment survey: How current events are shaping U...
 
McKinsey European consumer sentiment survey: How current events are shaping G...
McKinsey European consumer sentiment survey: How current events are shaping G...McKinsey European consumer sentiment survey: How current events are shaping G...
McKinsey European consumer sentiment survey: How current events are shaping G...
 
McKinsey European consumer sentiment survey: How current events in Europe are...
McKinsey European consumer sentiment survey: How current events in Europe are...McKinsey European consumer sentiment survey: How current events in Europe are...
McKinsey European consumer sentiment survey: How current events in Europe are...
 
McKinsey European consumer sentiment survey: How current events are shaping S...
McKinsey European consumer sentiment survey: How current events are shaping S...McKinsey European consumer sentiment survey: How current events are shaping S...
McKinsey European consumer sentiment survey: How current events are shaping S...
 
McKinsey European consumer sentiment survey: How current events are shaping I...
McKinsey European consumer sentiment survey: How current events are shaping I...McKinsey European consumer sentiment survey: How current events are shaping I...
McKinsey European consumer sentiment survey: How current events are shaping I...
 
McKinsey survey: European consumer sentiment survey: How current events are s...
McKinsey survey: European consumer sentiment survey: How current events are s...McKinsey survey: European consumer sentiment survey: How current events are s...
McKinsey survey: European consumer sentiment survey: How current events are s...
 
McKinsey survey: European consumer sentiment survey: How current events are s...
McKinsey survey: European consumer sentiment survey: How current events are s...McKinsey survey: European consumer sentiment survey: How current events are s...
McKinsey survey: European consumer sentiment survey: How current events are s...
 

Kürzlich hochgeladen

Call Girls Jp Nagar Just Call 👗 7737669865 👗 Top Class Call Girl Service Bang...
Call Girls Jp Nagar Just Call 👗 7737669865 👗 Top Class Call Girl Service Bang...Call Girls Jp Nagar Just Call 👗 7737669865 👗 Top Class Call Girl Service Bang...
Call Girls Jp Nagar Just Call 👗 7737669865 👗 Top Class Call Girl Service Bang...
amitlee9823
 
FULL ENJOY Call Girls In Mahipalpur Delhi Contact Us 8377877756
FULL ENJOY Call Girls In Mahipalpur Delhi Contact Us 8377877756FULL ENJOY Call Girls In Mahipalpur Delhi Contact Us 8377877756
FULL ENJOY Call Girls In Mahipalpur Delhi Contact Us 8377877756
dollysharma2066
 
FULL ENJOY Call Girls In Majnu Ka Tilla, Delhi Contact Us 8377877756
FULL ENJOY Call Girls In Majnu Ka Tilla, Delhi Contact Us 8377877756FULL ENJOY Call Girls In Majnu Ka Tilla, Delhi Contact Us 8377877756
FULL ENJOY Call Girls In Majnu Ka Tilla, Delhi Contact Us 8377877756
dollysharma2066
 
Call Girls In DLf Gurgaon ➥99902@11544 ( Best price)100% Genuine Escort In 24...
Call Girls In DLf Gurgaon ➥99902@11544 ( Best price)100% Genuine Escort In 24...Call Girls In DLf Gurgaon ➥99902@11544 ( Best price)100% Genuine Escort In 24...
Call Girls In DLf Gurgaon ➥99902@11544 ( Best price)100% Genuine Escort In 24...
lizamodels9
 
Call Girls In Noida 959961⊹3876 Independent Escort Service Noida
Call Girls In Noida 959961⊹3876 Independent Escort Service NoidaCall Girls In Noida 959961⊹3876 Independent Escort Service Noida
Call Girls In Noida 959961⊹3876 Independent Escort Service Noida
dlhescort
 
Nelamangala Call Girls: 🍓 7737669865 🍓 High Profile Model Escorts | Bangalore...
Nelamangala Call Girls: 🍓 7737669865 🍓 High Profile Model Escorts | Bangalore...Nelamangala Call Girls: 🍓 7737669865 🍓 High Profile Model Escorts | Bangalore...
Nelamangala Call Girls: 🍓 7737669865 🍓 High Profile Model Escorts | Bangalore...
amitlee9823
 
Call Girls in Delhi, Escort Service Available 24x7 in Delhi 959961-/-3876
Call Girls in Delhi, Escort Service Available 24x7 in Delhi 959961-/-3876Call Girls in Delhi, Escort Service Available 24x7 in Delhi 959961-/-3876
Call Girls in Delhi, Escort Service Available 24x7 in Delhi 959961-/-3876
dlhescort
 
Call Girls Electronic City Just Call 👗 7737669865 👗 Top Class Call Girl Servi...
Call Girls Electronic City Just Call 👗 7737669865 👗 Top Class Call Girl Servi...Call Girls Electronic City Just Call 👗 7737669865 👗 Top Class Call Girl Servi...
Call Girls Electronic City Just Call 👗 7737669865 👗 Top Class Call Girl Servi...
amitlee9823
 
Call Girls From Pari Chowk Greater Noida ❤️8448577510 ⊹Best Escorts Service I...
Call Girls From Pari Chowk Greater Noida ❤️8448577510 ⊹Best Escorts Service I...Call Girls From Pari Chowk Greater Noida ❤️8448577510 ⊹Best Escorts Service I...
Call Girls From Pari Chowk Greater Noida ❤️8448577510 ⊹Best Escorts Service I...
lizamodels9
 

Kürzlich hochgeladen (20)

Mysore Call Girls 8617370543 WhatsApp Number 24x7 Best Services
Mysore Call Girls 8617370543 WhatsApp Number 24x7 Best ServicesMysore Call Girls 8617370543 WhatsApp Number 24x7 Best Services
Mysore Call Girls 8617370543 WhatsApp Number 24x7 Best Services
 
Famous Olympic Siblings from the 21st Century
Famous Olympic Siblings from the 21st CenturyFamous Olympic Siblings from the 21st Century
Famous Olympic Siblings from the 21st Century
 
Call Girls Jp Nagar Just Call 👗 7737669865 👗 Top Class Call Girl Service Bang...
Call Girls Jp Nagar Just Call 👗 7737669865 👗 Top Class Call Girl Service Bang...Call Girls Jp Nagar Just Call 👗 7737669865 👗 Top Class Call Girl Service Bang...
Call Girls Jp Nagar Just Call 👗 7737669865 👗 Top Class Call Girl Service Bang...
 
FULL ENJOY Call Girls In Mahipalpur Delhi Contact Us 8377877756
FULL ENJOY Call Girls In Mahipalpur Delhi Contact Us 8377877756FULL ENJOY Call Girls In Mahipalpur Delhi Contact Us 8377877756
FULL ENJOY Call Girls In Mahipalpur Delhi Contact Us 8377877756
 
Call Girls Ludhiana Just Call 98765-12871 Top Class Call Girl Service Available
Call Girls Ludhiana Just Call 98765-12871 Top Class Call Girl Service AvailableCall Girls Ludhiana Just Call 98765-12871 Top Class Call Girl Service Available
Call Girls Ludhiana Just Call 98765-12871 Top Class Call Girl Service Available
 
FULL ENJOY Call Girls In Majnu Ka Tilla, Delhi Contact Us 8377877756
FULL ENJOY Call Girls In Majnu Ka Tilla, Delhi Contact Us 8377877756FULL ENJOY Call Girls In Majnu Ka Tilla, Delhi Contact Us 8377877756
FULL ENJOY Call Girls In Majnu Ka Tilla, Delhi Contact Us 8377877756
 
Cracking the Cultural Competence Code.pptx
Cracking the Cultural Competence Code.pptxCracking the Cultural Competence Code.pptx
Cracking the Cultural Competence Code.pptx
 
Call Girls In DLf Gurgaon ➥99902@11544 ( Best price)100% Genuine Escort In 24...
Call Girls In DLf Gurgaon ➥99902@11544 ( Best price)100% Genuine Escort In 24...Call Girls In DLf Gurgaon ➥99902@11544 ( Best price)100% Genuine Escort In 24...
Call Girls In DLf Gurgaon ➥99902@11544 ( Best price)100% Genuine Escort In 24...
 
Falcon Invoice Discounting platform in india
Falcon Invoice Discounting platform in indiaFalcon Invoice Discounting platform in india
Falcon Invoice Discounting platform in india
 
Call Girls In Noida 959961⊹3876 Independent Escort Service Noida
Call Girls In Noida 959961⊹3876 Independent Escort Service NoidaCall Girls In Noida 959961⊹3876 Independent Escort Service Noida
Call Girls In Noida 959961⊹3876 Independent Escort Service Noida
 
Monthly Social Media Update April 2024 pptx.pptx
Monthly Social Media Update April 2024 pptx.pptxMonthly Social Media Update April 2024 pptx.pptx
Monthly Social Media Update April 2024 pptx.pptx
 
Uneak White's Personal Brand Exploration Presentation
Uneak White's Personal Brand Exploration PresentationUneak White's Personal Brand Exploration Presentation
Uneak White's Personal Brand Exploration Presentation
 
Nelamangala Call Girls: 🍓 7737669865 🍓 High Profile Model Escorts | Bangalore...
Nelamangala Call Girls: 🍓 7737669865 🍓 High Profile Model Escorts | Bangalore...Nelamangala Call Girls: 🍓 7737669865 🍓 High Profile Model Escorts | Bangalore...
Nelamangala Call Girls: 🍓 7737669865 🍓 High Profile Model Escorts | Bangalore...
 
Call Girls In Panjim North Goa 9971646499 Genuine Service
Call Girls In Panjim North Goa 9971646499 Genuine ServiceCall Girls In Panjim North Goa 9971646499 Genuine Service
Call Girls In Panjim North Goa 9971646499 Genuine Service
 
Call Girls in Delhi, Escort Service Available 24x7 in Delhi 959961-/-3876
Call Girls in Delhi, Escort Service Available 24x7 in Delhi 959961-/-3876Call Girls in Delhi, Escort Service Available 24x7 in Delhi 959961-/-3876
Call Girls in Delhi, Escort Service Available 24x7 in Delhi 959961-/-3876
 
It will be International Nurses' Day on 12 May
It will be International Nurses' Day on 12 MayIt will be International Nurses' Day on 12 May
It will be International Nurses' Day on 12 May
 
BAGALUR CALL GIRL IN 98274*61493 ❤CALL GIRLS IN ESCORT SERVICE❤CALL GIRL
BAGALUR CALL GIRL IN 98274*61493 ❤CALL GIRLS IN ESCORT SERVICE❤CALL GIRLBAGALUR CALL GIRL IN 98274*61493 ❤CALL GIRLS IN ESCORT SERVICE❤CALL GIRL
BAGALUR CALL GIRL IN 98274*61493 ❤CALL GIRLS IN ESCORT SERVICE❤CALL GIRL
 
Call Girls Electronic City Just Call 👗 7737669865 👗 Top Class Call Girl Servi...
Call Girls Electronic City Just Call 👗 7737669865 👗 Top Class Call Girl Servi...Call Girls Electronic City Just Call 👗 7737669865 👗 Top Class Call Girl Servi...
Call Girls Electronic City Just Call 👗 7737669865 👗 Top Class Call Girl Servi...
 
Business Model Canvas (BMC)- A new venture concept
Business Model Canvas (BMC)-  A new venture conceptBusiness Model Canvas (BMC)-  A new venture concept
Business Model Canvas (BMC)- A new venture concept
 
Call Girls From Pari Chowk Greater Noida ❤️8448577510 ⊹Best Escorts Service I...
Call Girls From Pari Chowk Greater Noida ❤️8448577510 ⊹Best Escorts Service I...Call Girls From Pari Chowk Greater Noida ❤️8448577510 ⊹Best Escorts Service I...
Call Girls From Pari Chowk Greater Noida ❤️8448577510 ⊹Best Escorts Service I...
 

McKinsey Survey: US consumer sentiment during the coronavirus crisis

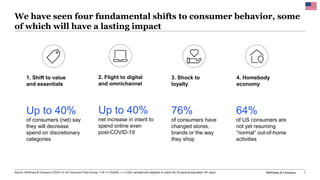
  • 1. McKinsey & Company 1 We have seen four fundamental shifts to consumer behavior, some of which will have a lasting impact Up to 40% net increase in intent to spend online even post-COVID-19 2. Flight to digital and omnichannel Up to 40% of consumers (net) say they will decrease spend on discretionary categories 1. Shift to value and essentials 76% of consumers have changed stores, brands or the way they shop 3. Shock to loyalty 64% of US consumers are not yet resuming “normal” out-of-home activities 4. Homebody economy Source: McKinsey & Company COVID-19 US Consumer Pulse Survey 11/9–11/13/2020, n = 2,024, sampled and weighted to match the US general population 18+ years
  • 2. McKinsey & Company 2 Confidence in own country’s economic recovery after COVID-191 % of respondents 1 Q: How is your overall confidence level in economic conditions after the COVID-19 situation? Rated from 1 “very optimistic” to 6 “very pessimistic.” Bars may not sum to 100% due to rounding. Source: McKinsey & Company COVID-19 Consumer Pulse Survey Spain 11/9–16 UK 11/9–16 Italy 11/9–16 China 11/9–22 Brazil 11/9–16 France 11/9–16 7 12 15 18 31 40 33 37 33 31 40 51 53 59 52 47 54 52 60 62 58 38 33 23 17 14 13 11 7 2 US 11/9–13 Mexico 11/9–17 Japan 11/9–15 India 11/9–20 13 46 41 Unsure: The economy will be impacted for 6–12 months or longer and will stagnate or show slow growth thereafter Pessimistic: COVID-19 will have lasting impact on the economy and show regression/ fall into lengthy recession Optimistic: The economy will rebound within 2–3 months and grow just as strong as or stronger than before COVID-19 Germany 11/9–13 Shift to value and essentials The US is more optimistic than European countries but less so than India or China
  • 3. McKinsey & Company 3 Confidence in own country’s economic recovery after COVID-191 % of respondents 1 Q: How is your overall confidence level in economic conditions after the COVID-19 situation? Rated from 1 “very optimistic” to 6 “very pessimistic”; figures may not sum to 100% because of rounding. Source: McKinsey & Company COVID-19 US Consumer Pulse Survey 11/9–11/13/2020, n = 2,024; 10/23–10/27/2020, n = 2,021; 9/18–9/24/2020, n = 1,026 8/19–8/23/2020, n = 2,026; 7/30–8/2/2020, n = 2,024; 7/7–7/12/2020, n = 1,923; 6/15–6/21/2020, n = 2,006; 6/1–6/7/2020, n = 1,966; 5/18–5/24/2020, n = 1,975; 5/11–5/17/2020, n = 2,002; 5/4–5/10/2020, n = 1,993; 4/27–5/3/2020, n = 2,105; 4/20–4/26/2020, n = 1,052; 4/13–4/19/2020, n = 1,052; 4/6–4/12/2020, n = 1,063; 3/30–4/5/2020, n = 1,484; 3/23–3/29/2020, n = 1,119; 3/20–3/22/2020, n = 1,073; 3/16–3/17/2020, n = 1,042; sampled and weighted to match the US general population 18+ years 13% 16% 14% 15% 16% 16% 16% 15% 15% 20% 18% 17% 18% 19% 21% 17% 17% 14% 13% 43% 45% 45% 47% 46% 48% 48% 52% 52% 49% 49% 49% 47% 46% 46% 46% 45% 44% 46% 44% 39% 41% 37% 39% 35% 36% 33% 34% 32% 33% 34% 36% 35% 32% 36% 39% 42% 41% Mar 16–17 Mar 20–22 Mar 23–29 Apr 13–19 April 6–12 Apr 27– May 3 Apr 20–26 May 4–10 May 11–17 May 18–24 Jun 1–7 Jun 15–21 Jul 7–12 Jul 30– Aug 2 Aug 19–23 Sep 18–24 Oct 23–27 Nov 9–13 Mar 30– Apr 5 US Unsure: The economy will be impacted for 6–12 months or longer and will stagnate or show slow growth thereafter Pessimistic: COVID-19 will have lasting impact on the economy and show regression / fall into lengthy recession Optimistic: The economy will rebound within 2–3 months and grow just as strong as or stronger than before COVID-19 Shift to value and essentials Optimism regarding US economic recovery has improved steadily since summer
  • 4. McKinsey & Company 4 1 Q: When do you expect your routines will return to normal? Figures may not sum to 100% because of rounding. 2 Q: When do you expect your personal/household finances will return to normal? Figures may not sum to 100% because of rounding. 38% 11% Jul–Dec 2021 Jan–Jun 2021 36% 15% Already returned to normal 2022 or beyond 22% 10% 30% 24% 15% No impact Already returned to normal Jan–Jun 2021 Jul–Dec 2021 2022 or beyond Expectations on routines returning to normal1 % of respondents Expectations on finances returning to normal2 % of respondents ~53% believe their routines will not return to normal until the second half of 2021 or beyond ~39% believe their finances will not return to normal until the second half of 2021 or beyond Shift to value and essentials Americans believe that their routines will take longer to return to normal than their finances Source: McKinsey & Company COVID-19 US Consumer Pulse Survey 11/9–11/13/2020, n = 2,024, sampled and weighted to match the US general population 18+ years
  • 5. McKinsey & Company 5 Household income1,2 % of respondents 1 Q: How has the COVID-19 situation affected your (family’s) overall available income, spending, and savings in the past two weeks? Figures may not sum to 100% because of rounding. 2 Q: How do you think your overall available income, spending, and savings may change in the next two weeks? Figures may not sum to 100% because of rounding. Household spending1,2 % of respondents October 23–27 November 9–13 October 23–27 November 9–13 Household savings1,2 % of respondents October 23–27 November 9–13 Shift to value and essentials Increase slightly / increase a lotReduce slightly / reduce a lot About the same 34% 9% 35% 56% Past 2 weeks 9% 57% Past 2 weeks 11% 71% 18% Next 2 weeks 16% 41% 42% 14% 42% Past 2 weeks 45% Past 2 weeks 14% 58% 27% Next 2 weeks Household income, spending, and savings have held steady in the past two weeks 24% 40% 36% 21% Past 2 weeks 42% 37% Past 2 weeks 15% 61% 23% Next 2 weeks Source: McKinsey & Company COVID-19 US Consumer Pulse Survey 11/9–11/13/2020, n = 2,024; 10/23–10/27/2020, n = 2,021, sampled and weighted to match the US general population 18+ years
  • 6. McKinsey & Company 6 Change in shopping mindset since COVID-191 % of respondents 1 Q: Which best describes how often you are doing each of the following items? Possible answers: “doing less since coronavirus started”; “doing about the same since coronavirus started”; “doing more since coronavirus started”; figures may not sum to 100% because of rounding. Shift to value and essentials 6% 7% 9% 10% 11% 54% 55% 61% 62% 69% 40% 39% 30% 28% 20% Becoming more mindful of where I spend my money Looking for ways to save money when shopping Changing to less expensive products to save money 100% Researching brand and product choices before buying Spending time planning / making lists for shopping trips Doing less Doing about the same Doing more Americans are becoming more mindful of how they spend their money, and adopting new saving habits Source: McKinsey & Company COVID-19 US Consumer Pulse Survey 11/9–11/13/2020, n = 2,024, sampled and weighted to match the US general population 18+ years
  • 7. McKinsey & Company 7 Expected spending per category over the next two weeks compared to usual1 % of respondents 1 Q: Over the next two weeks, do you expect that you will spend more, about the same, or less money on these categories than usual? Figures may not sum to 100% because of rounding. 2 Net intent is calculated by subtracting the % of respondents stating they expect to decrease spending from the % of respondents stating they expect to increase spending. 3 Data not available or insufficient sample (n = < 75) in first survey. 4 Based on small subset (n < 100) of sample population. 9 19 25 29 28 34 46 46 45 58 55 27 13 15 34 51 21 27 16 13 17 14 11 9 7 8 8 13 16 12 11 Alcohol Footwear Groceries Snacks Quick-service restaurant Tobacco products Food takeout & delivery Restaurant Apparel Jewelry Accessories Non-food child products Household supplies Personal-care products 10Skin care & makeup Furnishing & appliances OTC medicines 10 10 Decrease Stay the same Increase 17 19 36 48 58 32 35 39 25 50 34 56 60 66 64 65 15 18 11 11 15 12 9 12 15 13 12 7 8 Fitness & wellness Vitamins/supplements Pet-care services Entertainment at home 10 Books/magazines/newspapers Consumer electronics Out-of-home entertainment Personal-care services Gasoline Vehicle purchases Short-term home rentals International flights Travel by car Hotel/resort stays Cruises4 Adventures & tours Domestic flights 10 10 Net intent2Net intent2 +18 -14 +3 -39 -3 -12 -17 -14 -23 -37 -39 -35 -50 -47 -5 -24 -11 -1 -26 -37 -47 -22 -20 -29 -13 N/A3 -41 -22 -41 -47 -54 -57 -57 -2 Net intent: Above +1 Net intent: -15 to 0 Net intent: Below -15 Change since first survey Change since first survey Shift to value and essentials Consumers report negative spending net intent across all categories except household essentials Source: McKinsey & Company COVID-19 US Consumer Pulse Survey 11/9–11/13/2020, n = 2,024; 3/16–3/172020, n = 1,042, sampled and weighted to match the US general population 18+ years +4 +4 +2 +5 +9 +26 +27 +8 +16 +3 +7 -17 +2 +7 +13 +15 N/A3 N/A3 -4 -15 -1 +15 +13 +20 +21 +24 N/A3 -11 +27 +10 +5 -1 +5 +7
  • 8. McKinsey & Company 8 Shift to value and essentials Spending net intent in discretionary categories is trending down as COVID-19 cases rise -70 20 -60 -30 -20 -40 10 -50 -10 0 Household supplies May3 Jun7 Mar17 Nov9 Mar22 May10 Mar29 Apr5 Apr12 Apr19 Apr26 May24 May17 Jun21 Jul12 Aug2 Aug23 Sep24 Personal care products Groceries Skin care & makeup Consumer electronics Fitness & wellness Apparel Oct23 Expected spending per category over the next two weeks compared to usual1 Net intent2 1 Q: Over the next two weeks, do you expect that you will spend more, about the same, or less money on these categories than usual? Figures may not sum to 100% because of rounding. 2 Net intent is calculated by subtracting the % of respondents stating they expect to decrease spending from the % of respondents stating they expect to increase spending. Source: McKinsey & Company COVID-19 US Consumer Pulse Survey 11/9–11/13/2020, n = 2,024; 10/23–10/27/2020, n = 2,021; 9/18–9/24/2020, n = 1,026 8/19–8/23/2020, n = 2,026; 7/30–8/2/2020, n = 2,024; 7/7–7/12/2020, n = 1,923; 6/15–6/21/2020, n = 2,006; 6/1–6/7/2020, n = 1,966; 5/18–5/24/2020, n = 1,975; 5/11–5/17/2020, n = 2,002; 5/4–5/10/2020, n = 1,993; 4/27–5/3/2020, n = 2,105; 4/20–4/26/2020, n = 1,052; 4/13–4/19/2020, n = 1,052; 4/6–4/12/2020, n = 1,063; 3/30–4/5/2020, n = 1,484; 3/23–3/29/2020, n = 1,119; 3/20–3/22/2020, n = 1,073; 3/16–3/17/2020, n = 1,042; sampled and weighted to match the US general population 18+ years
  • 9. McKinsey & Company 9 More people expect to make a portion of their purchases online post-COVID-19 than before… Consumers’ use of online channel before and expected use after COVID-191,2 % of respondents purchasing online3 1 Q: Before the coronavirus (COVID-19) situation started, what proportion of your purchases in this category were online vs from a physical store/in person? 2 Q: Once the coronavirus (COVID-19) situation has subsided, tell us what proportion of your purchases in this category you think will be online vs from a physical store/in person? 3 Includes respondents who chose “some online,” “most online,” and “all online.” Respondents who indicated that they have not bought the category online and do not intend to do so in the next two weeks are classified as not purchasing online. 4 Expected growth after COVID-19 compared to pre-COVID-19 slightly lower than previous waves due to respondents reporting higher online activity in pre-COVID-19 situation. 27 22 28 27 40 44 33 40 43 29 29 45 50 54 45 48 57 52 59 73 11 +9 Groceries +7 +9 Accessories Alcohol +10 +6 Over-the-counter medicine Non-food child products Snacks +13Fitness & wellness +13 Food takeout & delivery +10Personal-care products Jewelry +11 +12 Books, magazines, newspapers Footwear Vitamins/supplements +8 +7Household supplies Tobacco +9 +10Furnishings & appliances +11 +11Apparel +8Skin care & makeup +9 +8 Consumer electronics Entertainment at home Before Expected growth after COVID-19 % growth in customers purchasing category online 42% 41% 36% 34% 32% 30% 30% 27% 27% 24% 23% 22% 22% 20% 19% 17% 16% 15% 15% 9% Flight to digital and omnichannel ~20–40% growth in consumers who purchase online for most categories4 Source: McKinsey & Company COVID-19 US Consumer Pulse Survey 11/9–11/13/2020, n = 2,024; sampled and weighted to match the US general population 18+ years
  • 10. McKinsey & Company 10 Consumers’ use of online channel before and expected use after COVID-191,2 % of respondents purchasing most or all online3 1 Q: Before the coronavirus (COVID-19) situation started, what proportion of your purchases in this category were online vs from a physical store/in person? 2 Q: Once the coronavirus (COVID-19) situation has subsided, tell us what proportion of your purchases in this category you think will be online vs from a physical store/in person? 3 Respondents who indicated that they have not bought the category online and do not intend to do so in the next two weeks are classified as not purchasing online. 4 Expected growth after COVID-19 compared to pre-COVID-19 slightly lower than previous waves due to respondents reporting higher online activity in pre-COVID-19 situation. 9 8 9 9 18 15 11 17 21 10 14 17 23 24 17 24 33 26 34 54 Groceries +6 +9 +7Alcohol +7 Jewelry Over-the-counter medicine Snacks +14 +9 Fitness & wellness +12 +12 Non-food child products +8Personal-care products Books, magazines, newspapers +12 +5 Food takeout & delivery +9Vitamins/supplements +10 +7Household supplies +10 +7Tobacco Furnishings & appliances +9Accessories Apparel Skin care & makeup +11 Entertainment at home Footwear Consumer electronics +9 +10 Pre-COVID-19 Expected growth after COVID-19 % growth in customers purchasing category most or all online 51% 83% 91% 81% 76% 75% 77% 70% 43% 71% 48% 56% 39% 41% 68% 40% 31% 45% 18% 17% ~30–80% growth in consumers who purchase most or all online for most categories4 …with many consumers planning to shift almost completely online Flight to digital and omnichannel Source: McKinsey & Company COVID-19 US Consumer Pulse Survey 11/9–11/13/2020, n = 2,024; sampled and weighted to match the US general population 18+ years
  • 11. McKinsey & Company 11 Have you used or done any of the following since COVID-19 started1 % of respondents 1 Q: Have you used or done any of the following since the COVID-19 situation started? If yes, Q: Which best describes when you have done or used each of these items? Possible answers: “just started using since COVID-19 started”; “using more since COVID-19 started”; “using about the same since COVID-19 started”; “using less since COVID-19 started.” 2 Q: Compared to now, will you do or use the following more, less, or not at all, once the coronavirus (COVID-19) situation has subsided? Possible answers: “will stop this”; ”will reduce this”; “will keep doing what I am doing now”; “will increase this.” Number indicates respondents who chose “will keep doing what I am doing now” and “will increase this” among new or increased users. 7% 6% 3% 24% 17% 4% 8% 4% 5% 7% 5% 3% 19% 16% 5% 25% 19% 16% 19% 11% 15% 7% 8% 5% 8% 10% 4% 3% 4% 13% 9% 12% 8% 2% 4% 3% Store curbside pickup Purchased directly from social media Purchased pre-owned products Used deal-finding plug-ins In-store self-checkout Quick-serve restaurant drive-thru Meal-kit delivery Restaurant delivery Used a new store/restaurant app Restaurant curbside pickup Buy online for in-store pickup Grocery delivery Just started using Using more Using same/less Not using Intent to continue,2 % 46% 55% 58% 62% 79% 51% 65% 57% 62% 71% 57% 83% Flight to digital and omnichannel Americans continue to try pickup and delivery services for the first time, and to intensify their usage of them Source: McKinsey & Company COVID-19 US Consumer Pulse Survey 11/9–11/13/2020, n = 2,024, sampled and weighted to match the US general population 18+ years
  • 12. McKinsey & Company 12 0 59 63 775150 706143 50 53 60 80 0 100 45 67 69 73 853 81 8765 79751 47 7149 55 57 83 Purchased from social media Restaurant delivery In-store self-checkout Grocery delivery Meal-kit delivery Quick-serve restaurant drive-thru Deal-finding plug-ins Restaurant curbside pickup Buy online for in-store pickup Store curbside pickup New store/restaurant app Purchased pre-owned products online Intent to use after COVID-191 Percent of new or increased users who intend to keep doing activity after COVID-19 1 Q: Compared to now, will you do or use the following more, less, or not at all, once the coronavirus (COVID-19) situation has subsided? Possible answers: “will stop this”; ”will reduce this”; “will keep doing what I am doing now”; “will increase this.” Number indicates respondents who chose “will keep doing what I am doing now” and “will increase this” among new or increased users. 2 User growth is calculated as % of respondents who replied that they are new users over % of respondents who replied that they were using the product/service pre-COVID-19 (using more, using the same, or using less). Flight to digital and omnichannel Consumers say most food-related pickup and delivery habits work for now; just over half report intending to continue after COVID-19 Accelerated shifts Potentially here to stay Works for now Source: McKinsey & Company COVID-19 US Consumer Pulse Survey 11/9–11/13/2020, n = 2,024, sampled and weighted to match the US general population 18+ years UsegrowthsinceCOVID-192
  • 13. McKinsey & Company 13 Trends during COVID-19 suggest that digital delivery for food seems to work for now, while digital retail has more staying power Flight to digital and omnichannel Intent to use after COVID-191 % of new or increased users who intend to keep doing activity after COVID-19 Low Medium-high UsergrowthsinceCOVID-192 Medium-highLow Works for now Accelerated shifts Potentially here to stay Status quo/ plateauing 1 Q: Compared to now, will you do or use the following more, less, or not at all, once the coronavirus (COVID-19) situation has subsided? Possible answers: “will stop this”; “will reduce this”; “will keep doing what I am doing now”; “will increase this.” 2 User growth is calculated as % of respondents who replied that they are new users over % of respondents who replied that they were using the product/service pre-COVID-19 (using more, using the same or using less). Accelerated shifts Potentially here to stay Works for now Status quo/plateauingData not available Jun Jul Aug Sep Oct Nov Meal-kit delivery Restaurant delivery Grocery delivery Quick-serve restaurant drive-thru Restaurant curbside pickup Store curbside pickup (mostly grocery) Used a new store/restaurant app N/A Buy online for in-store pickup In-store self-checkout Used deal-finding plug-ins N/APurchased directly from social media Purchased pre-owned products online Source: McKinsey & Company COVID-19 US Consumer Pulse Survey 11/9–11/13/2020, n = 2,024; 10/23–10/272020, n = 2,021; 9/18–9/24/2020, n = 1,026; 8/19–8/23/2020, n = 2,026; 7/7–7/12/2020, n = 1,923; 6/15–6/21/2020, n = 2,006, sampled and weighted to match the US general population 18+ years
  • 14. McKinsey & Company 14 Have you used any of the following since COVID-19 started1 % of respondents Three out of four Americans have tried a new shopping behavior and most intend to continue beyond the crisis 1 Q: Since the coronavirus (COVID-19) situation started (i.e., within the past ~3 months), which of the following have you done? 23% consumers selected “none of these.” 2 Q: Which best describes whether or not you plan to continue with these shopping changes once the coronavirus (COVID-19) situation has subsided? Possible answers: “will go back to what I did before coronavirus”; ”will keep doing both this and what I did before coronavirus”; ”will keep doing this and NOT go back to what I did before coronavirus.” Intent to continue includes respondents who selected “will keep doing both this and what I did before coronavirus” and “will keep doing this and NOT go back to what I did before coronavirus.” 3 “New shopping method” includes curbside pickup and delivery apps. 41% 37% 34% 29% 26% Different brand New shopping method3 New digital shopping method Different retailer/store/website Private label/store brand Intent to continue2 82% 80% 84% 75% 82% 76% Consumers have tried a new shopping behavior Shock to loyalty Source: McKinsey & Company COVID-19 US Consumer Pulse Survey 11/9–11/13/2020, n = 2,024, sampled and weighted to match the US general population 18+ years
  • 15. McKinsey & Company 15 More than 50 percent of consumers cite convenience and value as top drivers for trying new places to shop Reason for shopping at a new retailer/store/website since COVID-19 started1 % of respondents selecting reason in top three 1 Q: You mentioned you shopped from a new retailer/store/website since the coronavirus (COVID-19) situation started. What was the main reason you decided to try this new retailer/store/website? Select up to 3. 24% 22% 21% 19% 28% 22% 22% 29% 18% 6% 18% 6% 12% Better prices/promotions Offers good delivery/pickup options More easily accessible from my home Less crowded / has shorter lines Can get all the items I need from one place Better value Better shipping/delivery costs Products are in stock Better quality Offers natural/organic options Supporting local businesses The company treats its employees well Cleaner/ has better hygiene measures Convenience Purpose-driven Quality/organic Health/hygiene Availability Value x% Net % of respondents per category 57% 64% 29% 23% 22% 12% Shock to loyalty Source: McKinsey & Company COVID-19 US Consumer Pulse Survey 11/9–11/13/2020, n = 2,024, sampled and weighted to match the US general population 18+ years
  • 16. McKinsey & Company 16 More than two-thirds of consumers who tried a new brand cite value as a driver Reason for trying a new brand since COVID-19 started1 % of respondents selecting reason in top three 1 Q: You mentioned you tried a new/different brand than what you normally buy. What was the main reason that drove this decision? Select up to 3. “Brand” includes different brand, new private label/store brand. Availability Value Health/hygiene Quality/organic Purpose-driven Convenience x% Net % of respondents per category 39% 67% 30% 30% 20% 14% Shock to loyalty 36% 33% 14% 12% 39% 30% 19% 16% 16% 5% 14% Is available where I’m shopping Larger package sizes Better shipping/delivery costs Better value Better prices/promotions Products are in stock Better quality Is natural/organic Supporting local businesses The company treats its employees well Cleaner/ has better hygiene measures Source: McKinsey & Company COVID-19 US Consumer Pulse Survey 11/9–11/13/2020, n = 2,024, sampled and weighted to match the US general population 18+ years
  • 17. McKinsey & Company 17 Consumer buying based on company behavior1 % of respondents 1 Q: Which best describes how often you are doing each of the following items? Possible answers: “doing less since coronavirus started”; “doing about the same since coronavirus started”; “doing more since coronavirus started.” Figures may not sum to 100% because of rounding. Consumers are paying increased attention to how companies treat their employees 8% 9% 11% 11% 11% 69% 69% 72% 74% 73% 23% 22% 17% 15% 16% Sustainable/eco-friendly products How companies take care of the safety of their employees Healthy and hygienic packaging Company’s purpose/values Retailers promotion of sustainable solutions Doing less Doing moreDoing about the same Shock to loyalty Source: McKinsey & Company COVID-19 US Consumer Pulse Survey 11/9–11/13/2020, n = 2,024; 10/23–10/27/2020, n = 2,021, sampled and weighted to match the US general population 18+ years
  • 18. McKinsey & Company 18 Milestones for the US population not yet engaging with out-of-home activities1 % of respondents awaiting each milestone before engaging Most Americans are still waiting to see indicators beyond lifting of restrictions before fully reengaging with out-of-home activities 1 Q: Which best describes when you will regularly return to stores, restaurants, and other out-of-home activities? Chart rebased to exclude those already participating in these activities and those who do not deem any of these items important. Figures may not sum to 100% because of rounding. 50 31 19 Government lifts restrictions + other requirement Only once there’s a vaccine or treatment Government lifts restrictions Medical authorities deem safe 24% Stores, restaurants, and other indoor places start taking safety measures 18% I see other people returning 9% Government lifts restrictions and… 64% of people are not currently engaging in “normal” out-of- home activities, same as the last survey Homebody economy Source: McKinsey & Company COVID-19 US Consumer Pulse Survey 11/9–11/13/2020, n = 2,024, sampled and weighted to match the US general population 18+ years
  • 19. McKinsey & Company 19 Consumers engaging in “normal” out-of-home activities1 % of respondents While more consumers have been engaging in ‘normal’ out-of-home activities since May, the proportion has leveled off in recent months 1 Q: Which best describes when you will regularly return to stores, restaurants, and other out-of-home activities? Chart shows those already participating in these activities. Homebody economy 20 27 30 32 36 36 36 12 18 24 30 36 Nov 13May 24 Jul 12Jun 21 Aug 23 Sep 24 Oct 27 Source: McKinsey & Company COVID-19 US Consumer Pulse Survey 11/9–11/13/2020, n = 2,024; 10/23–10/27/2020, n = 2,021; 9/18–9/24/2020, n = 1,026; 8/19–8/23/2020, n = 2,026; 7/30–8/2/2020, n = 2,024; 7/7–7/12/2020, n = 1,923; 6/15–6/21/2020, n = 2,006; 6/1–6/7/2020, n = 1,966; 5/18–5/24/2020, n = 1,975; sampled and weighted to match the US general population 18+ years
  • 20. McKinsey & Company 20 Most Americans are concerned about traveling by airplane or public transit, and about attending large events Consumers’ level of concern undertaking various activities1 % of respondents 1 Q: How worried would you be if you were to do the following activities in the next two weeks? Possible answers: “not worried at all”; “not very worried”; “somewhat worried”; “very worried”; “extremely worried.”; figures may not sum to 100% because of rounding. 2 Level of concern is calculated by subtracting the % of respondents stating they “not worried at all” and “not very worried” from “very worried” and “extremely worried.” Level of concern2 38 36 35 27 30 22 25 21 12 5 13 12 7 -3 -16 -23 -15 -2947% 44% 46% 42% 37% 34% 33% 32% 30% 31% 29% 26% 26% 25% 24% 24% 22% 21% 21% 35% 34% 24% 31% 29% 29% 30% 29% 28% 26% 29% 27% 25% 25% 25% 22% 21% 22% 20% 18% 21% 30% 27% 34% 37% 38% 39% 42% 43% 42% 47% 48% 50% 51% 54% 57% 57% 59% Worried Go to a hair or nail salon Shop for non-necessities Work outside my home Shop for groceries/necessities Drive more than 2 hours from home Get together with family Get together with friends Dine at a restaurant or bar Stay in a hotel Rent a short-term home Go to a shopping mall Go out for family entertainment Use a clothing rental service Use a ride-sharing service Go to the gym or fitness studio Visit a crowded outdoor public place Travel by airplane Use public transportation Attend a large event Somewhat worriedNot worried Homebody economy 3 Source: McKinsey & Company COVID-19 US Consumer Pulse Survey 11/9–11/13/2020, n = 2,024, sampled and weighted to match the US general population 18+ years
  • 21. McKinsey & Company 21 Masks and barriers continue to be a priority for consumers deciding where to shop in-store, up eight percentage points since May Top priorities when deciding where to shop in-store1 % of respondents for whom this criterion is the most important2 1 Q: Once restrictions lift, which of the following factors will be most important to you as you decide which of these places to visit in person? Respondents were asked to select the most important. 2 The following categories are included in each bucket: Cleaning and sanitization—increased cleaning, improved air filtration, availability of sanitizing supplies throughout the store; Health checks—customer wellness check (e.g., temperature) on entry, employees' wellness check (e.g., temperature) on entry; Masks and barriers—customers and employees wear masks, customers and employees provided masks and gloves, plastic barrier with cashier; No-contact purchasing—curbside pick-up, cashier-less checkout, no-contact delivery, buy online for pickup in store; Physical distancing—customer number limit, distancing in customer line, reduced employee activity during shopping hours; Store regulations—no customer product testing, one-way store aisles, special hours for high-risk shoppers. Homebody economy Change since the first measure, pp +8 -5 +2 -1 -1 -1 33% 25% 13% 12% 9% 8% Cleaning and sanitization Physical distancing Masks and barriers Store regulations No-contact purchasing Health checks Source: McKinsey & Company COVID-19 US Consumer Pulse Survey 11/9–11/13/2020, n = 2,024; 5/11–5/17/2020, n = 2,002, sampled and weighted to match the US general population 18+ years
  • 22. McKinsey & Company 22 Americans intend to maintain their current level of engagement with out-of-home activities for the next two weeks Consumers’ engagement with activities outside home1,2 % of respondents 1 Q: Did you leave your house for the following activities over the past two weeks? Chart represents the percentage of respondents who indicated that they left home at least once during the past week to do this activity. 2 Q: For which of the following activities do you intend to leave your home to do in the next two weeks? Chart represents % of respondents who intend to leave their home to do this activity during the next two weeks. 78% 54% 43% 40% 36% 31% 23% 24% 16% 17% 15% 15% 15% 11% 10% Past 2 weeks Next 2 weeks Homebody economy 83% 54% 42% 42% 38% 32% 24% 23% 17% 16% 15% 15% 14% 10% 9% Get together with family Shop for groceries/necessities Shop for non-necessities Work outside my home Go to a hair or nail salon Drive more than 2 hours away from home Dine at a restaurant or bar Travel by airplane Get together with friends Visit a crowded outdoor public place Go to the gym or fitness studio Go out for family entertainment Use ride-sharing service Travel on public transportation Attend a large event Source: McKinsey & Company COVID-19 US Consumer Pulse Survey 11/9–11/13/2020, n = 2,024, sampled and weighted to match the US general population 18+ years
  • 23. McKinsey & Company 23 44% Somewhat unsafe 24% 32%Feel unsafe Feel safe Top activities eager to get back to2 % of respondents for whom the activity is in their top 3 choices Get together with family 42% 39%Get together with friends Attend a concert, sporting event, movie, etc. 36%Dine indoors at a restaurant or bar 15% 26% Go out for family entertainment 22%Travel by airplane 22% 17%Visit a crowded outdoor public place 16% Shop for non-necessities at shopping mall/department store 12% Go to gym or fitness studio 16%Go to a hair or nail salon Interact with coworkers in person Americans are most eager to return to indoor dining and getting together with friends and family Level of comfort with out-of-home activities,1 % of respondents 1 Q: What best describes your comfort participating in activities you did prior to COVID-19? Figures may not sum to 100% because of rounding. 2 Q: What best describes your comfort participating in activities you did prior to COVID-19? If answered “somewhat unsafe” or “unsafe,” Q: Which of the following activities are you most eager to get back to on a regular basis? Select up to 3. Homebody economy Source: McKinsey & Company COVID-19 US Consumer Pulse Survey 11/9–11/13/2020, n = 2,024, sampled and weighted to match the US general population 18+ years
  • 24. McKinsey & Company 24 Compared to lower-income groups, higher-income consumers are more eager to return to traveling and going to the gym or fitness studio 1 Q: Which of the following activities are you most eager to get back to on a regular basis when it feels totally safe? 2 Q: Difference between income group and overall % of respondents. Homebody economy Top activities consumers are eager to get back to1 % of respondents for whom the activity is in their top 3 choices Income over/under index2 Low Medium High +2% 0% -3% 2% -1% -1% +4% -2% -9% -3% +3% +2% -9% 0% 12% 1% 0% -1% -1% -2% 3% +6% -5% +3% +1% 0% -2% -4% +0% +6% -2% -1% 4% Source: McKinsey & Company COVID-19 US Consumer Pulse Survey 11/9–11/13/2020, n = 2,024, sampled and weighted to match the US general population 18+ years Go out for family entertainment 42% Dine indoors at a restaurant/bar Get together with family Attend a concert, sporting event, movie, etc. Get together with friends 39% 36% 26% 22%Travel by airplane 22% 17%Visit a crowded outdoor public place 16%Shop for non-necessities at shopping mall/department store 16%Go to a hair or nail salon 15%Go to gym or fitness studio 12%Interact with coworkers in person
  • 25. McKinsey & Company 25 Americans have acquired at-home alternatives to out-of-home activities, such as telemedicine and video chat 18% 3% 4% 3% 2% 2% 3% 4% 2% 25% 7% 5% 4% 21% 12% 37% 16% 12% 8% 8% 6% 7% 8% 5% 4% 34% 14% 7% 10% 35% 14% 5% 9% 7% 6% 8% 14% 4% 4% 8% 2% 2% 4% 6% 3% 3% 6% Watching e-sports Remote learning: my children Wellness app Cooked regularly for myself/my family Video chat: personal Social media Playing online games Videoconferencing: professional TikTok Online streaming Remote learning: myself Digital exercise machine Personal care/grooming at home Online fitness Telemedicine: physical 2% Telemedicine: mental Not using Using moreUsing less / the same Just started usingHave you used or done any of the following since COVID-19 started1 % of respondents Intent to continue,2 % 74% 57% 47% 60% 49% 50% 66% 79% 53% 65% 65% 82% 69% 59% 65% 59% 1 Q: Have you used or done any of the following since the COVID-19 situation started? If yes, Q: Which best describes when you have done or used each of these items? Possible answers: “just started using since COVID-19 started”; “using more since COVID-19 started”; “using about the same since COVID-19 started”; “using less since COVID-19 started.” 2 Q: Compared to now, will you do or use the following more, less, or not at all, once the coronavirus (COVID-19) situation has subsided? Possible answers: “will stop this”; ”will reduce this”; “will keep doing what I am doing now”; “will increase this.” Number indicates respondents who chose “will keep doing what I am doing now” and “will increase this” among new or increased users. Homebody economy Source: McKinsey & Company COVID-19 US Consumer Pulse Survey 11/9–11/13/2020, n = 2,024, sampled and weighted to match the US general population 18+ years
  • 26. McKinsey & Company 26 UsergrowthsinceCOVID-192 Intent to use after COVID-191 Percent of new or increased users who intend to keep doing activity after COVID-19 1 Q: Compared to now, will you do or use the following more, less, or not at all, once the coronavirus (COVID-19) situation has subsided? Possible answers: “will stop this”; ”will reduce this”; “will keep doing what I am doing now”; “will increase this.” Number indicates respondents who chose “will keep doing what I am doing now” and “will increase this” among new or increased users. 2 User growth is calculated as % of respondents who replied that they are new users over % of respondents who replied that they were using the product/service pre-COVID-19 (using more, using the same, or using less). Online entertainment and wellness habits adopted during the crisis are likely to remain for the medium to long term Homebody economy 55 200 150 0 48 100 50 8260 8165 70 75 80 0 50 Video chat: personal Digital exercise machine Remote learning: my children Used social media Playing online games Remote learning: myself Online fitness Telemedicine: mental Cooked regularlyPersonal care/grooming at home Videoconferencing: professional Wellness appWatching e-sports Online streaming Telemedicine: physical TikTok Works for now Accelerated shifts Potentially here to stay Source: McKinsey & Company COVID-19 US Consumer Pulse Survey 11/9–11/13/2020, n = 2,024, sampled and weighted to match the US general population 18+ years
  • 27. McKinsey & Company 27 Video alternatives to communication seem to work for now, while other at-home alternatives seem stickier Homebody economy 1 Q: Compared to now, will you do or use the following more, less, or not at all, once the coronavirus (COVID-19) situation has subsided? Possible answers: “will stop this”; ”will reduce this”; “will keep doing what I am doing now”; “will increase this.” Number indicates respondents who chose “will keep doing what I am doing now” and “will increase this” among new or increased users. 2 User growth is calculated as % of respondents who replied that they are new users over % of respondents who replied that they were using the product/service pre-COVID-19 (using more, using the same, or using less). Intent to use after COVID-191 % of new or increased users who intend to keep doing activity once pandemic subsides Low Medium-high UsergrowthsinceCOVID-192 Medium-highLow Works for now Accelerated shifts Potentially here to stay Status quo / plateauing Accelerated shifts Potentially here to stay Works for now Status quo / plateauingData not available4 Jun Jul Aug Sep Oct Nov Online fitness Digital exercise machine Wellness app Online streaming TikTok Used social media N/A Cooked regularly Videoconferencing: professional Video chat: personal Telemedicine: physical Telemedicine: mental Remote learning: myself Remote learning: my children Source: McKinsey & Company COVID-19 US Consumer Pulse Survey 11/9–11/13/2020, n = 2,024; 10/23–10/272020, n = 2,021; 9/18–9/24/2020, n = 1,026; 8/19–8/23/2020, n = 2,026; 7/7–7/12/2020, n = 1,923; 6/15–6/21/2020, n = 2,006, sampled and weighted to match the US general population 18+ years
  • 28. McKinsey & Company 28 Omnichannel and telemedicine activity continue to grow, but at-home social interaction alternatives have declined since April 1 Q: Have you used or done any of the following since the COVID-19 situation started? If yes, Q: Which best describes when you have done or used each of these items? Possible answers: “just started using since COVID-19 started”; “using more since COVID-19 started”; “using about the same since COVID-19 started”; “using less since COVID-19 started.” 2 Q: Compared to now, will you do or use the following more, less, or not at all, once the coronavirus (COVID-19) situation has subsided? Possible answers: “will stop this”; ”will reduce this”; “will keep doing what I am doing now”; “will increase this.” Number indicates respondents who chose “will keep doing what I am doing now” and “will increase this” among new or increased users. 3 Change since first survey is calculated by subtracting % new/increased users in April from % new/increased users in November. Have you started/increased usage since COVID-19 started1,2 % of respondents 42 29 28 28 23 23 27 26 25 20 16 14 21 13 12 11 18 13 12 Online fitness Online streaming Wellness app Quick-serve restaurant drive-thru Restaurant curbside pickup Store curbside pickup Telemedicine: physical Buy online for in-store pickup In-store self-checkout Remote learning: my children Videoconferencing: professional Video chat: personal Remote learning: myself Telemedicine: mental Playing online games TikTok Watching e-sports Restaurant delivery Grocery delivery Change from April, (difference between November and April %)3New/increased users -4 -3 +4 +2 +2 +8 +9 +8 +8 +6 +8 +3 +7 +11 +0 +2 +2 +2 +4 Homebody economy Source: McKinsey & Company COVID-19 US Consumer Pulse Survey 11/9–11/13/2020, n = 2,024, sampled and weighted to match the US general population 18+ years
  • 29. McKinsey & Company 29 17% 33% 50% Hybrid Online only In-person only 1 Q: What education format is your child/children’s school primarily using today? Figures may not sum to 100% because of rounding. 2 Q: Please indicate how strongly you agree or disagree with each of the following statements. Statements include: “I expect remote learning to be a key education format for formal and/or informal education for the next 3 months”; “given the uncertainty of school openings, I am planning to spend more on at-home learning tools and equipment (e.g., tutoring services, desk equipment, electronics)”; “I have cut back my work hours given my child/children’s at-home learning needs.” Rated from 1 “strongly disagree” to 6 “strongly agree.” Figures may not sum to 100% because of rounding. Remote learning is widespread and families expect it to continue, therefore many are making changes to adapt Education format1 % of respondents Homebody economy 52 44 35 Expect online to continue for 3+ months Invest in at-home learning tools Reduce work hours Agree/Strongly agree Change in beliefs/behaviors for those with children in remote learning,2 % of respondents ~83% of children in some form of remote learning Source: McKinsey & Company COVID-19 US Consumer Pulse Survey 11/9–11/13/2020, n = 2,024, sampled and weighted to match the US general population 18+ years
  • 30. McKinsey & Company 30 1 Q: Please indicate how strongly you agree or disagree with each of the following statements: “I have cut back my work hours given my child/children’s at-home learning needs.” Rated from 1 “strongly disagree” to 6 “strongly agree.” Figures may not sum to 100% because of rounding. $50K–$100K Overall 35 30<$50K >$100K Agree/Strongly agree 27 43 Reduction in work hours for those with children in remote learning1 % of respondents One-third of families with children have reduced work hours to meet at-home learning needs Homebody economy 43% of high-income families have reduced work hours Source: McKinsey & Company COVID-19 US Consumer Pulse Survey 11/9–11/13/2020, n = 2,024, sampled and weighted to match the US general population 18+ years
  • 31. McKinsey & Company 31 Disclaimer McKinsey does not provide legal, medical, or other regulated advice or guarantee results. These materials reflect general insight and best practice based on information currently available and do not contain all of the information needed to determine a future course of action. Such information has not been generated or independently verified by McKinsey and is inherently uncertain and subject to change. McKinsey has no obligation to update these materials and makes no representation or warranty and expressly disclaims any liability with respect thereto.

Hinweis der Redaktion

  1. % who started using/increased usage that intend to continue