SlideShare ist ein Scribd-Unternehmen logo
1 von 31
McKinsey & Company 1
Five emerging consumer themes in March 2022
1 2
Source: McKinsey & Company COVID-19 India Consumer Pulse Survey, 3/11–3/24/2022, n = 1,009, sampled and weighted to match the India general population 18+ years
5
4
3
Optimism driving
higher spending
Optimism for an economic
rebound continues to
grow, and intent to splurge
has increased across
generations
Household finances have
improved; about 60% of
consumers say their
finances are back to
normal
Omnichannel is
ascendant
More than six in ten
consumers use
omnichannel for purchase
in most categories
Social media and OTT
use reached an all-time
high with increasing
influence on purchase
decisions.
Loyalty shakeup
continues
Most consumers,
especially those
younger or with higher
incomes, are trying new
shopping behaviors
A quarter or more
switch brands or
retailers if a product is
unavailable
Home economy is
pervasive
80–90% of consumers
continue to invest in
home improvement
In contrast, about 40%
of consumers report
engaging in “normal”
out-of-home activities
Positive spend
impact
Almost all categories
experienced continued
positive intent to spend
Premiumization and
inflation have
contributed to an
increase in spend in
certain categories
McKinsey & Company 2
Confidence in own country’s economic recovery after COVID-19,1 % of respondents
11 15 15
21
14
29 32 29
29
34
46
56
51 63
48 47
59
68
55
38
28 27
23 23 21
12
3
20
75
5
Mixed: The economy will be
impacted for 6–12 months or
longer and will stagnate or show
slow growth thereafter
Pessimistic: COVID-19 will
have lasting impact on the
economy and show regression
or fall into lengthy recession
Optimistic: The economy will
rebound within 2–3 months and
grow just as strong as or
stronger than before COVID-19
Indian consumers are more likely than other countries’ consumers
to be optimistic about their country’s economy
1. Q: What is your overall confidence level surrounding economic conditions after the coronavirus (COVID-19) crisis subsides (ie, once there is herd immunity)? Rated from 1 “very optimistic” to 6 “very pessimistic.” Bars may not sum to
100% due to rounding.
Japan
China
3/11–20 3/16–26
Australia
3/16–25
Korea
3/19–26
US
3/1–25
Change in optimistic vs
last wave survey, percentage points
−12 −6 −10 +15 −2
Source: McKinsey & Company COVID-19 Consumer Pulse Survey
India
3/11–24
+1
Oct 2021 Oct 2021 Oct 2021 Oct 2021
Indonesia
3/16–26
+15
Sept 2020 Nov 2020 June 2020
Germany
3/22–28
France
3/23–28
UK
3/22–29
−10 −9 −12
Oct 2021
Oct 2021
Oct 2021
Optimism driving higher spending | Current as of March 2022
McKinsey & Company 3
12 11 11 11 10 7 5 5
36
32
39 37
32
31
25 21 20
52 57
50 51 58 62
71 74 75
Mar 2022
June 2020 Nov 2020
Sept 2020
Mar 2020 Apr 20202 Feb 2021
May 20202
4
Oct 2021
Optimism driving higher spending | Current as of March 2022
1. Q: What is your overall confidence level surrounding economic conditions after the coronavirus (COVID-19) crisis subsides (ie, once there is herd immunity)? Rated from 1 “very optimistic” to 6 “very pessimistic.” Figures may not sum to
100% because of rounding.
2. Average of weekly pulse surveys shown for March and April 2020.
Optimistic: The
economy will rebound
within 2–3 months and
grow just as strong as or
stronger than before
COVID-19
Mixed: The economy will
be impacted for 6–12
months or longer and will
stagnate or show slow
growth thereafter
Pessimistic: COVID-19
will have lasting impact
on the economy and
show regression or fall
into lengthy recession
Source: McKinsey & Company COVID-19 India Consumer Pulse Survey, 3/11–3/24/2022, n = 1,009; 10/18–10/25/2021, n = 1,002; 2/18–2/28/2021, n = 1,019; 11/9–11/20/2020, n = 1,091; 9/18–9/27/2020, n =
1,051; 6/19–6/22/2020, n = 624; 5/22–5/25/2020, n = 614; 5/1–5/4/2020, n = 648; 4/10–4/13/2020, n = 631; 4/3–4/6/2020, n = 601; 3/27–3/30/2020, n = 582, sampled and weighted to match the India’s general
population 18+ years
Indian consumers’ overall optimism has steadily increased over the
past two years
Confidence in own country’s economic recovery after COVID-19,1 % of respondents
McKinsey & Company 4
Baby boomers, millennials, and vaccinated consumers are the most
optimistic segments
Confidence in own country’s economic recovery after COVID-191
% of respondents
21
20
21
76
59
4
Vaccinated Unvaccinated
1. Q: What is your overall confidence level surrounding economic conditions after the coronavirus (COVID-19) crisis subsides (ie, once there is herd immunity)? Rated from 1 “very optimistic” to 6 “very pessimistic.”
2. Baby boomers includes silent generation.
6 9
23
18
21
17
71
79
70
81
Baby boomers2
Gen Z
3 2
Millennials Gen X
Optimistic Mixed Pessimistic
Source: McKinsey & Company COVID-19 India Consumer Pulse Survey, 3/11–3/24/2022, n = 1,009, sampled and weighted to match the India general population 18+ years
By generation By vaccination status
Optimism driving higher spending | Current as of March 2022
McKinsey & Company 5
24
19 17
22
36
30 35
14
40
51 48
64
Gen Z Millennials Gen X Baby boomers3
20
28
33 14
48
59
Vaccinated Unvaccinated
20
31
48
Overall
1. Q: When do you expect your routines will return to normal? Figures may not sum to 100% because of rounding.
2. Q: Which best describes your vaccination status?
3. Baby boomers includes silent generation.
McKinsey & Company COVID-19 India Consumer Pulse Survey, 3/11–3/24/2022, n = 1,009, sampled and weighted to match the India general population 18+ years
After June 2022
By June 2022
Not affected/already returned
By generation By vaccination status2
Younger generations
are more optimistic
about the return, while
~60% of older
consumers expect a
longer lead time
Vaccinated consumers
expect to return to
normalcy sooner than
unvaccinated
consumers
Key findings
Overall, nearly half of consumers expect pre-COVID-19 routines
will return after June 2022
Expectations on routines returning to normal,1 % of respondents
Optimism driving higher spending | Current as of March 2022
McKinsey & Company 6
More consumers than last year report that their incomes, spending,
and savings have increased
About the same
Reduced slightly/a lot Increased slightly/a lot
47
33
20
Past 2 weeks
35
24
41
Past 2 weeks
31
30
39
Past month
28
48
25
27
Past 2 weeks
29
43
Past 2 weeks
34
26
40
Past month
Past 2 weeks
43
38
26
Past 2 weeks
36
31
26
53
20
27
Past month
Source: McKinsey & Company COVID-19 India Consumer Pulse Survey, 3/11–3/24/2022, n = 1,009; 10/18–10/25/2021, n=1,002; 2/18–2/28/2021, n = 1,019, sampled and weighted to match the
India general population 18+ years
1. Q: How has the coronavirus (COVID-19) crisis affected the following over the past 1 month/2 weeks? Figures may not sum to 100% because of rounding.
Household income1
% of respondents
Household spending1
% of respondents
Household savings1
% of respondents
Feb 2021 Oct 2021 Mar 2022
Optimism driving higher spending | Current as of March 2022
McKinsey & Company 7
Almost six in ten consumers say their personal finances have
returned to ‘normal’ or will have by Q2 2022
28 29 25
37
34 27
30
19
38
43 45 44
Gen Z Baby boomers3
Millennials Gen X
28
34
29
25
43 40
Vaccinated Unvaccinated
29
29
43
Overall
1. Q: When do you expect your personal/household finances will return to normal? Figures may not sum to 100% because of rounding.
2. Q: Which best describes your vaccination status?
3. Baby boomers includes silent generation.
​Source: McKinsey & Company COVID-19 India Consumer Pulse Survey, 3/11–3/24/2022, n = 1,009, sampled and weighted to match the India general population 18+ years
By generation By vaccination status2
~40% of baby
boomers say their
finances either
were not affected
or are back to
normal, vs ~30% of
Gen Z and
millennials
Expectations on personal/household finances
returning to ‘normal,’1 % of respondents
By June 2022
After June 2022
Not affected/already returned
Optimism driving higher spending | Current as of March 2022
McKinsey & Company 8
Consumers still want to ‘splurge,’ and the intent to spend is high
across incomes and generations
​Source: McKinsey & Company COVID-19 India Consumer Pulse Survey, 3/11–3/24/2022, n = 1,009; 10/18–10/25/2021, n = 1,002; 2/18–2/28/2021, n = 1,019 sampled and weighted to match the India
general population 18+ years
Feb 2021
83
17
17
74
26
Oct 2021
Plan on
splurging
83
Mar 2022
Do not plan
on splurging
Millennials
Gen X
Baby boomers2
81%
4
88%
13
Gen Z 46%
−26
75%
−6
87%
0
93%
10
93%
26
60%
13
95%
44
74%
7
81%
18
91%
22
Generation
2
Respondents who plan/do not plan to ‘splurge’
or ‘treat themselves’ in 20221
% of respondents
Low
(<500,000 rupees)
Middle
(500,000–2M
rupees)
High
(>2M rupees)
>70%
<30% 50–70%
30–50% p.p. change from Oct 21
XX
Respondents who plan to splurge, by household income, %
Optimism driving higher spending | Current as of March 2022
1. Q: With regard to products and services you will spend money on, do you plan to splurge/treat yourself in 2022? For example, are there categories of products or services you have spent less on over the last year and half which you feel you
will spend more on in next 3 months?
2. Baby Boomers includes silent generation.
McKinsey & Company 9
Splurging on household items and entertainment has seen a spike
since last year
Categories where consumers intend to treat themselves1
% of all respondents with intent to splurge
1. Q: You mentioned that you plan to splurge/treat yourself in next 6 months. Which categories do you intend to treat yourself to? Please select all that apply.
2. Baby boomers includes silent generation.
47
46
45
44
43
41
40
39
37
35
30
29
11
Personal services
Electronics
Restaurants, dining out, bars
Travel, lodging, vacation
Apparel, shoes, accessories
Items for your home
Makeup, skin care products
Out-of-home entertainment
Fitness, sports, outdoors
Household essentials
Sports apparel and equipment
Pets
Outdoor living
Millennials Gen X
Gen Z
Baby
boomers2
1 1 −5 7
−3 2 −2 6
4 2 −6 −5
3 0 −2 −4
−4 3 −4 12
3 4 −5 −11
0 −1 1 0
6 1 −6 −4
−5 2 −2 10
Generational cut
5 2 −4 −12
−4 6 −6 1
−2 3 0 −11
2 1 −1 −9
Change from
Oct 2021,
percentage points
​Source: McKinsey & Company COVID-19 India Consumer Pulse Survey, 3/11–3/24/2022, n = 1,009; 10/18–10/25/2021, n = 1,002; 2/18–2/28/2021, n = 1,019, sampled and weighted to match the India
general population 18+ years
Between −3 and +3
< −3 > +3
0
−2
0
1
−3
6
2
6
0
3
−1
−7
5
Categories
Difference from all respondents,
percentage points
Optimism driving higher spending | Current as of March 2022
McKinsey & Company 10
More than 60 percent of consumers use omnichannel for purchases
in most of the categories
1. Q: Which best describes how you have researched the following categories over the last 3 months?
2. Q: Which best describes how you have purchased the following categories over the last 3 months?
21
7
15
15
10
21
10
20
7
14
9
18
15
12
9
20
64
54
62
64
65
58
65
64
65
62
67
64
69
71
67
60
15
39
23
21
24
21
25
16
28
24
24
18
15
17
25
20
Food takeout/delivery
Toys and baby supplies
Groceries/food for home
Household supplies
Pet food and supplies
Fitness and wellness services
Personal-care products
Vitamins, supplements, and OTC medicine
Apparel
Footwear
Consumer electronics
Home decoration and furniture
Kitchen and dining
Home improvement and gardening supplies
Skin care and makeup
Books, magazines, newspapers
Research and purchase only in stores Research and purchase only online
Omnichannel
Product searches1 and purchases2 by channel
% of respondents who purchased and searched in these categories in the last 3 months
​Source: McKinsey & Company COVID-19 India Consumer Pulse Survey, 3/11–3/24/2022, n = 1,009, sampled and weighted to match the India general population 18+ years
​Omnichannel is ascendant | Current as of March 2022
McKinsey & Company 11
Social media influences purchase decisions across most categories
for Gen Z and millennials
1. Q: Think about the purchases you have made in the following categories over the past 3 months. Were you influenced toward a certain brand by a post on social media in the following categories?.
2. Baby boomers includes silent generation.
63
55
70
76
67
65
73
69
68
63
70
59
62
67
75
59
Groceries/food for home
Apparel
Jewelry
Skin care and makeup
Household supplies
Personal care products
Footwear
Accessories
Consumer electronics
Home improvement and garden supplies
Sports and outdoors equipment, supplies
Kitchen and dining
Pet food and supplies
Home decoration and furniture
Fitness and wellness services
Vitamins, supplements, and OTC medicine
Millennials Gen X
Gen Z
Baby
boomers2
10 −6 −23
−5 6 0 −16
2 3 −4 −12
4 1 −4 −10
9 5 −3 −27
6 1 −2 −15
7 3 −6 −26
−1 −4 10 −19
1 −2 0 5
Generational cut
0 4 −10 5
−11 7 −4 1
−4 8 −4 −24
−10 3 6 −19
​Source: McKinsey & Company COVID-19 India Consumer Pulse Survey, 3/11–3/24/2022, n = 1,009, sampled and weighted to match the India general population 18+ years
Between −3 and +3
< −3 > +3
Categories
Categories where respondents were influenced by social media1
% of all respondents
−5
−3
−3
0
4
3
5
−4
−3
−4
7
−2
−10
Difference from all respondents,
percentage points
​Omnichannel is ascendant | Current as of March 2022
McKinsey & Company 12
Almost all respondents engage on some social-media platforms at
least once a week
Frequency of engagement with social-media platforms1
% of all respondents
1. Q: What social-media platforms do you engage with, and if so, how frequently?
​Source: McKinsey & Company COVID-19 India Consumer Pulse Survey, 3/11–3/24/2022, n = 1,009, sampled and weighted to match the India general population 18+ years
99 97
91 87
75 71 66 64
52
3 9 13
25 29 34 36
48
LinkedIn
1
Instagram Pinterest
Overall YouTube Twitter
Facebook Snapchat Reddit
Never/less than weekly
Weekly or more
​Omnichannel is ascendant | Current as of March 2022
McKinsey & Company 13
More than 90 percent of consumers view content on OTT
platforms at least once a week
Frequency of engagement with entertainment platforms1
% of all respondents
1. Q: What entertainment platforms do you engage with, and if so, how frequently?
​Source: McKinsey & Company COVID-19 India Consumer Pulse Survey, 3/11–3/24/2022, n = 1,009, sampled and weighted to match the India general population 18+ years
93
80 78 75
64
47
7
20 22 25
36
53
Other OTT
platform (eg,
Zee5,
MxPlayer)
Overall Sony Liv
Amazon Prime Netflix Disney Hotstar
Never/less than weekly
Weekly or more
​Omnichannel is ascendant | Current as of March 2022
McKinsey & Company 14
70
35
54 76
65
30
70
40
64
45
56
60
25
58 66 68 82
72 74 78 80
0
50
5
55
10
15
20 Grocery delivery
Shopped at a new store
Purchased pre-owned
product
Used an app for
same-day delivery
Meal kit delivery
Restaurant food delivery
New store/restaurant app
Drive-thru lane
Changed my primary store
Purchased directly from social media
Personal care/grooming at home
Downloaded/used
deal-finding plug-ins
Used an app for 2-hour
or 1-hour delivery
Buy online, pick up in store
​Source: McKinsey & Company COVID-19 India Consumer Pulse Survey, 3/11–3/24/2022, n = 1,009, sampled and weighted to match the India general population 18+ years
Intent to use when COVID-19 crisis subsides2
% of new or increased users who intend to keep doing activity
User
growth
since
COVID-19
1
1. User growth is calculated as % of respondents who replied that they are new users over % of respondents who replied that they were using the product/service pre-COVID-19 (using more, using the same or using less) on Q: Which best
describes when you have done or used each of these items?
2. Q: Compared to now, will you do or use the following more, less, or not at all, once the coronavirus (COVID-19) crisis subsides (ie, once there is herd immunity)? Possible answers: “will stop this”; ”will reduce this”; “will keep doing what I am
doing now”; “will increase this.” Number indicates percent who chose “will keep doing what I am doing now” and “will increase this” among new or increased users.
Consumers have shifted their loyalty and shopping
behavior—and intend to continue the new patterns as the
COVID-19 crisis subsides
​Omnichannel is ascendant | Current as of March 2022
McKinsey & Company 15
​Source: McKinsey & Company COVID-19 India Consumer Pulse Survey, 3/11–3/24/2022, n = 1,009, sampled and weighted to match the India general population 18+ years
59 61 81 83
68
25
62
0 85
5
67
60
15
65
63 64
35
79
65 78
76
66 69
45
70
55
75
84
71 72 73 75
74
0
77 80 82
Social player/video app
Social media
Watching e-sports
Video chat: personal
Wellness app
Remote learning: myself
NFTs (digital assets)
Online fitness
Online streaming
Playing online games
Videoconferencing: professional
Telemedicine: physical health
Telemedicine: mental health
Remote learning: my children
Digital banking
Augmented reality/
virtual reality
Cryptocurrency
Intent to use when COVID-19 crisis subsides2
% of new or increased users who intend to keep doing activity
User
growth
since
COVID-19
1
1. User growth is calculated as % of respondents who replied that they are new users over % of respondents who replied that they were using the product/service pre-COVID-19 (using more, using the same or using less) on Q: Which best
describes when you have done or used each of these items?
2. Q: Compared to now, will you do or use the following more, less, or not at all, once the coronavirus (COVID-19) ) crisis subsides (ie, once there is herd immunity)? Possible answers: “will stop this”; ”will reduce this”; “will keep doing what I am
doing now”; “will increase this.” Number indicates respondents who chose “will keep doing what I am doing now” and “will increase this” among new or increased users.
Intent to use digital services remains high, along with growth rate
of new tech such as digital assets and augmented or virtual reality
​Omnichannel is ascendant | Current as of March 2022
McKinsey & Company 16
33
37
29
32
32 7
New store/restaurant app
Personal care/grooming at home
5
A drive-thru line for a fast-food restaurant
38
30
24
Buy online for in-store pickup
30
34
34
24
37
30
37
6
30
29
16
26
29
26
37
31
4
Deal-finding plug-ins
28
4
29
Augmented reality/virtual reality
Social-media direct purchase
36
7
7
42
Online secondhand products 32
7
5
34
30
35
Cryptocurrency
36
4
3
Same-day delivery
33
Changed primary grocery store
4
36
5
NFTs (digital assets)
Delivery within 2 hours or 1 hour
28
35
41
32
37
Do-it-yourself (DIY) project
28
8
Shopped at new store
24
5
20
Cooked regularly
41
36
6
18
37
25
33
1. Q: And have you used or done any of the following in the last 3 months? If yes, Q: Which best describes when you have done or used each of these items? Possible answers: “just started using since COVID-19 started”; “I have not used in
the last 3 months”; “I have used in the last 3 months at the same rate as before”; “3.I have used this more in the past 3 month than before”; “I have used this less in the past 3 months than before.”
2. Q: Compared to now, will you do or use the following more, less, or not at all, once the coronavirus (COVID-19) ) crisis subsides (ie, once there is herd immunity)? Possible answers: “will stop this”; ”will reduce this”; “will keep doing what I
am doing now”; “will increase this.” Number indicates respondents who chose “will keep doing what I am doing now” and “will increase this” among new or increased users.
​Source: McKinsey & Company COVID-19 India Consumer Pulse Survey, 3/11–3/24/2022, n = 1,009, sampled and weighted to match the India general population 18+ years
Intent to
continue2
Consumers continue to explore new technology, and their use of
services accelerated during the COVID-19 pandemic
68
71
70
60
77
78
74
68
68
77
78
79
71
66
76
74
Which best describes when you have done or used each of these items?1
% of respondents who have used in the last 3 months
Using more
Just started using Using same
Using less
​Omnichannel is ascendant | Current as of March 2022
McKinsey & Company 17
Consumers’ usage of at-home alternatives to out-of-home activities
has increased
1. Q: Have you used or done any of the following since the coronavirus (COVID-19) crisis started? If yes, Q: Which best describes when you have done or used each of these items? Possible answers: “just started using since COVID-19
started”; “using more since COVID-19 started”; “using about the same since COVID-19 started”; “using less since COVID-19 started.”
2. Q: Compared to now, will you do or use the following more, less, or not at all, once the coronavirus (COVID-19) crisis subsides (ie, once there is herd immunity)? Possible answers: “will stop this”; ”will reduce this”; “will keep doing what I am
doing now”; “will increase this.” Number indicates respondents who chose “will keep doing what I am doing now” and “will increase this” among new or increased users.
​Source: McKinsey & Company COVID-19 India Consumer Pulse Survey, 3/11–3/24/2022, n = 1,009, sampled and weighted to match the India general population 18+ years
6
3
26
Playing online gaming
37
30
Online personal training, fitness
13
36
40
24
26
5
28
42
23
27
Wellness app
49
35
34
Virtual hangouts and video chats for personal use
3
7
14
Digital banking
37
33
5
Meal kit delivery
44
35
31
32
12
41
13
Grocery delivery
Restaurant food delivery
46
7
15
31
Video conferencing for professional use
6
22
17
4
30
5 51
30
Online streaming
Telemedicine for physical health care
40
51
41
33
41
29
18
23
6
Telemedicine for mental health care
21
4
Watching online gaming
34
32
6
28
5
Remote learning for myself
32
34
Remote learning for my kids
32
8
Social player/video app
53
32
6
10
Used social media
23
77
78
82
64
71
79
76
70
71
58
67
67
65
65
66
63
76
Intent to
continue2
Which best describes when you have done or used each of these items?1
% of respondents who have used in the last 3 months
Using same
Using less
Just started using Using more
​Omnichannel is ascendant | Current as of March 2022
McKinsey & Company 18
−10
−60
−80
−70
−20
−30
−50
−40
0
10
20
30
40
Feb
2021
Mar
2020
Apr
2020
May
2020
June
2020
Sept
2020
Nov
2020
Oct
2021
Mar
2022
Expected spending per category over the next 2–3 months vs usual1
Net intent2
Source: McKinsey & Company COVID-19 India Consumer Pulse Survey, 3/11–3/24/2022, n = 1,009; 10/18–10/25/2021, n = 1,002; 2/18–2/28/2021, n = 1,019; 11/9–11/20/2020, n = 1,091; 9/18–9/27/2020, n =
1,051; 6/19–6/22/2020, n = 624; 5/22–5/25/2020, n = 614; 5/1–5/4/2020, n = 648; 4/10–4/13/2020, n = 631; 4/3–4/6/2020, n = 601; 3/27–3/30/2020, n = 582, sampled and weighted to match the India’s general
population 18+ years
Consumer electronics
Groceries
Household supplies
Out-of-home
entertainment
Skin care and makeup
Fitness and wellness
​Personal-care products
Apparel
Domestic flights
Meals at restaurants
1. Q: Over the next 2–3 months, do you expect that you will spend more, about the same, or less money on these categories than usual? Figures may not sum to 100% because of rounding.
2. Net intent is calculated by subtracting the % of respondents stating they expect to decrease spending from the % of respondents stating they expect to increase spending.
Positive spend impact | Current as of March 2022
Net intent to spend has increased across most of the categories
since 2020, whereas grocery spend has stabilized
McKinsey & Company 19
Consumers report positive net intent across all categories except
grocery, which is stabilizing
Net intent >1
Net intent −15 to 0
Net intent: < −15
​Source: McKinsey & Company COVID-19 India Consumer Pulse Survey, 3/11–3/24/2022, n = 1,009, sampled and weighted to match the India general population 18+ years
19
25
21
25
24
31
25
24
28
31
22
12
11
17
27
18
20
15
39
39
28
29
30
35
25
31
36
26
33
38
33
37
31
34
37
33
Alcohol
Personal-care products
Groceries
Tobacco products
Footwear
Food takeout and delivery
Quick-service restaurant
Restaurant
Accessories
Apparel
Jewelry
Toys and baby supplies
Household supplies
Skin care and makeup
Home and furniture
Sports and outdoors
Home improvement, garden
Kitchen and dining
Decrease Stay the same Increase
16
15
15
15
21
23
23
15
16
17
22
24
21
25
24
19
30
21
35
41
37
28
34
34
37
42
37
38
32
34
36
39
32
47
31
33
Consumer electronics
Out-of-home entertainment
Adventures and tours
Pet food and supplies
Vitamins and OTC medicine
Entertainment at home
Books/magazines/newspapers
Pet care services
Hotel/resort stays
Fitness and wellness
Personal-care services
Gasoline
Vehicles
Short-term home rentals
Travel by car
Cruises
International flights
Domestic flights
Net
intent2
22
13
13
11
14
27
21
21
10
15
13
8
28
2
25
11
1. Q: Over the next 2–3 months, do you expect that you will spend more, about the same, or less money on these categories than usual? Figures may not sum to 100% because of rounding.
2. Net intent is calculated by subtracting the % of respondents stating they expect to decrease spending from the % of respondents stating they expect to increase spending.
Expected spending per category over the next 2–3 months vs usual1
% of respondents
−18
+26
-6
+1
+1
+1
+2
-2
+11
-3
+3
-4
-3
+5
+3
+4
+10
-1
Change since
Oct 2021
Change since
Oct 2021
19 +4
-9
+2
+5
+8
+1
+2
-1
+7
+4
-2
+10
+5
+15
0
+22
+6
12 +11
Net
intent2
8
20
11
26
3
14
8
5
7
4
0
7
−5
22
20
16
17
19
Positive spend impact | Current as of March 2022
McKinsey & Company 20
Vaccinated respondents plan to increase their discretionary
spending more than those unlikely to get vaccinated
​Source: McKinsey & Company COVID-19 India Consumer Pulse Survey, 3/11–3/24/2022, n = 1,009, sampled and weighted to match the India general population 18+ years
1. Net intent is calculated by subtracting the % of respondents stating they expect to decrease spending from the % of respondents stating they expect to increase spending.
2. Q: Over the next 2–3 months, do you expect that you will spend more, about the same, or less money on these categories than usual?
+2
percentage points
Likelihood of
vaccinated vs
unvaccinated people
to spend
For selected categories
Net intent1 for expected spending per category over the next 2-3 months vs usual2
Unlikely Cautious Interested Vaccinated
Groceries
Food takeout and delivery
Restaurant
Quick-service restaurant
Vitamins and supplements
Skin care and makeup
Personal-care services
Apparel
Consumer electronics
International flights
45
−13
−23
−34
26
−7
14
−20
−59
0
47
9
5
20
35
38
−13
−6
11
48
21
29
20
7
−3
42
30
−5
11
69
20
7
4
7
26
19
22
7
14
27
Between −3 and +3
< −3 > +3
Positive spend impact | Current as of March 2022
McKinsey & Company 21
Among consumers who intend to spend more, roughly 30
percent say it is to get premium products, and about 25 percent
say it is because prices are higher
​Source: McKinsey & Company COVID-19 India Consumer Pulse Survey, 3/11–3/24/2022, n = 1,009, sampled and weighted to match the India general population 18+ years
20
16
17
13
25
11
12
17
12
16
15
14
14
25
15
9
12
15
25
27
38
30
24
32
31
38
24
24
25
28
21
25
25
25
26
24
20
31
26
32
23
29
35
22
39
30
34
32
39
28
32
29
37
34
35
26
20
25
27
28
22
23
25
29
27
26
26
21
28
37
25
27
Household supplies
Meals at restaurants
Groceries
Pet care services
Pet food and supplies
Food takeout/delivery
Vitamins and supplements
Meals at quick-serve rest
Vehicles
Personal-care products
Apparel
Footwear
Accessories
Consumer electronics
Home and decoration
Kitchen and dining
Skin care and makeup
Personal-care services
Increase in income
Increase in price
Larger quantity
Premium brands/products
1. Q: Please indicate the main reason for planning to spend more on the following categories.
Reasons for increase in spend1
% of respondents who increased spend
Positive spend impact | Current as of March 2022
McKinsey & Company 22
Among consumers intending to spend less, roughly 35
percent are value seekers, and about 30 percent are
variety seekers
​Source: McKinsey & Company COVID-19 India Consumer Pulse Survey, 3/11–3/24/2022, n = 1,009, sampled and weighted to match the India general population 18+ years
26
22
15
16
8
15
15
20
8
20
16
9
17
14
18
19
16
14
45
35
39
33
39
27
30
32
38
38
32
28
34
43
36
36
26
32
18
27
23
27
36
42
39
25
29
23
26
34
28
19
20
22
32
23
6
12
21
22
12
12
16
16
20
17
21
25
18
22
20
18
23
27
6
3
1
2
5
4
7
5
2
5
4
3
2
5
5
3
4
1
Meals at restaurants
Household supplies
Groceries
Pet food and supplies
Food takeout/delivery
Meals at quick-serve rest
Personal-care products
Pet care services
Vitamins and supplements
Apparel
Footwear
Accessories
Consumer electronics
Vehicles
Home and decoration
Kitchen and dining
Skin care and makeup
Personal-care services
Decrease in income Switch to less expensive
Smaller quantity Spend more on other categories
Reduced price
1. Q: Please indicate the main reason for planning to spend less on the following categories.
Reasons for decrease in spend1
% of respondents who decreased spend
Positive spend impact | Current as of March 2022
McKinsey & Company 23
41
33
36
24
28
22
20
June 2020
Mar 2022
Oct 2021
Feb 2021
Sep 2020
Nov 2020
May 2020
Overall
23
42
Vaccinated Unvaccinated
Gen Z Millennials
38
46
Gen X
39
Baby boomers3
46
41
High (>2M
rupees)
Low (<500,000
rupees)
57
37
Medium
(500,000–2M
rupees)
1. Q: Which best describes when you will regularly return to stores, restaurants, and other out-of-home activities? Chart shows those already participating in these activities.
2. Gen Z are people under 25 years old, millennials are 25–44 years old, Gen X are people 45–54 years old, baby boomers are 55 years old and above.
3. Baby boomers includes silent generation.
By
generation2
By
vaccination
adoption
By income
~46%
of Gen X and baby
boomers are doing out-
of-home activities
~57%
of higher-income
households are doing
out-of-home activities
~42%
of people who are
vaccinated are doing
out-of-home activities
Consumers engaging in out-of-home activities,1 % of respondents
Source: McKinsey & Company COVID-19 India Consumer Pulse Survey, 3/11–3/24/2022, n = 1,009; 10/18–10/25/2021, n = 1,002; 2/18–2/28/2021, n = 1,019; 11/9–11/20/2020, n = 1,091; 9/18–9/27/2020, n =
1,051; 6/19–6/22/2020, n = 624; 5/22–5/25/2020, n = 614; 5/1–5/4/2020, n = 648; 4/10–4/13/2020, n = 631; 4/3–4/6/2020, n = 601; 3/27–3/30/2020, n = 582, sampled and weighted to match the India’s general
population 18+ years
Home economy is pervasive | Current as of March 2022
More Indian consumers say they are engaging in out-of-home
activities, led by higher-income households and older generations
McKinsey & Company 24
Out-of-home activities currently engaged in1
% of respondents who say they are doing this in the same or a modified way
1. Q: Which best describes how you are engaging in each of these activities? ? Possible answers: “Not doing this all”; “Doing this in the same way as pre-COVID-19, but less often”; “Doing this in a modified way vs. pre-COVID-19”; “Doing this
just as much and in the same way as I did pre-COVID-19.”
Social
Personal
care
Entertain-
ment 88
76
78
77
78
89
88
89
86
Attend an outdoor event
Dine indoors at a restaurant or bar
Go out for family entertainment
Attend an indoor cultural event
Visit a crowded outdoor public place
Go to a hair or nail salon
Go to the gym or fitness studio
Get together with family
Get together with friends
90
96
91
89
93
84
89
86
81
82
86
Travel more than 2 hours by car
Use public transportation
Work outside my home
Shop for groceries/necessities
Shop for non-necessities
Go to a shopping mall
Use a ride-sharing service
Travel by airplane
Travel by train
Stay in a hotel
Rent a short-term home
Work
Shopping
Transport/
travel
21
31
20
29
30
29
54
42
46
36
44
36
38
41
31
35
37
28
33
30
80% and above
Less than 80%
Change >10 pp
Change from
Oct 2021,
percentage points
Change from
Oct 2021,
percentage points
Consumers increased all out-of-home activities since October 2021,
with the biggest increase occurring in travel and entertainment
​Source: McKinsey & Company COVID-19 India Consumer Pulse Survey, 3/1–3/24/2022, n = 1,009; 10/18–10/25/2021, n = 1,002; 2/18–2/28/2021, n = 1,019, sampled and weighted to match the
India general population 18+ years
Home economy is pervasive | Current as of March 2022
McKinsey & Company 25
1. Q: With the rise of the omicron variant of COVID-19, how, if at all, has your out-of-home behavior changed?
​Source: McKinsey & Company COVID-19 India Consumer Pulse Survey, 3/11–3/24/2022, n = 1,009, sampled and weighted to match the India general population 18+ years
8
12 14 9
51 42
32
32
39
51
High
(>2M rupees)
4
Medium
(500,000–2M
rupees)
Low
(<500,000
rupees)
4
11
13
21
44
41
39
28
4
Vaccinated Unvaccinated
13
44
38
Engage less
5
Engage more
Overall
Engage with
adjusted behavior
Engage same as
before omicron
By income By vaccination status
More than half of
lower-income
consumers have
adjusted their
behavior when
going out, whereas
higher-income
consumers are
engaging less
Vaccinated consumers
are more cautious
than the unvaccinated
population
Key findings
Adjustments to out-of-home behavior due to prevalence of omicron variant,1 % of respondents
About 45 percent of consumers have changed the way they engage
in out-of-home activities because of the omicron variant
Home economy is pervasive | Current as of March 2022
McKinsey & Company 26
1. Q: Which best describes how you are engaging in each of these activities? Possible answers: “Not doing this at all”; “Doing this in the same way as pre-COVID-19, but less often”; “Doing this in a modified way vs. pre-COVID-19”;
“Doing this just as much and in the same way as I did pre-COVID-19.”
Work
Shopping
Transport/
travel
Social
Personal
care
Entertain-
ment
Go out for family entertainment
75 25
27
79
​Dine indoors at a restaurant or bar
21
73
Attend an outdoor event
26
74
Visit a crowded outdoor public place
27
73
Attend an indoor cultural event
25
75
Go to a hair or nail salon
33
24
67
Get together with friends 27
Go to the gym or fitness studio
73
76
Get together with family
79
24
78
73
Work outside my home
24
22
76
Go to a shopping mall
Shop for groceries/necessities
Shop for non-necessities
76
21
Stay in a hotel
76
24
27
25
Travel by train
Rent a short-term home 78
25
75
Travel more than 2 hours by car
22
24
78
​Use a ride-sharing service
75
Use public transportation
Travel by airplane
22
76
Doing less, doing in a modified way
Doing as much as and in the same way as pre-COVID-19
Out-of-home activities engagement,1
% of respondents having engaged in activity pre-COVID-19
Around 70 percent of consumers have modified their behavior
when out of home across all categories
​Source: McKinsey & Company COVID-19 India Consumer Pulse Survey, 3/11–3/24/2022, n = 1,009, sampled and weighted to match the India general population 18+ years
Home economy is pervasive | Current as of March 2022
McKinsey & Company 27
Main life events done in the last 12 months as a result of COVID-19,1 % of respondents Change >3 pp
64
22
20
35
26
20
18
10
10
12
12
Moved into a bigger home
Decided to change jobs
Renovated/remodeled my home
Worked more from home
Started homeschooling children
Set up a specific work-from-home space
Set up a gym at home
Got a new pet at home (eg, dog, cat)
Moved into a smaller home
Bought a property
Sold a property
Work/study
change
Mar 2022
Pet adoption
House move
Home
renovation
Investments/
divestments
Total,2
%
Change from
Oct 2021,
percentage points
−2
1
−1
2
1
0
3
0
2
1
1
18
78
20
57
21
1. Q: Which of the following have you done in the last 12 months as a result of the COVID-19 crisis?
2. Total percentage of people who choose option(s) in the category.
Even though consumers have increased out-of-home activity,
they continue to invest in their home environment
​Source: McKinsey & Company COVID-19 India Consumer Pulse Survey, 3/11–3/24/2022, n = 1,009, sampled and weighted to match the India general population 18+ years
Home economy is pervasive | Current as of March 2022
McKinsey & Company 28
Milestones for the India population not yet engaging with out-of-home activities1
% of respondents awaiting each milestone before engaging
25
30
24
22
Government
lifts restrictions
Government lifts
restrictions and
other requirements
Vaccination
coverage
COVID-19 no
longer spreading
59%
of people are not
currently engaging
in ‘normal’ out-of-
home activities
​Source: McKinsey & Company COVID-19 India Consumer Pulse Survey, 3/11–3/24/2022, n = 1,009, sampled and weighted to match the India general population 18+ years
Vaccination coverage
Government lifts restrictions and …
1. Q: Which best describes when you will regularly return to stores, restaurants, and other out-of-home activities? Chart rebased to exclude those already
participating in these activities and those who do not deem any of these items important. Figures may not sum to 100% because of rounding.
9%
Medical authorities deem safe
12%
Stores, restaurants, and other
indoor places start taking safety
measures
8%
I see other people returning
8%
Vaccine is widely distributed
9%
I have been vaccinated
7%
Family member(s) vaccinated
Around 60 percent of consumers are cautious about returning to
out-of-home activities until social restrictions are completely lifted
Home economy is pervasive | Current as of March 2022
McKinsey & Company 29
97
64
60
59
53
45
41
Different brand
Any new shopping behavior
Different retailer/store/website
Private label/store brand
New social-commerce method
New shopping method3
New digital shopping method
​Source: McKinsey & Company COVID-19 India Consumer Pulse Survey, 3/11–3/24/2022, n = 1,009; 10/18–10/25/2021, n = 1,002; 2/18–2/28/2021, n = 1,019 sampled and weighted to match the India general
population 18+ years
91 N/A
85 8
81 8
81 9
High
(>2M rupees)
Gen Z Millennials
98
99 98
60
87 11 67 63
61
60 58
61
67 62
62
55 57
53
41 41
Income cut
Generational cut
All consumers
% of
respondents
Change from
Oct 2021,
percentage points
Intent to continue behavior2
Between −3 and +3
< −3 > +3
1. Q: Over the past 3 months, which of the following have you done? 3% replied “None of these”
2. Q: Which best describes whether or not you plan to continue with these shopping changes? Possible answers: “will go back to what I did before 3 months ago”; ”will keep doing both this and what I did before 3 months ago”; ”will keep doing
this and NOT go back to what I did before 3 months ago.” Intent to continue includes respondents who selected “will keep doing both this and what I did before 3 months ago” and “will keep doing this and NOT go back to what I did before 3
months ago.”
3. “New shopping method” includes curbside pickup and delivery apps.
Behaviors since COVID-19 pandemic started1
% of respondents
Consumers have tried new shopping behaviors, including new
retailers and brands, during the COVID-19 pandemic
Difference from all respondents,
percentage points
86 10
47
56 44
Loyalty shakeup continues | Current as of March 2022
McKinsey & Company 30
1. Q: Over the last 3 months, have you wanted to buy something and not been able to purchase it because it was out of stock or otherwise not available?
2. Q: The most recent time this happened (when you wanted to buy something and it was not available), what did you do?
​Source: McKinsey & Company COVID-19 India Consumer Pulse Survey, 3/11–3/24/2022, n = 1,009, sampled and weighted to match the India general population 18+ years
23
77
Mar 2022
Could not purchase
at least 1 item
Able to purchase
all items
Respondents who planned to purchase
something but could not, due to unavailability1
% of respondents
29
25
23
18
5
Bought the product
at a different retailer
Bought a different brand or similar
product at a different retailer
Waited until the product was
available at the same retailer
Did not buy anything
Bought a different product
at the same retailer
All consumers who could not make a planned
purchase2
% of respondents
Loyalty shakeup continues | Current as of March 2022
When products are out of stock, consumers are
more likely to substitute retailers or brands than to
wait for products to become available
McKinsey & Company 31
Is available where I’m shopping
Using eco-friendly ingredients
Supporting local businesses
Is natural/organic
Better shipping/delivery cost
Better prices/promotions
11
Better value
Using recyclable packing materials
Larger package sizes
12
Shares my values
7
The company treats its employees well
24
Products are in stock
Better quality
11
32
Wanted to try a new brand I found
Wanted to try a type of product I’ve never tried before
Wanted variety/a change from my normal routine
Wanted to treat myself
Cleaner/has better hygiene measures 11
27
13
21
20
10
15
7
18
23
15
11
−1 7
0
Reason for trying a new brand since COVID-19 began,1 % of respondents selecting reason in top 3
​Source: McKinsey & Company COVID-19 India Consumer Pulse Survey, 3/1–3/24/2022, n = 1,009, sampled and weighted to match the India general population 18+ years
Personal choice
Convenience
Quality/organic
Novelty
Health/hygiene
Availability
Purpose driven
Value
51
57
11
44
35
13
11
26
All consumers
Between −3 and +3
< −3 > +3
Difference from all respondents,
percentage points
x Net % of respondents per category
Gen Z/
millennials Baby boomers2
Gen X
−3 36
−3
1 −9
0
−1 8
1
3 −12
−3
0 0
−1
−1 1
1
1 −10
−1
2 −7
−2
0 3
−2
−4 10
7
−3 6
5
−2 11
1
0 −3
1
2 −6
−4
0 −9
1
1. Q: You mentioned you tried a new/different brand than what you normally buy. What were the main reasons that drove this decision? Select up to 3 relevant reasons.
“Brand” includes different brand, new private label/store brand. Overarching reason based on % of individual respondents responding to at least 1 reason in the group.
2. Baby boomers includes silent generation.
Loyalty shakeup continues | Current as of March 2022
The top reasons consumers give for switching brands are to attain
greater value and better quality
−9
2
0
2 −8
−4

Weitere ähnliche Inhalte

Ähnlich wie McKinsey Survey: Indian consumer sentiment during the coronavirus crisis

McKinsey Survey: Japanese consumer sentiment during the coronavirus crisis
McKinsey Survey: Japanese consumer sentiment during the coronavirus crisisMcKinsey Survey: Japanese consumer sentiment during the coronavirus crisis
McKinsey Survey: Japanese consumer sentiment during the coronavirus crisisMcKinsey on Marketing & Sales
 
McKinsey Survey: Australian consumer sentiment during the coronavirus crisis
McKinsey Survey: Australian consumer sentiment during the coronavirus crisisMcKinsey Survey: Australian consumer sentiment during the coronavirus crisis
McKinsey Survey: Australian consumer sentiment during the coronavirus crisisMcKinsey on Marketing & Sales
 
McKinsey Survey: Chinese consumer sentiment during the coronavirus crisis
McKinsey Survey: Chinese consumer sentiment during the coronavirus crisisMcKinsey Survey: Chinese consumer sentiment during the coronavirus crisis
McKinsey Survey: Chinese consumer sentiment during the coronavirus crisisMcKinsey on Marketing & Sales
 
McKinsey Survey: Australian consumer sentiment during the coronavirus crisis
McKinsey Survey: Australian consumer sentiment during the coronavirus crisisMcKinsey Survey: Australian consumer sentiment during the coronavirus crisis
McKinsey Survey: Australian consumer sentiment during the coronavirus crisisMcKinsey on Marketing & Sales
 
McKinsey Survey: Italian consumer sentiment during the coronavirus crisis
McKinsey Survey: Italian consumer sentiment during the coronavirus crisisMcKinsey Survey: Italian consumer sentiment during the coronavirus crisis
McKinsey Survey: Italian consumer sentiment during the coronavirus crisisMcKinsey on Marketing & Sales
 
McKinsey Survey: US consumer sentiment during the coronavirus crisis
McKinsey Survey: US consumer sentiment during the coronavirus crisisMcKinsey Survey: US consumer sentiment during the coronavirus crisis
McKinsey Survey: US consumer sentiment during the coronavirus crisisMcKinsey on Marketing & Sales
 
McKinsey Survey: German consumer sentiment during the coronavirus crisis
McKinsey Survey: German consumer sentiment during the coronavirus crisisMcKinsey Survey: German consumer sentiment during the coronavirus crisis
McKinsey Survey: German consumer sentiment during the coronavirus crisisMcKinsey on Marketing & Sales
 
McKinsey Survey: UK consumer sentiment during the coronavirus crisis
McKinsey Survey: UK consumer sentiment during the coronavirus crisisMcKinsey Survey: UK consumer sentiment during the coronavirus crisis
McKinsey Survey: UK consumer sentiment during the coronavirus crisisMcKinsey on Marketing & Sales
 
McKinsey Survey: US consumer sentiment during the coronavirus crisis
McKinsey Survey: US consumer sentiment during the coronavirus crisisMcKinsey Survey: US consumer sentiment during the coronavirus crisis
McKinsey Survey: US consumer sentiment during the coronavirus crisisMcKinsey on Marketing & Sales
 
McKinsey Survey: Spanish consumer sentiment during the coronavirus crisis
McKinsey Survey: Spanish consumer sentiment during the coronavirus crisisMcKinsey Survey: Spanish consumer sentiment during the coronavirus crisis
McKinsey Survey: Spanish consumer sentiment during the coronavirus crisisMcKinsey on Marketing & Sales
 
McKinsey Survey: German consumer sentiment during the coronavirus crisis
McKinsey Survey: German consumer sentiment during the coronavirus crisisMcKinsey Survey: German consumer sentiment during the coronavirus crisis
McKinsey Survey: German consumer sentiment during the coronavirus crisisMcKinsey on Marketing & Sales
 
McKinsey Survey: UK consumer sentiment during the coronavirus crisis
McKinsey Survey: UK consumer sentiment during the coronavirus crisisMcKinsey Survey: UK consumer sentiment during the coronavirus crisis
McKinsey Survey: UK consumer sentiment during the coronavirus crisisMcKinsey on Marketing & Sales
 
McKinsey Survey: Mexican consumer sentiment during the coronavirus crisis
McKinsey Survey: Mexican consumer sentiment during the coronavirus crisisMcKinsey Survey: Mexican consumer sentiment during the coronavirus crisis
McKinsey Survey: Mexican consumer sentiment during the coronavirus crisisMcKinsey on Marketing & Sales
 
McKinsey Survey: Japanese consumer sentiment during the coronavirus crisis
McKinsey Survey: Japanese consumer sentiment during the coronavirus crisisMcKinsey Survey: Japanese consumer sentiment during the coronavirus crisis
McKinsey Survey: Japanese consumer sentiment during the coronavirus crisisMcKinsey on Marketing & Sales
 
McKinsey Survey: Chinese consumer sentiment during the coronavirus crisis
McKinsey Survey: Chinese consumer sentiment during the coronavirus crisisMcKinsey Survey: Chinese consumer sentiment during the coronavirus crisis
McKinsey Survey: Chinese consumer sentiment during the coronavirus crisisMcKinsey on Marketing & Sales
 

Ähnlich wie McKinsey Survey: Indian consumer sentiment during the coronavirus crisis (20)

McKinsey Survey: Japanese consumer sentiment during the coronavirus crisis
McKinsey Survey: Japanese consumer sentiment during the coronavirus crisisMcKinsey Survey: Japanese consumer sentiment during the coronavirus crisis
McKinsey Survey: Japanese consumer sentiment during the coronavirus crisis
 
McKinsey Survey: Japanese consumer sentiment during the coronavirus crisis
McKinsey Survey: Japanese consumer sentiment during the coronavirus crisisMcKinsey Survey: Japanese consumer sentiment during the coronavirus crisis
McKinsey Survey: Japanese consumer sentiment during the coronavirus crisis
 
McKinsey Survey: Australian consumer sentiment during the coronavirus crisis
McKinsey Survey: Australian consumer sentiment during the coronavirus crisisMcKinsey Survey: Australian consumer sentiment during the coronavirus crisis
McKinsey Survey: Australian consumer sentiment during the coronavirus crisis
 
McKinsey Survey: Chinese consumer sentiment during the coronavirus crisis
McKinsey Survey: Chinese consumer sentiment during the coronavirus crisisMcKinsey Survey: Chinese consumer sentiment during the coronavirus crisis
McKinsey Survey: Chinese consumer sentiment during the coronavirus crisis
 
McKinsey Survey: Australian consumer sentiment during the coronavirus crisis
McKinsey Survey: Australian consumer sentiment during the coronavirus crisisMcKinsey Survey: Australian consumer sentiment during the coronavirus crisis
McKinsey Survey: Australian consumer sentiment during the coronavirus crisis
 
McKinsey Survey: Italian consumer sentiment during the coronavirus crisis
McKinsey Survey: Italian consumer sentiment during the coronavirus crisisMcKinsey Survey: Italian consumer sentiment during the coronavirus crisis
McKinsey Survey: Italian consumer sentiment during the coronavirus crisis
 
McKinsey Survey: Italian consumer sentiment during the coronavirus crisis
McKinsey Survey: Italian consumer sentiment during the coronavirus crisisMcKinsey Survey: Italian consumer sentiment during the coronavirus crisis
McKinsey Survey: Italian consumer sentiment during the coronavirus crisis
 
McKinsey Survey: US consumer sentiment during the coronavirus crisis
McKinsey Survey: US consumer sentiment during the coronavirus crisisMcKinsey Survey: US consumer sentiment during the coronavirus crisis
McKinsey Survey: US consumer sentiment during the coronavirus crisis
 
McKinsey Survey: German consumer sentiment during the coronavirus crisis
McKinsey Survey: German consumer sentiment during the coronavirus crisisMcKinsey Survey: German consumer sentiment during the coronavirus crisis
McKinsey Survey: German consumer sentiment during the coronavirus crisis
 
McKinsey Survey: UK consumer sentiment during the coronavirus crisis
McKinsey Survey: UK consumer sentiment during the coronavirus crisisMcKinsey Survey: UK consumer sentiment during the coronavirus crisis
McKinsey Survey: UK consumer sentiment during the coronavirus crisis
 
McKinsey Survey: US consumer sentiment during the coronavirus crisis
McKinsey Survey: US consumer sentiment during the coronavirus crisisMcKinsey Survey: US consumer sentiment during the coronavirus crisis
McKinsey Survey: US consumer sentiment during the coronavirus crisis
 
McKinsey Survey: US consumer sentiment during the coronavirus crisis
McKinsey Survey: US consumer sentiment during the coronavirus crisisMcKinsey Survey: US consumer sentiment during the coronavirus crisis
McKinsey Survey: US consumer sentiment during the coronavirus crisis
 
McKinsey Survey: Spanish consumer sentiment during the coronavirus crisis
McKinsey Survey: Spanish consumer sentiment during the coronavirus crisisMcKinsey Survey: Spanish consumer sentiment during the coronavirus crisis
McKinsey Survey: Spanish consumer sentiment during the coronavirus crisis
 
McKinsey Survey: German consumer sentiment during the coronavirus crisis
McKinsey Survey: German consumer sentiment during the coronavirus crisisMcKinsey Survey: German consumer sentiment during the coronavirus crisis
McKinsey Survey: German consumer sentiment during the coronavirus crisis
 
McKinsey Survey: UK consumer sentiment during the coronavirus crisis
McKinsey Survey: UK consumer sentiment during the coronavirus crisisMcKinsey Survey: UK consumer sentiment during the coronavirus crisis
McKinsey Survey: UK consumer sentiment during the coronavirus crisis
 
McKinsey Survey: Mexican consumer sentiment during the coronavirus crisis
McKinsey Survey: Mexican consumer sentiment during the coronavirus crisisMcKinsey Survey: Mexican consumer sentiment during the coronavirus crisis
McKinsey Survey: Mexican consumer sentiment during the coronavirus crisis
 
McKinsey Survey: Mexican consumer sentiment during the coronavirus crisis
McKinsey Survey: Mexican consumer sentiment during the coronavirus crisisMcKinsey Survey: Mexican consumer sentiment during the coronavirus crisis
McKinsey Survey: Mexican consumer sentiment during the coronavirus crisis
 
McKinsey Survey: Mexican consumer sentiment during the coronavirus crisis
McKinsey Survey: Mexican consumer sentiment during the coronavirus crisisMcKinsey Survey: Mexican consumer sentiment during the coronavirus crisis
McKinsey Survey: Mexican consumer sentiment during the coronavirus crisis
 
McKinsey Survey: Japanese consumer sentiment during the coronavirus crisis
McKinsey Survey: Japanese consumer sentiment during the coronavirus crisisMcKinsey Survey: Japanese consumer sentiment during the coronavirus crisis
McKinsey Survey: Japanese consumer sentiment during the coronavirus crisis
 
McKinsey Survey: Chinese consumer sentiment during the coronavirus crisis
McKinsey Survey: Chinese consumer sentiment during the coronavirus crisisMcKinsey Survey: Chinese consumer sentiment during the coronavirus crisis
McKinsey Survey: Chinese consumer sentiment during the coronavirus crisis
 

Mehr von McKinsey on Marketing & Sales

McKinsey European consumer sentiment survey: How current events are shaping S...
McKinsey European consumer sentiment survey: How current events are shaping S...McKinsey European consumer sentiment survey: How current events are shaping S...
McKinsey European consumer sentiment survey: How current events are shaping S...McKinsey on Marketing & Sales
 
McKinsey European consumer sentiment survey: How current events are shaping U...
McKinsey European consumer sentiment survey: How current events are shaping U...McKinsey European consumer sentiment survey: How current events are shaping U...
McKinsey European consumer sentiment survey: How current events are shaping U...McKinsey on Marketing & Sales
 
McKinsey European consumer sentiment survey: How current events are shaping I...
McKinsey European consumer sentiment survey: How current events are shaping I...McKinsey European consumer sentiment survey: How current events are shaping I...
McKinsey European consumer sentiment survey: How current events are shaping I...McKinsey on Marketing & Sales
 
McKinsey European consumer sentiment survey: How current events are shaping G...
McKinsey European consumer sentiment survey: How current events are shaping G...McKinsey European consumer sentiment survey: How current events are shaping G...
McKinsey European consumer sentiment survey: How current events are shaping G...McKinsey on Marketing & Sales
 
McKinsey European consumer sentiment survey: How current events are shaping F...
McKinsey European consumer sentiment survey: How current events are shaping F...McKinsey European consumer sentiment survey: How current events are shaping F...
McKinsey European consumer sentiment survey: How current events are shaping F...McKinsey on Marketing & Sales
 
McKinsey European consumer sentiment survey: How current events are shaping U...
McKinsey European consumer sentiment survey: How current events are shaping U...McKinsey European consumer sentiment survey: How current events are shaping U...
McKinsey European consumer sentiment survey: How current events are shaping U...McKinsey on Marketing & Sales
 
McKinsey European consumer sentiment survey: How current events are shaping G...
McKinsey European consumer sentiment survey: How current events are shaping G...McKinsey European consumer sentiment survey: How current events are shaping G...
McKinsey European consumer sentiment survey: How current events are shaping G...McKinsey on Marketing & Sales
 
McKinsey European consumer sentiment survey: How current events in Europe are...
McKinsey European consumer sentiment survey: How current events in Europe are...McKinsey European consumer sentiment survey: How current events in Europe are...
McKinsey European consumer sentiment survey: How current events in Europe are...McKinsey on Marketing & Sales
 
McKinsey European consumer sentiment survey: How current events are shaping S...
McKinsey European consumer sentiment survey: How current events are shaping S...McKinsey European consumer sentiment survey: How current events are shaping S...
McKinsey European consumer sentiment survey: How current events are shaping S...McKinsey on Marketing & Sales
 
McKinsey European consumer sentiment survey: How current events are shaping I...
McKinsey European consumer sentiment survey: How current events are shaping I...McKinsey European consumer sentiment survey: How current events are shaping I...
McKinsey European consumer sentiment survey: How current events are shaping I...McKinsey on Marketing & Sales
 
McKinsey survey: European consumer sentiment survey: How current events are s...
McKinsey survey: European consumer sentiment survey: How current events are s...McKinsey survey: European consumer sentiment survey: How current events are s...
McKinsey survey: European consumer sentiment survey: How current events are s...McKinsey on Marketing & Sales
 
McKinsey Survey: European consumer sentiment during the coronavirus crisis
McKinsey Survey: European consumer sentiment during the coronavirus crisisMcKinsey Survey: European consumer sentiment during the coronavirus crisis
McKinsey Survey: European consumer sentiment during the coronavirus crisisMcKinsey on Marketing & Sales
 
McKinsey Survey: Indian consumer sentiment during the coronavirus crisis
McKinsey Survey: Indian consumer sentiment during the coronavirus crisisMcKinsey Survey: Indian consumer sentiment during the coronavirus crisis
McKinsey Survey: Indian consumer sentiment during the coronavirus crisisMcKinsey on Marketing & Sales
 

Mehr von McKinsey on Marketing & Sales (18)

McKinsey European consumer sentiment survey: How current events are shaping S...
McKinsey European consumer sentiment survey: How current events are shaping S...McKinsey European consumer sentiment survey: How current events are shaping S...
McKinsey European consumer sentiment survey: How current events are shaping S...
 
McKinsey European consumer sentiment survey: How current events are shaping U...
McKinsey European consumer sentiment survey: How current events are shaping U...McKinsey European consumer sentiment survey: How current events are shaping U...
McKinsey European consumer sentiment survey: How current events are shaping U...
 
McKinsey European consumer sentiment survey: How current events are shaping I...
McKinsey European consumer sentiment survey: How current events are shaping I...McKinsey European consumer sentiment survey: How current events are shaping I...
McKinsey European consumer sentiment survey: How current events are shaping I...
 
McKinsey European consumer sentiment survey: How current events are shaping G...
McKinsey European consumer sentiment survey: How current events are shaping G...McKinsey European consumer sentiment survey: How current events are shaping G...
McKinsey European consumer sentiment survey: How current events are shaping G...
 
McKinsey European consumer sentiment survey: How current events are shaping F...
McKinsey European consumer sentiment survey: How current events are shaping F...McKinsey European consumer sentiment survey: How current events are shaping F...
McKinsey European consumer sentiment survey: How current events are shaping F...
 
McKinsey European consumer sentiment survey: How current events are shaping F...
McKinsey European consumer sentiment survey: How current events are shaping F...McKinsey European consumer sentiment survey: How current events are shaping F...
McKinsey European consumer sentiment survey: How current events are shaping F...
 
McKinsey European consumer sentiment survey: How current events are shaping U...
McKinsey European consumer sentiment survey: How current events are shaping U...McKinsey European consumer sentiment survey: How current events are shaping U...
McKinsey European consumer sentiment survey: How current events are shaping U...
 
McKinsey European consumer sentiment survey: How current events are shaping G...
McKinsey European consumer sentiment survey: How current events are shaping G...McKinsey European consumer sentiment survey: How current events are shaping G...
McKinsey European consumer sentiment survey: How current events are shaping G...
 
McKinsey European consumer sentiment survey: How current events in Europe are...
McKinsey European consumer sentiment survey: How current events in Europe are...McKinsey European consumer sentiment survey: How current events in Europe are...
McKinsey European consumer sentiment survey: How current events in Europe are...
 
McKinsey European consumer sentiment survey: How current events are shaping S...
McKinsey European consumer sentiment survey: How current events are shaping S...McKinsey European consumer sentiment survey: How current events are shaping S...
McKinsey European consumer sentiment survey: How current events are shaping S...
 
McKinsey European consumer sentiment survey: How current events are shaping I...
McKinsey European consumer sentiment survey: How current events are shaping I...McKinsey European consumer sentiment survey: How current events are shaping I...
McKinsey European consumer sentiment survey: How current events are shaping I...
 
McKinsey survey: European consumer sentiment survey: How current events are s...
McKinsey survey: European consumer sentiment survey: How current events are s...McKinsey survey: European consumer sentiment survey: How current events are s...
McKinsey survey: European consumer sentiment survey: How current events are s...
 
McKinsey survey: European consumer sentiment survey: How current events are s...
McKinsey survey: European consumer sentiment survey: How current events are s...McKinsey survey: European consumer sentiment survey: How current events are s...
McKinsey survey: European consumer sentiment survey: How current events are s...
 
McKinsey Survey: European consumer sentiment during the coronavirus crisis
McKinsey Survey: European consumer sentiment during the coronavirus crisisMcKinsey Survey: European consumer sentiment during the coronavirus crisis
McKinsey Survey: European consumer sentiment during the coronavirus crisis
 
McKinsey Survey: Indian consumer sentiment during the coronavirus crisis
McKinsey Survey: Indian consumer sentiment during the coronavirus crisisMcKinsey Survey: Indian consumer sentiment during the coronavirus crisis
McKinsey Survey: Indian consumer sentiment during the coronavirus crisis
 

Kürzlich hochgeladen

Sales & Marketing Alignment: How to Synergize for Success
Sales & Marketing Alignment: How to Synergize for SuccessSales & Marketing Alignment: How to Synergize for Success
Sales & Marketing Alignment: How to Synergize for SuccessAggregage
 
Mondelez State of Snacking and Future Trends 2023
Mondelez State of Snacking and Future Trends 2023Mondelez State of Snacking and Future Trends 2023
Mondelez State of Snacking and Future Trends 2023Neil Kimberley
 
Monte Carlo simulation : Simulation using MCSM
Monte Carlo simulation : Simulation using MCSMMonte Carlo simulation : Simulation using MCSM
Monte Carlo simulation : Simulation using MCSMRavindra Nath Shukla
 
VIP Call Girl Jamshedpur Aashi 8250192130 Independent Escort Service Jamshedpur
VIP Call Girl Jamshedpur Aashi 8250192130 Independent Escort Service JamshedpurVIP Call Girl Jamshedpur Aashi 8250192130 Independent Escort Service Jamshedpur
VIP Call Girl Jamshedpur Aashi 8250192130 Independent Escort Service JamshedpurSuhani Kapoor
 
It will be International Nurses' Day on 12 May
It will be International Nurses' Day on 12 MayIt will be International Nurses' Day on 12 May
It will be International Nurses' Day on 12 MayNZSG
 
VIP Kolkata Call Girl Howrah 👉 8250192130 Available With Room
VIP Kolkata Call Girl Howrah 👉 8250192130  Available With RoomVIP Kolkata Call Girl Howrah 👉 8250192130  Available With Room
VIP Kolkata Call Girl Howrah 👉 8250192130 Available With Roomdivyansh0kumar0
 
Call Girls Navi Mumbai Just Call 9907093804 Top Class Call Girl Service Avail...
Call Girls Navi Mumbai Just Call 9907093804 Top Class Call Girl Service Avail...Call Girls Navi Mumbai Just Call 9907093804 Top Class Call Girl Service Avail...
Call Girls Navi Mumbai Just Call 9907093804 Top Class Call Girl Service Avail...Dipal Arora
 
Progress Report - Oracle Database Analyst Summit
Progress  Report - Oracle Database Analyst SummitProgress  Report - Oracle Database Analyst Summit
Progress Report - Oracle Database Analyst SummitHolger Mueller
 
Best VIP Call Girls Noida Sector 40 Call Me: 8448380779
Best VIP Call Girls Noida Sector 40 Call Me: 8448380779Best VIP Call Girls Noida Sector 40 Call Me: 8448380779
Best VIP Call Girls Noida Sector 40 Call Me: 8448380779Delhi Call girls
 
Call Girls Pune Just Call 9907093804 Top Class Call Girl Service Available
Call Girls Pune Just Call 9907093804 Top Class Call Girl Service AvailableCall Girls Pune Just Call 9907093804 Top Class Call Girl Service Available
Call Girls Pune Just Call 9907093804 Top Class Call Girl Service AvailableDipal Arora
 
A DAY IN THE LIFE OF A SALESMAN / WOMAN
A DAY IN THE LIFE OF A  SALESMAN / WOMANA DAY IN THE LIFE OF A  SALESMAN / WOMAN
A DAY IN THE LIFE OF A SALESMAN / WOMANIlamathiKannappan
 
Mysore Call Girls 8617370543 WhatsApp Number 24x7 Best Services
Mysore Call Girls 8617370543 WhatsApp Number 24x7 Best ServicesMysore Call Girls 8617370543 WhatsApp Number 24x7 Best Services
Mysore Call Girls 8617370543 WhatsApp Number 24x7 Best ServicesDipal Arora
 
Yaroslav Rozhankivskyy: Три складові і три передумови максимальної продуктивн...
Yaroslav Rozhankivskyy: Три складові і три передумови максимальної продуктивн...Yaroslav Rozhankivskyy: Три складові і три передумови максимальної продуктивн...
Yaroslav Rozhankivskyy: Три складові і три передумови максимальної продуктивн...Lviv Startup Club
 
Keppel Ltd. 1Q 2024 Business Update Presentation Slides
Keppel Ltd. 1Q 2024 Business Update  Presentation SlidesKeppel Ltd. 1Q 2024 Business Update  Presentation Slides
Keppel Ltd. 1Q 2024 Business Update Presentation SlidesKeppelCorporation
 
The CMO Survey - Highlights and Insights Report - Spring 2024
The CMO Survey - Highlights and Insights Report - Spring 2024The CMO Survey - Highlights and Insights Report - Spring 2024
The CMO Survey - Highlights and Insights Report - Spring 2024christinemoorman
 
M.C Lodges -- Guest House in Jhang.
M.C Lodges --  Guest House in Jhang.M.C Lodges --  Guest House in Jhang.
M.C Lodges -- Guest House in Jhang.Aaiza Hassan
 
0183760ssssssssssssssssssssssssssss00101011 (27).pdf
0183760ssssssssssssssssssssssssssss00101011 (27).pdf0183760ssssssssssssssssssssssssssss00101011 (27).pdf
0183760ssssssssssssssssssssssssssss00101011 (27).pdfRenandantas16
 

Kürzlich hochgeladen (20)

Sales & Marketing Alignment: How to Synergize for Success
Sales & Marketing Alignment: How to Synergize for SuccessSales & Marketing Alignment: How to Synergize for Success
Sales & Marketing Alignment: How to Synergize for Success
 
Mondelez State of Snacking and Future Trends 2023
Mondelez State of Snacking and Future Trends 2023Mondelez State of Snacking and Future Trends 2023
Mondelez State of Snacking and Future Trends 2023
 
Monte Carlo simulation : Simulation using MCSM
Monte Carlo simulation : Simulation using MCSMMonte Carlo simulation : Simulation using MCSM
Monte Carlo simulation : Simulation using MCSM
 
VIP Call Girl Jamshedpur Aashi 8250192130 Independent Escort Service Jamshedpur
VIP Call Girl Jamshedpur Aashi 8250192130 Independent Escort Service JamshedpurVIP Call Girl Jamshedpur Aashi 8250192130 Independent Escort Service Jamshedpur
VIP Call Girl Jamshedpur Aashi 8250192130 Independent Escort Service Jamshedpur
 
Forklift Operations: Safety through Cartoons
Forklift Operations: Safety through CartoonsForklift Operations: Safety through Cartoons
Forklift Operations: Safety through Cartoons
 
It will be International Nurses' Day on 12 May
It will be International Nurses' Day on 12 MayIt will be International Nurses' Day on 12 May
It will be International Nurses' Day on 12 May
 
VIP Kolkata Call Girl Howrah 👉 8250192130 Available With Room
VIP Kolkata Call Girl Howrah 👉 8250192130  Available With RoomVIP Kolkata Call Girl Howrah 👉 8250192130  Available With Room
VIP Kolkata Call Girl Howrah 👉 8250192130 Available With Room
 
Call Girls Navi Mumbai Just Call 9907093804 Top Class Call Girl Service Avail...
Call Girls Navi Mumbai Just Call 9907093804 Top Class Call Girl Service Avail...Call Girls Navi Mumbai Just Call 9907093804 Top Class Call Girl Service Avail...
Call Girls Navi Mumbai Just Call 9907093804 Top Class Call Girl Service Avail...
 
Progress Report - Oracle Database Analyst Summit
Progress  Report - Oracle Database Analyst SummitProgress  Report - Oracle Database Analyst Summit
Progress Report - Oracle Database Analyst Summit
 
Best VIP Call Girls Noida Sector 40 Call Me: 8448380779
Best VIP Call Girls Noida Sector 40 Call Me: 8448380779Best VIP Call Girls Noida Sector 40 Call Me: 8448380779
Best VIP Call Girls Noida Sector 40 Call Me: 8448380779
 
Call Girls Pune Just Call 9907093804 Top Class Call Girl Service Available
Call Girls Pune Just Call 9907093804 Top Class Call Girl Service AvailableCall Girls Pune Just Call 9907093804 Top Class Call Girl Service Available
Call Girls Pune Just Call 9907093804 Top Class Call Girl Service Available
 
A DAY IN THE LIFE OF A SALESMAN / WOMAN
A DAY IN THE LIFE OF A  SALESMAN / WOMANA DAY IN THE LIFE OF A  SALESMAN / WOMAN
A DAY IN THE LIFE OF A SALESMAN / WOMAN
 
Mysore Call Girls 8617370543 WhatsApp Number 24x7 Best Services
Mysore Call Girls 8617370543 WhatsApp Number 24x7 Best ServicesMysore Call Girls 8617370543 WhatsApp Number 24x7 Best Services
Mysore Call Girls 8617370543 WhatsApp Number 24x7 Best Services
 
Best Practices for Implementing an External Recruiting Partnership
Best Practices for Implementing an External Recruiting PartnershipBest Practices for Implementing an External Recruiting Partnership
Best Practices for Implementing an External Recruiting Partnership
 
Yaroslav Rozhankivskyy: Три складові і три передумови максимальної продуктивн...
Yaroslav Rozhankivskyy: Три складові і три передумови максимальної продуктивн...Yaroslav Rozhankivskyy: Три складові і три передумови максимальної продуктивн...
Yaroslav Rozhankivskyy: Три складові і три передумови максимальної продуктивн...
 
Keppel Ltd. 1Q 2024 Business Update Presentation Slides
Keppel Ltd. 1Q 2024 Business Update  Presentation SlidesKeppel Ltd. 1Q 2024 Business Update  Presentation Slides
Keppel Ltd. 1Q 2024 Business Update Presentation Slides
 
The CMO Survey - Highlights and Insights Report - Spring 2024
The CMO Survey - Highlights and Insights Report - Spring 2024The CMO Survey - Highlights and Insights Report - Spring 2024
The CMO Survey - Highlights and Insights Report - Spring 2024
 
M.C Lodges -- Guest House in Jhang.
M.C Lodges --  Guest House in Jhang.M.C Lodges --  Guest House in Jhang.
M.C Lodges -- Guest House in Jhang.
 
0183760ssssssssssssssssssssssssssss00101011 (27).pdf
0183760ssssssssssssssssssssssssssss00101011 (27).pdf0183760ssssssssssssssssssssssssssss00101011 (27).pdf
0183760ssssssssssssssssssssssssssss00101011 (27).pdf
 
Nepali Escort Girl Kakori \ 9548273370 Indian Call Girls Service Lucknow ₹,9517
Nepali Escort Girl Kakori \ 9548273370 Indian Call Girls Service Lucknow ₹,9517Nepali Escort Girl Kakori \ 9548273370 Indian Call Girls Service Lucknow ₹,9517
Nepali Escort Girl Kakori \ 9548273370 Indian Call Girls Service Lucknow ₹,9517
 

McKinsey Survey: Indian consumer sentiment during the coronavirus crisis

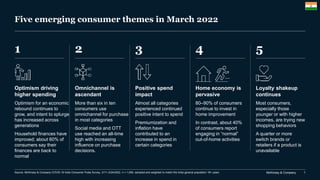
  • 1. McKinsey & Company 1 Five emerging consumer themes in March 2022 1 2 Source: McKinsey & Company COVID-19 India Consumer Pulse Survey, 3/11–3/24/2022, n = 1,009, sampled and weighted to match the India general population 18+ years 5 4 3 Optimism driving higher spending Optimism for an economic rebound continues to grow, and intent to splurge has increased across generations Household finances have improved; about 60% of consumers say their finances are back to normal Omnichannel is ascendant More than six in ten consumers use omnichannel for purchase in most categories Social media and OTT use reached an all-time high with increasing influence on purchase decisions. Loyalty shakeup continues Most consumers, especially those younger or with higher incomes, are trying new shopping behaviors A quarter or more switch brands or retailers if a product is unavailable Home economy is pervasive 80–90% of consumers continue to invest in home improvement In contrast, about 40% of consumers report engaging in “normal” out-of-home activities Positive spend impact Almost all categories experienced continued positive intent to spend Premiumization and inflation have contributed to an increase in spend in certain categories
  • 2. McKinsey & Company 2 Confidence in own country’s economic recovery after COVID-19,1 % of respondents 11 15 15 21 14 29 32 29 29 34 46 56 51 63 48 47 59 68 55 38 28 27 23 23 21 12 3 20 75 5 Mixed: The economy will be impacted for 6–12 months or longer and will stagnate or show slow growth thereafter Pessimistic: COVID-19 will have lasting impact on the economy and show regression or fall into lengthy recession Optimistic: The economy will rebound within 2–3 months and grow just as strong as or stronger than before COVID-19 Indian consumers are more likely than other countries’ consumers to be optimistic about their country’s economy 1. Q: What is your overall confidence level surrounding economic conditions after the coronavirus (COVID-19) crisis subsides (ie, once there is herd immunity)? Rated from 1 “very optimistic” to 6 “very pessimistic.” Bars may not sum to 100% due to rounding. Japan China 3/11–20 3/16–26 Australia 3/16–25 Korea 3/19–26 US 3/1–25 Change in optimistic vs last wave survey, percentage points −12 −6 −10 +15 −2 Source: McKinsey & Company COVID-19 Consumer Pulse Survey India 3/11–24 +1 Oct 2021 Oct 2021 Oct 2021 Oct 2021 Indonesia 3/16–26 +15 Sept 2020 Nov 2020 June 2020 Germany 3/22–28 France 3/23–28 UK 3/22–29 −10 −9 −12 Oct 2021 Oct 2021 Oct 2021 Optimism driving higher spending | Current as of March 2022
  • 3. McKinsey & Company 3 12 11 11 11 10 7 5 5 36 32 39 37 32 31 25 21 20 52 57 50 51 58 62 71 74 75 Mar 2022 June 2020 Nov 2020 Sept 2020 Mar 2020 Apr 20202 Feb 2021 May 20202 4 Oct 2021 Optimism driving higher spending | Current as of March 2022 1. Q: What is your overall confidence level surrounding economic conditions after the coronavirus (COVID-19) crisis subsides (ie, once there is herd immunity)? Rated from 1 “very optimistic” to 6 “very pessimistic.” Figures may not sum to 100% because of rounding. 2. Average of weekly pulse surveys shown for March and April 2020. Optimistic: The economy will rebound within 2–3 months and grow just as strong as or stronger than before COVID-19 Mixed: The economy will be impacted for 6–12 months or longer and will stagnate or show slow growth thereafter Pessimistic: COVID-19 will have lasting impact on the economy and show regression or fall into lengthy recession Source: McKinsey & Company COVID-19 India Consumer Pulse Survey, 3/11–3/24/2022, n = 1,009; 10/18–10/25/2021, n = 1,002; 2/18–2/28/2021, n = 1,019; 11/9–11/20/2020, n = 1,091; 9/18–9/27/2020, n = 1,051; 6/19–6/22/2020, n = 624; 5/22–5/25/2020, n = 614; 5/1–5/4/2020, n = 648; 4/10–4/13/2020, n = 631; 4/3–4/6/2020, n = 601; 3/27–3/30/2020, n = 582, sampled and weighted to match the India’s general population 18+ years Indian consumers’ overall optimism has steadily increased over the past two years Confidence in own country’s economic recovery after COVID-19,1 % of respondents
  • 4. McKinsey & Company 4 Baby boomers, millennials, and vaccinated consumers are the most optimistic segments Confidence in own country’s economic recovery after COVID-191 % of respondents 21 20 21 76 59 4 Vaccinated Unvaccinated 1. Q: What is your overall confidence level surrounding economic conditions after the coronavirus (COVID-19) crisis subsides (ie, once there is herd immunity)? Rated from 1 “very optimistic” to 6 “very pessimistic.” 2. Baby boomers includes silent generation. 6 9 23 18 21 17 71 79 70 81 Baby boomers2 Gen Z 3 2 Millennials Gen X Optimistic Mixed Pessimistic Source: McKinsey & Company COVID-19 India Consumer Pulse Survey, 3/11–3/24/2022, n = 1,009, sampled and weighted to match the India general population 18+ years By generation By vaccination status Optimism driving higher spending | Current as of March 2022
  • 5. McKinsey & Company 5 24 19 17 22 36 30 35 14 40 51 48 64 Gen Z Millennials Gen X Baby boomers3 20 28 33 14 48 59 Vaccinated Unvaccinated 20 31 48 Overall 1. Q: When do you expect your routines will return to normal? Figures may not sum to 100% because of rounding. 2. Q: Which best describes your vaccination status? 3. Baby boomers includes silent generation. McKinsey & Company COVID-19 India Consumer Pulse Survey, 3/11–3/24/2022, n = 1,009, sampled and weighted to match the India general population 18+ years After June 2022 By June 2022 Not affected/already returned By generation By vaccination status2 Younger generations are more optimistic about the return, while ~60% of older consumers expect a longer lead time Vaccinated consumers expect to return to normalcy sooner than unvaccinated consumers Key findings Overall, nearly half of consumers expect pre-COVID-19 routines will return after June 2022 Expectations on routines returning to normal,1 % of respondents Optimism driving higher spending | Current as of March 2022
  • 6. McKinsey & Company 6 More consumers than last year report that their incomes, spending, and savings have increased About the same Reduced slightly/a lot Increased slightly/a lot 47 33 20 Past 2 weeks 35 24 41 Past 2 weeks 31 30 39 Past month 28 48 25 27 Past 2 weeks 29 43 Past 2 weeks 34 26 40 Past month Past 2 weeks 43 38 26 Past 2 weeks 36 31 26 53 20 27 Past month Source: McKinsey & Company COVID-19 India Consumer Pulse Survey, 3/11–3/24/2022, n = 1,009; 10/18–10/25/2021, n=1,002; 2/18–2/28/2021, n = 1,019, sampled and weighted to match the India general population 18+ years 1. Q: How has the coronavirus (COVID-19) crisis affected the following over the past 1 month/2 weeks? Figures may not sum to 100% because of rounding. Household income1 % of respondents Household spending1 % of respondents Household savings1 % of respondents Feb 2021 Oct 2021 Mar 2022 Feb 2021 Oct 2021 Mar 2022 Feb 2021 Oct 2021 Mar 2022 Optimism driving higher spending | Current as of March 2022
  • 7. McKinsey & Company 7 Almost six in ten consumers say their personal finances have returned to ‘normal’ or will have by Q2 2022 28 29 25 37 34 27 30 19 38 43 45 44 Gen Z Baby boomers3 Millennials Gen X 28 34 29 25 43 40 Vaccinated Unvaccinated 29 29 43 Overall 1. Q: When do you expect your personal/household finances will return to normal? Figures may not sum to 100% because of rounding. 2. Q: Which best describes your vaccination status? 3. Baby boomers includes silent generation. ​Source: McKinsey & Company COVID-19 India Consumer Pulse Survey, 3/11–3/24/2022, n = 1,009, sampled and weighted to match the India general population 18+ years By generation By vaccination status2 ~40% of baby boomers say their finances either were not affected or are back to normal, vs ~30% of Gen Z and millennials Expectations on personal/household finances returning to ‘normal,’1 % of respondents By June 2022 After June 2022 Not affected/already returned Optimism driving higher spending | Current as of March 2022
  • 8. McKinsey & Company 8 Consumers still want to ‘splurge,’ and the intent to spend is high across incomes and generations ​Source: McKinsey & Company COVID-19 India Consumer Pulse Survey, 3/11–3/24/2022, n = 1,009; 10/18–10/25/2021, n = 1,002; 2/18–2/28/2021, n = 1,019 sampled and weighted to match the India general population 18+ years Feb 2021 83 17 17 74 26 Oct 2021 Plan on splurging 83 Mar 2022 Do not plan on splurging Millennials Gen X Baby boomers2 81% 4 88% 13 Gen Z 46% −26 75% −6 87% 0 93% 10 93% 26 60% 13 95% 44 74% 7 81% 18 91% 22 Generation 2 Respondents who plan/do not plan to ‘splurge’ or ‘treat themselves’ in 20221 % of respondents Low (<500,000 rupees) Middle (500,000–2M rupees) High (>2M rupees) >70% <30% 50–70% 30–50% p.p. change from Oct 21 XX Respondents who plan to splurge, by household income, % Optimism driving higher spending | Current as of March 2022 1. Q: With regard to products and services you will spend money on, do you plan to splurge/treat yourself in 2022? For example, are there categories of products or services you have spent less on over the last year and half which you feel you will spend more on in next 3 months? 2. Baby Boomers includes silent generation.
  • 9. McKinsey & Company 9 Splurging on household items and entertainment has seen a spike since last year Categories where consumers intend to treat themselves1 % of all respondents with intent to splurge 1. Q: You mentioned that you plan to splurge/treat yourself in next 6 months. Which categories do you intend to treat yourself to? Please select all that apply. 2. Baby boomers includes silent generation. 47 46 45 44 43 41 40 39 37 35 30 29 11 Personal services Electronics Restaurants, dining out, bars Travel, lodging, vacation Apparel, shoes, accessories Items for your home Makeup, skin care products Out-of-home entertainment Fitness, sports, outdoors Household essentials Sports apparel and equipment Pets Outdoor living Millennials Gen X Gen Z Baby boomers2 1 1 −5 7 −3 2 −2 6 4 2 −6 −5 3 0 −2 −4 −4 3 −4 12 3 4 −5 −11 0 −1 1 0 6 1 −6 −4 −5 2 −2 10 Generational cut 5 2 −4 −12 −4 6 −6 1 −2 3 0 −11 2 1 −1 −9 Change from Oct 2021, percentage points ​Source: McKinsey & Company COVID-19 India Consumer Pulse Survey, 3/11–3/24/2022, n = 1,009; 10/18–10/25/2021, n = 1,002; 2/18–2/28/2021, n = 1,019, sampled and weighted to match the India general population 18+ years Between −3 and +3 < −3 > +3 0 −2 0 1 −3 6 2 6 0 3 −1 −7 5 Categories Difference from all respondents, percentage points Optimism driving higher spending | Current as of March 2022
  • 10. McKinsey & Company 10 More than 60 percent of consumers use omnichannel for purchases in most of the categories 1. Q: Which best describes how you have researched the following categories over the last 3 months? 2. Q: Which best describes how you have purchased the following categories over the last 3 months? 21 7 15 15 10 21 10 20 7 14 9 18 15 12 9 20 64 54 62 64 65 58 65 64 65 62 67 64 69 71 67 60 15 39 23 21 24 21 25 16 28 24 24 18 15 17 25 20 Food takeout/delivery Toys and baby supplies Groceries/food for home Household supplies Pet food and supplies Fitness and wellness services Personal-care products Vitamins, supplements, and OTC medicine Apparel Footwear Consumer electronics Home decoration and furniture Kitchen and dining Home improvement and gardening supplies Skin care and makeup Books, magazines, newspapers Research and purchase only in stores Research and purchase only online Omnichannel Product searches1 and purchases2 by channel % of respondents who purchased and searched in these categories in the last 3 months ​Source: McKinsey & Company COVID-19 India Consumer Pulse Survey, 3/11–3/24/2022, n = 1,009, sampled and weighted to match the India general population 18+ years ​Omnichannel is ascendant | Current as of March 2022
  • 11. McKinsey & Company 11 Social media influences purchase decisions across most categories for Gen Z and millennials 1. Q: Think about the purchases you have made in the following categories over the past 3 months. Were you influenced toward a certain brand by a post on social media in the following categories?. 2. Baby boomers includes silent generation. 63 55 70 76 67 65 73 69 68 63 70 59 62 67 75 59 Groceries/food for home Apparel Jewelry Skin care and makeup Household supplies Personal care products Footwear Accessories Consumer electronics Home improvement and garden supplies Sports and outdoors equipment, supplies Kitchen and dining Pet food and supplies Home decoration and furniture Fitness and wellness services Vitamins, supplements, and OTC medicine Millennials Gen X Gen Z Baby boomers2 10 −6 −23 −5 6 0 −16 2 3 −4 −12 4 1 −4 −10 9 5 −3 −27 6 1 −2 −15 7 3 −6 −26 −1 −4 10 −19 1 −2 0 5 Generational cut 0 4 −10 5 −11 7 −4 1 −4 8 −4 −24 −10 3 6 −19 ​Source: McKinsey & Company COVID-19 India Consumer Pulse Survey, 3/11–3/24/2022, n = 1,009, sampled and weighted to match the India general population 18+ years Between −3 and +3 < −3 > +3 Categories Categories where respondents were influenced by social media1 % of all respondents −5 −3 −3 0 4 3 5 −4 −3 −4 7 −2 −10 Difference from all respondents, percentage points ​Omnichannel is ascendant | Current as of March 2022
  • 12. McKinsey & Company 12 Almost all respondents engage on some social-media platforms at least once a week Frequency of engagement with social-media platforms1 % of all respondents 1. Q: What social-media platforms do you engage with, and if so, how frequently? ​Source: McKinsey & Company COVID-19 India Consumer Pulse Survey, 3/11–3/24/2022, n = 1,009, sampled and weighted to match the India general population 18+ years 99 97 91 87 75 71 66 64 52 3 9 13 25 29 34 36 48 LinkedIn 1 Instagram Pinterest Overall YouTube Twitter Facebook Snapchat Reddit Never/less than weekly Weekly or more ​Omnichannel is ascendant | Current as of March 2022
  • 13. McKinsey & Company 13 More than 90 percent of consumers view content on OTT platforms at least once a week Frequency of engagement with entertainment platforms1 % of all respondents 1. Q: What entertainment platforms do you engage with, and if so, how frequently? ​Source: McKinsey & Company COVID-19 India Consumer Pulse Survey, 3/11–3/24/2022, n = 1,009, sampled and weighted to match the India general population 18+ years 93 80 78 75 64 47 7 20 22 25 36 53 Other OTT platform (eg, Zee5, MxPlayer) Overall Sony Liv Amazon Prime Netflix Disney Hotstar Never/less than weekly Weekly or more ​Omnichannel is ascendant | Current as of March 2022
  • 14. McKinsey & Company 14 70 35 54 76 65 30 70 40 64 45 56 60 25 58 66 68 82 72 74 78 80 0 50 5 55 10 15 20 Grocery delivery Shopped at a new store Purchased pre-owned product Used an app for same-day delivery Meal kit delivery Restaurant food delivery New store/restaurant app Drive-thru lane Changed my primary store Purchased directly from social media Personal care/grooming at home Downloaded/used deal-finding plug-ins Used an app for 2-hour or 1-hour delivery Buy online, pick up in store ​Source: McKinsey & Company COVID-19 India Consumer Pulse Survey, 3/11–3/24/2022, n = 1,009, sampled and weighted to match the India general population 18+ years Intent to use when COVID-19 crisis subsides2 % of new or increased users who intend to keep doing activity User growth since COVID-19 1 1. User growth is calculated as % of respondents who replied that they are new users over % of respondents who replied that they were using the product/service pre-COVID-19 (using more, using the same or using less) on Q: Which best describes when you have done or used each of these items? 2. Q: Compared to now, will you do or use the following more, less, or not at all, once the coronavirus (COVID-19) crisis subsides (ie, once there is herd immunity)? Possible answers: “will stop this”; ”will reduce this”; “will keep doing what I am doing now”; “will increase this.” Number indicates percent who chose “will keep doing what I am doing now” and “will increase this” among new or increased users. Consumers have shifted their loyalty and shopping behavior—and intend to continue the new patterns as the COVID-19 crisis subsides ​Omnichannel is ascendant | Current as of March 2022
  • 15. McKinsey & Company 15 ​Source: McKinsey & Company COVID-19 India Consumer Pulse Survey, 3/11–3/24/2022, n = 1,009, sampled and weighted to match the India general population 18+ years 59 61 81 83 68 25 62 0 85 5 67 60 15 65 63 64 35 79 65 78 76 66 69 45 70 55 75 84 71 72 73 75 74 0 77 80 82 Social player/video app Social media Watching e-sports Video chat: personal Wellness app Remote learning: myself NFTs (digital assets) Online fitness Online streaming Playing online games Videoconferencing: professional Telemedicine: physical health Telemedicine: mental health Remote learning: my children Digital banking Augmented reality/ virtual reality Cryptocurrency Intent to use when COVID-19 crisis subsides2 % of new or increased users who intend to keep doing activity User growth since COVID-19 1 1. User growth is calculated as % of respondents who replied that they are new users over % of respondents who replied that they were using the product/service pre-COVID-19 (using more, using the same or using less) on Q: Which best describes when you have done or used each of these items? 2. Q: Compared to now, will you do or use the following more, less, or not at all, once the coronavirus (COVID-19) ) crisis subsides (ie, once there is herd immunity)? Possible answers: “will stop this”; ”will reduce this”; “will keep doing what I am doing now”; “will increase this.” Number indicates respondents who chose “will keep doing what I am doing now” and “will increase this” among new or increased users. Intent to use digital services remains high, along with growth rate of new tech such as digital assets and augmented or virtual reality ​Omnichannel is ascendant | Current as of March 2022
  • 16. McKinsey & Company 16 33 37 29 32 32 7 New store/restaurant app Personal care/grooming at home 5 A drive-thru line for a fast-food restaurant 38 30 24 Buy online for in-store pickup 30 34 34 24 37 30 37 6 30 29 16 26 29 26 37 31 4 Deal-finding plug-ins 28 4 29 Augmented reality/virtual reality Social-media direct purchase 36 7 7 42 Online secondhand products 32 7 5 34 30 35 Cryptocurrency 36 4 3 Same-day delivery 33 Changed primary grocery store 4 36 5 NFTs (digital assets) Delivery within 2 hours or 1 hour 28 35 41 32 37 Do-it-yourself (DIY) project 28 8 Shopped at new store 24 5 20 Cooked regularly 41 36 6 18 37 25 33 1. Q: And have you used or done any of the following in the last 3 months? If yes, Q: Which best describes when you have done or used each of these items? Possible answers: “just started using since COVID-19 started”; “I have not used in the last 3 months”; “I have used in the last 3 months at the same rate as before”; “3.I have used this more in the past 3 month than before”; “I have used this less in the past 3 months than before.” 2. Q: Compared to now, will you do or use the following more, less, or not at all, once the coronavirus (COVID-19) ) crisis subsides (ie, once there is herd immunity)? Possible answers: “will stop this”; ”will reduce this”; “will keep doing what I am doing now”; “will increase this.” Number indicates respondents who chose “will keep doing what I am doing now” and “will increase this” among new or increased users. ​Source: McKinsey & Company COVID-19 India Consumer Pulse Survey, 3/11–3/24/2022, n = 1,009, sampled and weighted to match the India general population 18+ years Intent to continue2 Consumers continue to explore new technology, and their use of services accelerated during the COVID-19 pandemic 68 71 70 60 77 78 74 68 68 77 78 79 71 66 76 74 Which best describes when you have done or used each of these items?1 % of respondents who have used in the last 3 months Using more Just started using Using same Using less ​Omnichannel is ascendant | Current as of March 2022
  • 17. McKinsey & Company 17 Consumers’ usage of at-home alternatives to out-of-home activities has increased 1. Q: Have you used or done any of the following since the coronavirus (COVID-19) crisis started? If yes, Q: Which best describes when you have done or used each of these items? Possible answers: “just started using since COVID-19 started”; “using more since COVID-19 started”; “using about the same since COVID-19 started”; “using less since COVID-19 started.” 2. Q: Compared to now, will you do or use the following more, less, or not at all, once the coronavirus (COVID-19) crisis subsides (ie, once there is herd immunity)? Possible answers: “will stop this”; ”will reduce this”; “will keep doing what I am doing now”; “will increase this.” Number indicates respondents who chose “will keep doing what I am doing now” and “will increase this” among new or increased users. ​Source: McKinsey & Company COVID-19 India Consumer Pulse Survey, 3/11–3/24/2022, n = 1,009, sampled and weighted to match the India general population 18+ years 6 3 26 Playing online gaming 37 30 Online personal training, fitness 13 36 40 24 26 5 28 42 23 27 Wellness app 49 35 34 Virtual hangouts and video chats for personal use 3 7 14 Digital banking 37 33 5 Meal kit delivery 44 35 31 32 12 41 13 Grocery delivery Restaurant food delivery 46 7 15 31 Video conferencing for professional use 6 22 17 4 30 5 51 30 Online streaming Telemedicine for physical health care 40 51 41 33 41 29 18 23 6 Telemedicine for mental health care 21 4 Watching online gaming 34 32 6 28 5 Remote learning for myself 32 34 Remote learning for my kids 32 8 Social player/video app 53 32 6 10 Used social media 23 77 78 82 64 71 79 76 70 71 58 67 67 65 65 66 63 76 Intent to continue2 Which best describes when you have done or used each of these items?1 % of respondents who have used in the last 3 months Using same Using less Just started using Using more ​Omnichannel is ascendant | Current as of March 2022
  • 18. McKinsey & Company 18 −10 −60 −80 −70 −20 −30 −50 −40 0 10 20 30 40 Feb 2021 Mar 2020 Apr 2020 May 2020 June 2020 Sept 2020 Nov 2020 Oct 2021 Mar 2022 Expected spending per category over the next 2–3 months vs usual1 Net intent2 Source: McKinsey & Company COVID-19 India Consumer Pulse Survey, 3/11–3/24/2022, n = 1,009; 10/18–10/25/2021, n = 1,002; 2/18–2/28/2021, n = 1,019; 11/9–11/20/2020, n = 1,091; 9/18–9/27/2020, n = 1,051; 6/19–6/22/2020, n = 624; 5/22–5/25/2020, n = 614; 5/1–5/4/2020, n = 648; 4/10–4/13/2020, n = 631; 4/3–4/6/2020, n = 601; 3/27–3/30/2020, n = 582, sampled and weighted to match the India’s general population 18+ years Consumer electronics Groceries Household supplies Out-of-home entertainment Skin care and makeup Fitness and wellness ​Personal-care products Apparel Domestic flights Meals at restaurants 1. Q: Over the next 2–3 months, do you expect that you will spend more, about the same, or less money on these categories than usual? Figures may not sum to 100% because of rounding. 2. Net intent is calculated by subtracting the % of respondents stating they expect to decrease spending from the % of respondents stating they expect to increase spending. Positive spend impact | Current as of March 2022 Net intent to spend has increased across most of the categories since 2020, whereas grocery spend has stabilized
  • 19. McKinsey & Company 19 Consumers report positive net intent across all categories except grocery, which is stabilizing Net intent >1 Net intent −15 to 0 Net intent: < −15 ​Source: McKinsey & Company COVID-19 India Consumer Pulse Survey, 3/11–3/24/2022, n = 1,009, sampled and weighted to match the India general population 18+ years 19 25 21 25 24 31 25 24 28 31 22 12 11 17 27 18 20 15 39 39 28 29 30 35 25 31 36 26 33 38 33 37 31 34 37 33 Alcohol Personal-care products Groceries Tobacco products Footwear Food takeout and delivery Quick-service restaurant Restaurant Accessories Apparel Jewelry Toys and baby supplies Household supplies Skin care and makeup Home and furniture Sports and outdoors Home improvement, garden Kitchen and dining Decrease Stay the same Increase 16 15 15 15 21 23 23 15 16 17 22 24 21 25 24 19 30 21 35 41 37 28 34 34 37 42 37 38 32 34 36 39 32 47 31 33 Consumer electronics Out-of-home entertainment Adventures and tours Pet food and supplies Vitamins and OTC medicine Entertainment at home Books/magazines/newspapers Pet care services Hotel/resort stays Fitness and wellness Personal-care services Gasoline Vehicles Short-term home rentals Travel by car Cruises International flights Domestic flights Net intent2 22 13 13 11 14 27 21 21 10 15 13 8 28 2 25 11 1. Q: Over the next 2–3 months, do you expect that you will spend more, about the same, or less money on these categories than usual? Figures may not sum to 100% because of rounding. 2. Net intent is calculated by subtracting the % of respondents stating they expect to decrease spending from the % of respondents stating they expect to increase spending. Expected spending per category over the next 2–3 months vs usual1 % of respondents −18 +26 -6 +1 +1 +1 +2 -2 +11 -3 +3 -4 -3 +5 +3 +4 +10 -1 Change since Oct 2021 Change since Oct 2021 19 +4 -9 +2 +5 +8 +1 +2 -1 +7 +4 -2 +10 +5 +15 0 +22 +6 12 +11 Net intent2 8 20 11 26 3 14 8 5 7 4 0 7 −5 22 20 16 17 19 Positive spend impact | Current as of March 2022
  • 20. McKinsey & Company 20 Vaccinated respondents plan to increase their discretionary spending more than those unlikely to get vaccinated ​Source: McKinsey & Company COVID-19 India Consumer Pulse Survey, 3/11–3/24/2022, n = 1,009, sampled and weighted to match the India general population 18+ years 1. Net intent is calculated by subtracting the % of respondents stating they expect to decrease spending from the % of respondents stating they expect to increase spending. 2. Q: Over the next 2–3 months, do you expect that you will spend more, about the same, or less money on these categories than usual? +2 percentage points Likelihood of vaccinated vs unvaccinated people to spend For selected categories Net intent1 for expected spending per category over the next 2-3 months vs usual2 Unlikely Cautious Interested Vaccinated Groceries Food takeout and delivery Restaurant Quick-service restaurant Vitamins and supplements Skin care and makeup Personal-care services Apparel Consumer electronics International flights 45 −13 −23 −34 26 −7 14 −20 −59 0 47 9 5 20 35 38 −13 −6 11 48 21 29 20 7 −3 42 30 −5 11 69 20 7 4 7 26 19 22 7 14 27 Between −3 and +3 < −3 > +3 Positive spend impact | Current as of March 2022
  • 21. McKinsey & Company 21 Among consumers who intend to spend more, roughly 30 percent say it is to get premium products, and about 25 percent say it is because prices are higher ​Source: McKinsey & Company COVID-19 India Consumer Pulse Survey, 3/11–3/24/2022, n = 1,009, sampled and weighted to match the India general population 18+ years 20 16 17 13 25 11 12 17 12 16 15 14 14 25 15 9 12 15 25 27 38 30 24 32 31 38 24 24 25 28 21 25 25 25 26 24 20 31 26 32 23 29 35 22 39 30 34 32 39 28 32 29 37 34 35 26 20 25 27 28 22 23 25 29 27 26 26 21 28 37 25 27 Household supplies Meals at restaurants Groceries Pet care services Pet food and supplies Food takeout/delivery Vitamins and supplements Meals at quick-serve rest Vehicles Personal-care products Apparel Footwear Accessories Consumer electronics Home and decoration Kitchen and dining Skin care and makeup Personal-care services Increase in income Increase in price Larger quantity Premium brands/products 1. Q: Please indicate the main reason for planning to spend more on the following categories. Reasons for increase in spend1 % of respondents who increased spend Positive spend impact | Current as of March 2022
  • 22. McKinsey & Company 22 Among consumers intending to spend less, roughly 35 percent are value seekers, and about 30 percent are variety seekers ​Source: McKinsey & Company COVID-19 India Consumer Pulse Survey, 3/11–3/24/2022, n = 1,009, sampled and weighted to match the India general population 18+ years 26 22 15 16 8 15 15 20 8 20 16 9 17 14 18 19 16 14 45 35 39 33 39 27 30 32 38 38 32 28 34 43 36 36 26 32 18 27 23 27 36 42 39 25 29 23 26 34 28 19 20 22 32 23 6 12 21 22 12 12 16 16 20 17 21 25 18 22 20 18 23 27 6 3 1 2 5 4 7 5 2 5 4 3 2 5 5 3 4 1 Meals at restaurants Household supplies Groceries Pet food and supplies Food takeout/delivery Meals at quick-serve rest Personal-care products Pet care services Vitamins and supplements Apparel Footwear Accessories Consumer electronics Vehicles Home and decoration Kitchen and dining Skin care and makeup Personal-care services Decrease in income Switch to less expensive Smaller quantity Spend more on other categories Reduced price 1. Q: Please indicate the main reason for planning to spend less on the following categories. Reasons for decrease in spend1 % of respondents who decreased spend Positive spend impact | Current as of March 2022
  • 23. McKinsey & Company 23 41 33 36 24 28 22 20 June 2020 Mar 2022 Oct 2021 Feb 2021 Sep 2020 Nov 2020 May 2020 Overall 23 42 Vaccinated Unvaccinated Gen Z Millennials 38 46 Gen X 39 Baby boomers3 46 41 High (>2M rupees) Low (<500,000 rupees) 57 37 Medium (500,000–2M rupees) 1. Q: Which best describes when you will regularly return to stores, restaurants, and other out-of-home activities? Chart shows those already participating in these activities. 2. Gen Z are people under 25 years old, millennials are 25–44 years old, Gen X are people 45–54 years old, baby boomers are 55 years old and above. 3. Baby boomers includes silent generation. By generation2 By vaccination adoption By income ~46% of Gen X and baby boomers are doing out- of-home activities ~57% of higher-income households are doing out-of-home activities ~42% of people who are vaccinated are doing out-of-home activities Consumers engaging in out-of-home activities,1 % of respondents Source: McKinsey & Company COVID-19 India Consumer Pulse Survey, 3/11–3/24/2022, n = 1,009; 10/18–10/25/2021, n = 1,002; 2/18–2/28/2021, n = 1,019; 11/9–11/20/2020, n = 1,091; 9/18–9/27/2020, n = 1,051; 6/19–6/22/2020, n = 624; 5/22–5/25/2020, n = 614; 5/1–5/4/2020, n = 648; 4/10–4/13/2020, n = 631; 4/3–4/6/2020, n = 601; 3/27–3/30/2020, n = 582, sampled and weighted to match the India’s general population 18+ years Home economy is pervasive | Current as of March 2022 More Indian consumers say they are engaging in out-of-home activities, led by higher-income households and older generations
  • 24. McKinsey & Company 24 Out-of-home activities currently engaged in1 % of respondents who say they are doing this in the same or a modified way 1. Q: Which best describes how you are engaging in each of these activities? ? Possible answers: “Not doing this all”; “Doing this in the same way as pre-COVID-19, but less often”; “Doing this in a modified way vs. pre-COVID-19”; “Doing this just as much and in the same way as I did pre-COVID-19.” Social Personal care Entertain- ment 88 76 78 77 78 89 88 89 86 Attend an outdoor event Dine indoors at a restaurant or bar Go out for family entertainment Attend an indoor cultural event Visit a crowded outdoor public place Go to a hair or nail salon Go to the gym or fitness studio Get together with family Get together with friends 90 96 91 89 93 84 89 86 81 82 86 Travel more than 2 hours by car Use public transportation Work outside my home Shop for groceries/necessities Shop for non-necessities Go to a shopping mall Use a ride-sharing service Travel by airplane Travel by train Stay in a hotel Rent a short-term home Work Shopping Transport/ travel 21 31 20 29 30 29 54 42 46 36 44 36 38 41 31 35 37 28 33 30 80% and above Less than 80% Change >10 pp Change from Oct 2021, percentage points Change from Oct 2021, percentage points Consumers increased all out-of-home activities since October 2021, with the biggest increase occurring in travel and entertainment ​Source: McKinsey & Company COVID-19 India Consumer Pulse Survey, 3/1–3/24/2022, n = 1,009; 10/18–10/25/2021, n = 1,002; 2/18–2/28/2021, n = 1,019, sampled and weighted to match the India general population 18+ years Home economy is pervasive | Current as of March 2022
  • 25. McKinsey & Company 25 1. Q: With the rise of the omicron variant of COVID-19, how, if at all, has your out-of-home behavior changed? ​Source: McKinsey & Company COVID-19 India Consumer Pulse Survey, 3/11–3/24/2022, n = 1,009, sampled and weighted to match the India general population 18+ years 8 12 14 9 51 42 32 32 39 51 High (>2M rupees) 4 Medium (500,000–2M rupees) Low (<500,000 rupees) 4 11 13 21 44 41 39 28 4 Vaccinated Unvaccinated 13 44 38 Engage less 5 Engage more Overall Engage with adjusted behavior Engage same as before omicron By income By vaccination status More than half of lower-income consumers have adjusted their behavior when going out, whereas higher-income consumers are engaging less Vaccinated consumers are more cautious than the unvaccinated population Key findings Adjustments to out-of-home behavior due to prevalence of omicron variant,1 % of respondents About 45 percent of consumers have changed the way they engage in out-of-home activities because of the omicron variant Home economy is pervasive | Current as of March 2022
  • 26. McKinsey & Company 26 1. Q: Which best describes how you are engaging in each of these activities? Possible answers: “Not doing this at all”; “Doing this in the same way as pre-COVID-19, but less often”; “Doing this in a modified way vs. pre-COVID-19”; “Doing this just as much and in the same way as I did pre-COVID-19.” Work Shopping Transport/ travel Social Personal care Entertain- ment Go out for family entertainment 75 25 27 79 ​Dine indoors at a restaurant or bar 21 73 Attend an outdoor event 26 74 Visit a crowded outdoor public place 27 73 Attend an indoor cultural event 25 75 Go to a hair or nail salon 33 24 67 Get together with friends 27 Go to the gym or fitness studio 73 76 Get together with family 79 24 78 73 Work outside my home 24 22 76 Go to a shopping mall Shop for groceries/necessities Shop for non-necessities 76 21 Stay in a hotel 76 24 27 25 Travel by train Rent a short-term home 78 25 75 Travel more than 2 hours by car 22 24 78 ​Use a ride-sharing service 75 Use public transportation Travel by airplane 22 76 Doing less, doing in a modified way Doing as much as and in the same way as pre-COVID-19 Out-of-home activities engagement,1 % of respondents having engaged in activity pre-COVID-19 Around 70 percent of consumers have modified their behavior when out of home across all categories ​Source: McKinsey & Company COVID-19 India Consumer Pulse Survey, 3/11–3/24/2022, n = 1,009, sampled and weighted to match the India general population 18+ years Home economy is pervasive | Current as of March 2022
  • 27. McKinsey & Company 27 Main life events done in the last 12 months as a result of COVID-19,1 % of respondents Change >3 pp 64 22 20 35 26 20 18 10 10 12 12 Moved into a bigger home Decided to change jobs Renovated/remodeled my home Worked more from home Started homeschooling children Set up a specific work-from-home space Set up a gym at home Got a new pet at home (eg, dog, cat) Moved into a smaller home Bought a property Sold a property Work/study change Mar 2022 Pet adoption House move Home renovation Investments/ divestments Total,2 % Change from Oct 2021, percentage points −2 1 −1 2 1 0 3 0 2 1 1 18 78 20 57 21 1. Q: Which of the following have you done in the last 12 months as a result of the COVID-19 crisis? 2. Total percentage of people who choose option(s) in the category. Even though consumers have increased out-of-home activity, they continue to invest in their home environment ​Source: McKinsey & Company COVID-19 India Consumer Pulse Survey, 3/11–3/24/2022, n = 1,009, sampled and weighted to match the India general population 18+ years Home economy is pervasive | Current as of March 2022
  • 28. McKinsey & Company 28 Milestones for the India population not yet engaging with out-of-home activities1 % of respondents awaiting each milestone before engaging 25 30 24 22 Government lifts restrictions Government lifts restrictions and other requirements Vaccination coverage COVID-19 no longer spreading 59% of people are not currently engaging in ‘normal’ out-of- home activities ​Source: McKinsey & Company COVID-19 India Consumer Pulse Survey, 3/11–3/24/2022, n = 1,009, sampled and weighted to match the India general population 18+ years Vaccination coverage Government lifts restrictions and … 1. Q: Which best describes when you will regularly return to stores, restaurants, and other out-of-home activities? Chart rebased to exclude those already participating in these activities and those who do not deem any of these items important. Figures may not sum to 100% because of rounding. 9% Medical authorities deem safe 12% Stores, restaurants, and other indoor places start taking safety measures 8% I see other people returning 8% Vaccine is widely distributed 9% I have been vaccinated 7% Family member(s) vaccinated Around 60 percent of consumers are cautious about returning to out-of-home activities until social restrictions are completely lifted Home economy is pervasive | Current as of March 2022
  • 29. McKinsey & Company 29 97 64 60 59 53 45 41 Different brand Any new shopping behavior Different retailer/store/website Private label/store brand New social-commerce method New shopping method3 New digital shopping method ​Source: McKinsey & Company COVID-19 India Consumer Pulse Survey, 3/11–3/24/2022, n = 1,009; 10/18–10/25/2021, n = 1,002; 2/18–2/28/2021, n = 1,019 sampled and weighted to match the India general population 18+ years 91 N/A 85 8 81 8 81 9 High (>2M rupees) Gen Z Millennials 98 99 98 60 87 11 67 63 61 60 58 61 67 62 62 55 57 53 41 41 Income cut Generational cut All consumers % of respondents Change from Oct 2021, percentage points Intent to continue behavior2 Between −3 and +3 < −3 > +3 1. Q: Over the past 3 months, which of the following have you done? 3% replied “None of these” 2. Q: Which best describes whether or not you plan to continue with these shopping changes? Possible answers: “will go back to what I did before 3 months ago”; ”will keep doing both this and what I did before 3 months ago”; ”will keep doing this and NOT go back to what I did before 3 months ago.” Intent to continue includes respondents who selected “will keep doing both this and what I did before 3 months ago” and “will keep doing this and NOT go back to what I did before 3 months ago.” 3. “New shopping method” includes curbside pickup and delivery apps. Behaviors since COVID-19 pandemic started1 % of respondents Consumers have tried new shopping behaviors, including new retailers and brands, during the COVID-19 pandemic Difference from all respondents, percentage points 86 10 47 56 44 Loyalty shakeup continues | Current as of March 2022
  • 30. McKinsey & Company 30 1. Q: Over the last 3 months, have you wanted to buy something and not been able to purchase it because it was out of stock or otherwise not available? 2. Q: The most recent time this happened (when you wanted to buy something and it was not available), what did you do? ​Source: McKinsey & Company COVID-19 India Consumer Pulse Survey, 3/11–3/24/2022, n = 1,009, sampled and weighted to match the India general population 18+ years 23 77 Mar 2022 Could not purchase at least 1 item Able to purchase all items Respondents who planned to purchase something but could not, due to unavailability1 % of respondents 29 25 23 18 5 Bought the product at a different retailer Bought a different brand or similar product at a different retailer Waited until the product was available at the same retailer Did not buy anything Bought a different product at the same retailer All consumers who could not make a planned purchase2 % of respondents Loyalty shakeup continues | Current as of March 2022 When products are out of stock, consumers are more likely to substitute retailers or brands than to wait for products to become available
  • 31. McKinsey & Company 31 Is available where I’m shopping Using eco-friendly ingredients Supporting local businesses Is natural/organic Better shipping/delivery cost Better prices/promotions 11 Better value Using recyclable packing materials Larger package sizes 12 Shares my values 7 The company treats its employees well 24 Products are in stock Better quality 11 32 Wanted to try a new brand I found Wanted to try a type of product I’ve never tried before Wanted variety/a change from my normal routine Wanted to treat myself Cleaner/has better hygiene measures 11 27 13 21 20 10 15 7 18 23 15 11 −1 7 0 Reason for trying a new brand since COVID-19 began,1 % of respondents selecting reason in top 3 ​Source: McKinsey & Company COVID-19 India Consumer Pulse Survey, 3/1–3/24/2022, n = 1,009, sampled and weighted to match the India general population 18+ years Personal choice Convenience Quality/organic Novelty Health/hygiene Availability Purpose driven Value 51 57 11 44 35 13 11 26 All consumers Between −3 and +3 < −3 > +3 Difference from all respondents, percentage points x Net % of respondents per category Gen Z/ millennials Baby boomers2 Gen X −3 36 −3 1 −9 0 −1 8 1 3 −12 −3 0 0 −1 −1 1 1 1 −10 −1 2 −7 −2 0 3 −2 −4 10 7 −3 6 5 −2 11 1 0 −3 1 2 −6 −4 0 −9 1 1. Q: You mentioned you tried a new/different brand than what you normally buy. What were the main reasons that drove this decision? Select up to 3 relevant reasons. “Brand” includes different brand, new private label/store brand. Overarching reason based on % of individual respondents responding to at least 1 reason in the group. 2. Baby boomers includes silent generation. Loyalty shakeup continues | Current as of March 2022 The top reasons consumers give for switching brands are to attain greater value and better quality −9 2 0 2 −8 −4