1. Chapter – 11 Notes Research Methods (KJAN) Summer Quarter 2014
1
Quantitative Data Analysis
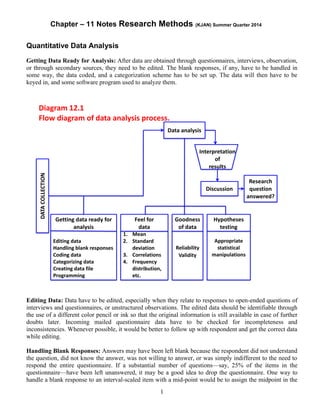
Getting Data Ready for Analysis: After data are obtained through questionnaires, interviews, observation,
or through secondary sources, they need to be edited. The blank responses, if any, have to be handled in
some way, the data coded, and a categorization scheme has to be set up. The data will then have to be
keyed in, and some software program used to analyze them.
Editing Data: Data have to be edited, especially when they relate to responses to open-ended questions of
interviews and questionnaires, or unstructured observations. The edited data should be identifiable through
the use of a different color pencil or ink so that the original information is still available in case of further
doubts later. Incoming mailed questionnaire data have to be checked for incompleteness and
inconsistencies. Whenever possible, it would be better to follow up with respondent and get the correct data
while editing.
Handling Blank Responses: Answers may have been left blank because the respondent did not understand
the question, did not know the answer, was not willing to answer, or was simply indifferent to the need to
respond the entire questionnaire. If a substantial number of questions—say, 25% of the items in the
questionnaire—have been left unanswered, it may be a good idea to drop the questionnaire. One way to
handle a blank response to an interval-scaled item with a mid-point would be to assign the midpoint in the
2. Chapter – 11 Notes Research Methods (KJAN) Summer Quarter 2014
2
scale as the response to that particular item. An alternative way is to allow the computer to ignore the blank
responses when the analyses are done.
Coding: The next step is to code the responses. Scanner sheets facilitate the entry of the responses directly
into the computer without manual keying in of the data. Also one may use a coding sheet first to transcribe
the data from the questionnaire and then key in the data.
Categorization: At this point it is useful to set up a scheme for categorizing the variables such that the
several items measuring a concept are all grouped together. Responses to some of the negatively worded
questions have also to be reversed so that all answers are in the same direction.
Entering Data: If questionnaire data are not collected on scanner answer sheets, which can be directly
entered into the computer as a data file, the raw data will have to be manually keyed into the computer.
Raw data can be entered through any software program. For instance, the SPSS Data Editor, which looks
like a spread sheet, can enter, edit, and view the contents of the data file.
Data Analysis
Basic Objectives in Data Analysis: In data analysis we have three objectives: (i) getting a feel for the data,
(ii) testing the goodness of data, and (iii) testing the hypotheses developed for the research. The feel for the
data will give preliminary ideas of how good the scales are, how well the coding and entering of data have
been done, and so on. The second objective—testing the goodness of data—can be accomplished by
submitting the data for factor analysis, obtaining the Cronbach’s alpha or the split-half reliability of the
measures, and so on. The third objective—hypotheses testing –is achieved by choosing the appropriate
menus of the software programs, to test each of the hypotheses using the relevant statistical test. The results
of these tests will determine whether or not the hypotheses are substantiated.
Feel for the Data: We can acquire a feel for the data by checking the central tendency and the dispersion.
The mean, the range, the standard deviation, and the variance in the data will give the researcher a good
idea of how the respondents have reacted to the items in the questionnaire and how good the items and
measures are. The maximum and minimum scores, mean, standard deviation, variance, and other statistics
can be easily obtained, and these will indicate whether the responses range satisfactorily over the scale.
A frequency distribution of the nominal variables of interest should be obtained. Visual displays thereof
through histogram/bar charts, and so on, can also be provided through programs that generate charts.
Testing Goodness of Data
Reliability: The reliability of a measure is established by testing for both consistency and stability.
Consistency indicates how well the items measuring a concept hang together as a set. Cronbach’s alpha is
a reliability coefficient that indicates how well the items in a set are positively correlated to one another.
Cronbach’s alpha is computed in terms of the average inter-correlations among the items measuring the
concept. The closer Cronbach’s alpha is to 1, the higher the internal consistency reliability. Another
measure of consistency reliability used in specific situations is the split-half reliability coefficient. Since
this reflects the correlations between two halves of a set of items, the coefficients obtained will vary
depending on how the scale is split. Sometimes split-half reliability is obtained to test for consistency when
more than one scale, dimension, or factor, is assessed. The stability of measures can be assessed through
parallel form reliability and test-retest reliability. When a high correlation between two similar forms of
a measure is obtained, parallel form reliability is established. Test-retest reliability can be established by
computing the correlation between the same tests administered at two different time periods.
3. Chapter – 11 Notes Research Methods (KJAN) Summer Quarter 2014
3
Validity: Factorial validity can be established by submitting the data for factor analysis. The results of
factor analysis (a multivariate technique) will confirm whether or not the theorized dimensions emerge.
Factor analysis would reveal whether the dimensions are indeed tapped by the items in the measure, as
theorized. Criterion-related validity can be established by testing for the power of the measure to
differentiate individuals who are known to be different.
Convergent validity can be established when there is high degree of correlation between two different
sources responding to the same measure (e.g., both supervisors and subordinates respond similarly to a
perceived reward system measure administered to them). Discriminant validity can be established when
two distinctly different concepts are not correlated to each other (as, for example courage and honesty;
leadership and motivation; attitudes and behavior.)
Hypothesis Testing: Once the data are ready for analysis, (i.e., out-of-range/missing responses, etc., are
cleaned up, and the goodness of the measures is established), the researcher is ready to test the hypotheses
already developed for the study. In the Module at the end of the text book, the statistical tests that would be
appropriate for different hypotheses and for data obtained on different scales are discussed.
Data Analysis and Interpretation: Data analysis and interpretation of results can be best understood by
referring to an example of a business research project. Please see Data Analysis discussion of Excelsior
Enterprises in the text book from Page 309-322.
Some Software Packages Useful for Data Analysis
SPSS Software Packages: SPSS has software programs that can create surveys (questionnaire design)
through the SPSS Data Entry Builder, collect data over the Internet or Intranet through the SPSS Data
Entry Enterprises Server, enter the collected data through the SPSS Data Entry Station, and SPSS 11.0 to
analyze the data collected.
Various Other Software Programs:
http://www.asc.org.uk/Register/ShowPackage.asp?ID=162
Go to the Internet and explore and the subsequent IDs it indicates. It shows variety of software programs
with a wide range of capabilities. A few of these are:
1. Askia
2. ATLAS. ti
3. Bellview CATI
4. Brand2hand
Use of Expert Systems in Choosing the Appropriate Statistical Tests: The Expert System employs
unique programming techniques to model the decisions that experts make. A considerable body of
knowledge fed into the system and some good software and hardware help the individual using it to make
sound decisions about the problem that he or she is concerned about solving. Expert Systems relating to
data analysis help the perplexed researcher to choose the most appropriate statistical procedure for testing
different types of hypothesis. The Statistical Navigator is an Expert System that recommends one or more
statistical procedures after seeking information on the goals. The Statistical Navigator is a useful guide for
those who are well versed in statistics but want to ensure that they use the appropriate statistical techniques.