SlideShare ist ein Scribd-Unternehmen logo
1 von 5
Downloaden Sie, um offline zu lesen
Marilyn Gellert
Ashley Linstra
Case 2.7
A.
MaleFemale
180
160
140
120
100
80
60
40
20
0
Gender
Numberofbackpainpatients
Gender Chart
746760534639322518
35
30
25
20
15
10
5
0
Age
Numberofpatients
Histogram of Age
1751501251007550250
LostDays
Dotplot of LostDays
Each symbol represents up to 6 observations.
300025002000150010005000
Cost
Boxplot of Cost
B. From the Gender Chart above we can see that more men than woman have back pain. About 60 more
men than woman are shown from the bar graph.
In the histogram above we can see that there are about 3 outliers around the age of 70-74 years of age.
Also, the ages between 30-34 had the most people with back problems.
The dot plot graph shows the number of lost days from the patients. This graph is skewed to the right.
Making the mean greater than the median. Many didn't lose any days of work. On the other hand, there
are three outliers that lie on 60, 120, and 179 lost days.
The box plot graph represents the cost of treatment for the back. Again we see a graph this is skewed to
the right, the mean is greater than the median. Many of the patient’s costs are between 0-750 dollars.
But, we can see many outliers. The highest outlier is about 2790 dollars.
C. Descriptive Statistics: Age
Variable Mean Minimum Median Maximum Range
Age 39.817 17.000 39.000 74.000 57.000
The mean age for patients with back pain is 39.817 years. The median is 39 years of age. These numbers
are close in range so either of these would be considered an accurate average.
D. Descriptive Statistics: Age
Variable Gender Mean Minimum Median Maximum Range
Age Female 38.45 22.00 37.50 74.00 52.00
Male 40.653 17.000 40.000 72.000 55.000
The mean for females is 38.45 years and 40.653 years for men. The median age for women is 37.5 years
and for men it is 40 years. Either the mean or the median would be an accurate average since they are
similar.
E. Descriptive Statistics: Cost
Variable Mean Minimum Median Maximum Range
Cost 388.4 0.0 166.0 2758.0 2758.0
When I computed the "average" cost of treatment I realized that there is a major difference between
the mean and the median. One reason this happens because of the couple outliers that we have. These
outliers make the mean go up by a substantial amount. So in this set of information I would use the
median number instead of the mean to compute the “average”.
F. Descriptive Statistics: Treatment
Average Cost of Treatment for Back Pain by Gender
Variable Gender Mean Minimum Median Maximum Mode
Cost Female 390.1 0.0 161.0 2758.0 1
Male 387.4 0.0 173.0 2094.0 1
This information shows that the mean cost for the treatment of back pain was more for women than
men, however the median cost for women was less than men. From the table it can be seen that the
maximum cost for women was higher than the men’s, therefore the mean was skewed to the right by
outlying values.
G. Descriptive Statistics: Days Lost
Average Number of Work Days Lost Due to Back Pain
Variable Mean Minimum Median Maximum Mode
LostDays 3.939 0.000 1.000 180.000 0
From the data presented in this chart it can be concluded that most patients who received treatment for
their back pain did not lose any days of work. This can be confirmed by the mode, which is 0. The
maximum of 180 days lost skewed the mean to the right. The median is only 1 while the mean in 3.939,
hence it was affected by outliers.
H. Descriptive Statistics: Days Lost
Average Days Lost Due to Back Pain by Gender
Variable Gender Mean Minimum Median Maximum Mode
LostDays Female 4.70 0.00 1.00 114.00 0
Male 3.47 0.00 1.00 180.00 0
The figures above show that the mean number of days lost by women is higher than men, however the
median of the two is the same, and the maximum number of days is less for women than man. This can
be triggered by the number of outliers. There are greater number of outliers in days lost by women than
outliers for men. The only outlier for days lost by men is the maximum, 180 days.
I. Descriptive Statistics:
Variable StDev Variance Range
Age 11.247 126.502 57.000
LostDays 14.113 199.173 180.000
Cost 530.6 281492.5 2758.0
The standard deviation, variance, and range is given for the age of the patients with back pain, the
numbers of days they have lost due to the back pain, and the cost of their treatment.
J. Descriptive Statistics:
Variable Gender StDev Variance Range
Age Female 11.30 127.70 52.00
Male 11.165 124.658 55.000
LostDays Female 13.68 187.01 114.00
Male 14.39 207.18 180.00
Cost Female 562.4 316281.1 2758.0
Male 511.8 261889.2 2094.0
The standard deviation, variance, and range is given by gender for the age of the patients with back
pain, the numbers of days they have lost due to the back pain, and the cost of their treatment.
K. Summary:
More men have been treated for back pain than women. Back pain can occur at any age, however the
average age is 39. On average women received treatment 2 or three years prior to men. The cost for
treatment can range for $0 to $2758 where the mean was $388.40 per person. There was not much of a
difference in cost of treatment for men and women. Most men and women did not lose any days of work
due to their back pain, nevertheless there was several outliers for both men and women. The most days
lost by a woman was 114 days and the most days lost by a man was 180 days.
Marilyn did a-e
Ashley did f-j
we worked on the summary together

Weitere ähnliche Inhalte

Ähnlich wie Prob ^0 Stats Proj 1

Determination and Analysis of Sample size
Determination and Analysis of Sample sizeDetermination and Analysis of Sample size
Determination and Analysis of Sample sizeSudipto Krishna Dutta
 
Wound care in the Physical Therapy Private Practice Outpatient Sector: A busi...
Wound care in the Physical Therapy Private Practice Outpatient Sector: A busi...Wound care in the Physical Therapy Private Practice Outpatient Sector: A busi...
Wound care in the Physical Therapy Private Practice Outpatient Sector: A busi...Michelle Stauffer
 
Multiple Linear Regression Homework Help
Multiple Linear Regression Homework HelpMultiple Linear Regression Homework Help
Multiple Linear Regression Homework HelpExcel Homework Help
 
Confidence Intervals in the Life Sciences PresentationNamesS.docx
Confidence Intervals in the Life Sciences PresentationNamesS.docxConfidence Intervals in the Life Sciences PresentationNamesS.docx
Confidence Intervals in the Life Sciences PresentationNamesS.docxmaxinesmith73660
 
Running Head SCENARIO NCLEX MEMORIAL HOSPITAL .docx
Running Head SCENARIO NCLEX MEMORIAL HOSPITAL                    .docxRunning Head SCENARIO NCLEX MEMORIAL HOSPITAL                    .docx
Running Head SCENARIO NCLEX MEMORIAL HOSPITAL .docxtoltonkendal
 
Statistics and Public Health. Curso de Inglés Técnico para profesionales de S...
Statistics and Public Health. Curso de Inglés Técnico para profesionales de S...Statistics and Public Health. Curso de Inglés Técnico para profesionales de S...
Statistics and Public Health. Curso de Inglés Técnico para profesionales de S...Universidad Particular de Loja
 
Categorical data analysis
Categorical data analysisCategorical data analysis
Categorical data analysisSumit Das
 
Statistics introduction
Statistics introductionStatistics introduction
Statistics introductionvajira54
 
LifeExpectancyInAmerica
LifeExpectancyInAmericaLifeExpectancyInAmerica
LifeExpectancyInAmericaAkhil Raman
 
Introduction to Biostatistics.pptx
Introduction to Biostatistics.pptxIntroduction to Biostatistics.pptx
Introduction to Biostatistics.pptxmarriamjaved4
 
Introduction to medical statistics
Introduction to medical statistics Introduction to medical statistics
Introduction to medical statistics Mohamed Alhelaly
 
This is a 2-hour timed closed book exam. You can use a calculator
This is a 2-hour timed closed book exam. You can use a calculator This is a 2-hour timed closed book exam. You can use a calculator
This is a 2-hour timed closed book exam. You can use a calculator GrazynaBroyles24
 
Hcai 5220 lecture notes on campus sessions fall 11(2)
Hcai 5220 lecture notes on campus sessions fall 11(2)Hcai 5220 lecture notes on campus sessions fall 11(2)
Hcai 5220 lecture notes on campus sessions fall 11(2)Twene Peter
 
Excelsior College PBH 321 Page 1 CONFOUNDING .docx
Excelsior College PBH 321   Page 1 CONFOUNDING  .docxExcelsior College PBH 321   Page 1 CONFOUNDING  .docx
Excelsior College PBH 321 Page 1 CONFOUNDING .docxgitagrimston
 

Ähnlich wie Prob ^0 Stats Proj 1 (20)

Determination and Analysis of Sample size
Determination and Analysis of Sample sizeDetermination and Analysis of Sample size
Determination and Analysis of Sample size
 
Chi sq explanation
Chi sq explanationChi sq explanation
Chi sq explanation
 
Multiple Linear Regression Homework Help
Multiple Linear Regression Homework HelpMultiple Linear Regression Homework Help
Multiple Linear Regression Homework Help
 
Ia final report
Ia final reportIa final report
Ia final report
 
Wound care in the Physical Therapy Private Practice Outpatient Sector: A busi...
Wound care in the Physical Therapy Private Practice Outpatient Sector: A busi...Wound care in the Physical Therapy Private Practice Outpatient Sector: A busi...
Wound care in the Physical Therapy Private Practice Outpatient Sector: A busi...
 
Multiple Linear Regression Homework Help
Multiple Linear Regression Homework HelpMultiple Linear Regression Homework Help
Multiple Linear Regression Homework Help
 
Two sample t-test
Two sample t-testTwo sample t-test
Two sample t-test
 
Confidence Intervals in the Life Sciences PresentationNamesS.docx
Confidence Intervals in the Life Sciences PresentationNamesS.docxConfidence Intervals in the Life Sciences PresentationNamesS.docx
Confidence Intervals in the Life Sciences PresentationNamesS.docx
 
Running Head SCENARIO NCLEX MEMORIAL HOSPITAL .docx
Running Head SCENARIO NCLEX MEMORIAL HOSPITAL                    .docxRunning Head SCENARIO NCLEX MEMORIAL HOSPITAL                    .docx
Running Head SCENARIO NCLEX MEMORIAL HOSPITAL .docx
 
Statistics and Public Health. Curso de Inglés Técnico para profesionales de S...
Statistics and Public Health. Curso de Inglés Técnico para profesionales de S...Statistics and Public Health. Curso de Inglés Técnico para profesionales de S...
Statistics and Public Health. Curso de Inglés Técnico para profesionales de S...
 
Categorical data analysis
Categorical data analysisCategorical data analysis
Categorical data analysis
 
Statistics introduction
Statistics introductionStatistics introduction
Statistics introduction
 
LifeExpectancyInAmerica
LifeExpectancyInAmericaLifeExpectancyInAmerica
LifeExpectancyInAmerica
 
Introduction to Biostatistics.pptx
Introduction to Biostatistics.pptxIntroduction to Biostatistics.pptx
Introduction to Biostatistics.pptx
 
Introduction to medical statistics
Introduction to medical statistics Introduction to medical statistics
Introduction to medical statistics
 
This is a 2-hour timed closed book exam. You can use a calculator
This is a 2-hour timed closed book exam. You can use a calculator This is a 2-hour timed closed book exam. You can use a calculator
This is a 2-hour timed closed book exam. You can use a calculator
 
05inference_2011.ppt
05inference_2011.ppt05inference_2011.ppt
05inference_2011.ppt
 
Stat 350 project erickson
Stat 350 project ericksonStat 350 project erickson
Stat 350 project erickson
 
Hcai 5220 lecture notes on campus sessions fall 11(2)
Hcai 5220 lecture notes on campus sessions fall 11(2)Hcai 5220 lecture notes on campus sessions fall 11(2)
Hcai 5220 lecture notes on campus sessions fall 11(2)
 
Excelsior College PBH 321 Page 1 CONFOUNDING .docx
Excelsior College PBH 321   Page 1 CONFOUNDING  .docxExcelsior College PBH 321   Page 1 CONFOUNDING  .docx
Excelsior College PBH 321 Page 1 CONFOUNDING .docx
 

Prob ^0 Stats Proj 1

  • 1. Marilyn Gellert Ashley Linstra Case 2.7 A. MaleFemale 180 160 140 120 100 80 60 40 20 0 Gender Numberofbackpainpatients Gender Chart 746760534639322518 35 30 25 20 15 10 5 0 Age Numberofpatients Histogram of Age
  • 2. 1751501251007550250 LostDays Dotplot of LostDays Each symbol represents up to 6 observations. 300025002000150010005000 Cost Boxplot of Cost
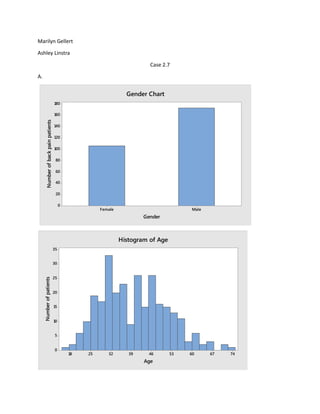
  • 3. B. From the Gender Chart above we can see that more men than woman have back pain. About 60 more men than woman are shown from the bar graph. In the histogram above we can see that there are about 3 outliers around the age of 70-74 years of age. Also, the ages between 30-34 had the most people with back problems. The dot plot graph shows the number of lost days from the patients. This graph is skewed to the right. Making the mean greater than the median. Many didn't lose any days of work. On the other hand, there are three outliers that lie on 60, 120, and 179 lost days. The box plot graph represents the cost of treatment for the back. Again we see a graph this is skewed to the right, the mean is greater than the median. Many of the patient’s costs are between 0-750 dollars. But, we can see many outliers. The highest outlier is about 2790 dollars. C. Descriptive Statistics: Age Variable Mean Minimum Median Maximum Range Age 39.817 17.000 39.000 74.000 57.000 The mean age for patients with back pain is 39.817 years. The median is 39 years of age. These numbers are close in range so either of these would be considered an accurate average. D. Descriptive Statistics: Age Variable Gender Mean Minimum Median Maximum Range Age Female 38.45 22.00 37.50 74.00 52.00 Male 40.653 17.000 40.000 72.000 55.000 The mean for females is 38.45 years and 40.653 years for men. The median age for women is 37.5 years and for men it is 40 years. Either the mean or the median would be an accurate average since they are similar. E. Descriptive Statistics: Cost Variable Mean Minimum Median Maximum Range Cost 388.4 0.0 166.0 2758.0 2758.0 When I computed the "average" cost of treatment I realized that there is a major difference between the mean and the median. One reason this happens because of the couple outliers that we have. These outliers make the mean go up by a substantial amount. So in this set of information I would use the median number instead of the mean to compute the “average”.
  • 4. F. Descriptive Statistics: Treatment Average Cost of Treatment for Back Pain by Gender Variable Gender Mean Minimum Median Maximum Mode Cost Female 390.1 0.0 161.0 2758.0 1 Male 387.4 0.0 173.0 2094.0 1 This information shows that the mean cost for the treatment of back pain was more for women than men, however the median cost for women was less than men. From the table it can be seen that the maximum cost for women was higher than the men’s, therefore the mean was skewed to the right by outlying values. G. Descriptive Statistics: Days Lost Average Number of Work Days Lost Due to Back Pain Variable Mean Minimum Median Maximum Mode LostDays 3.939 0.000 1.000 180.000 0 From the data presented in this chart it can be concluded that most patients who received treatment for their back pain did not lose any days of work. This can be confirmed by the mode, which is 0. The maximum of 180 days lost skewed the mean to the right. The median is only 1 while the mean in 3.939, hence it was affected by outliers. H. Descriptive Statistics: Days Lost Average Days Lost Due to Back Pain by Gender Variable Gender Mean Minimum Median Maximum Mode LostDays Female 4.70 0.00 1.00 114.00 0 Male 3.47 0.00 1.00 180.00 0 The figures above show that the mean number of days lost by women is higher than men, however the median of the two is the same, and the maximum number of days is less for women than man. This can be triggered by the number of outliers. There are greater number of outliers in days lost by women than outliers for men. The only outlier for days lost by men is the maximum, 180 days. I. Descriptive Statistics: Variable StDev Variance Range Age 11.247 126.502 57.000 LostDays 14.113 199.173 180.000 Cost 530.6 281492.5 2758.0 The standard deviation, variance, and range is given for the age of the patients with back pain, the numbers of days they have lost due to the back pain, and the cost of their treatment.
  • 5. J. Descriptive Statistics: Variable Gender StDev Variance Range Age Female 11.30 127.70 52.00 Male 11.165 124.658 55.000 LostDays Female 13.68 187.01 114.00 Male 14.39 207.18 180.00 Cost Female 562.4 316281.1 2758.0 Male 511.8 261889.2 2094.0 The standard deviation, variance, and range is given by gender for the age of the patients with back pain, the numbers of days they have lost due to the back pain, and the cost of their treatment. K. Summary: More men have been treated for back pain than women. Back pain can occur at any age, however the average age is 39. On average women received treatment 2 or three years prior to men. The cost for treatment can range for $0 to $2758 where the mean was $388.40 per person. There was not much of a difference in cost of treatment for men and women. Most men and women did not lose any days of work due to their back pain, nevertheless there was several outliers for both men and women. The most days lost by a woman was 114 days and the most days lost by a man was 180 days. Marilyn did a-e Ashley did f-j we worked on the summary together