
Empfohlen
Weitere ähnliche Inhalte
Empfohlen
Empfohlen (20)
Gráfico tipo c maria de jesus guzman
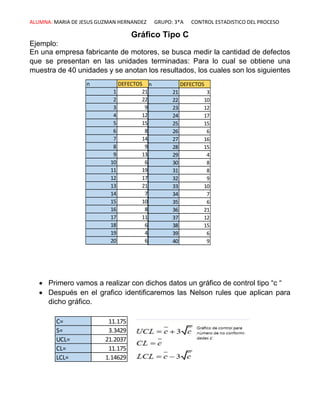
- 1. ALUMNA: MARIA DE JESUS GUZMAN HERNANDEZ GRUPO: 3*A CONTROL ESTADISTICO DEL PROCESO Gráfico Tipo C Ejemplo: En una empresa fabricante de motores, se busca medir la cantidad de defectos que se presentan en las unidades terminadas: Para lo cual se obtiene una muestra de 40 unidades y se anotan los resultados, los cuales son los siguientes Primero vamos a realizar con dichos datos un gráfico de control tipo “c “ Después en el grafico identificaremos las Nelson rules que aplican para dicho gráfico. n DEFECTOS 21 3 22 10 23 12 24 17 25 15 26 6 27 16 28 15 29 4 30 8 31 8 32 9 33 10 34 7 35 6 36 21 37 12 38 15 39 6 40 9 n DEFECTOS 1 21 2 22 3 9 4 12 5 15 6 8 7 14 8 9 9 13 10 6 11 19 12 17 13 21 14 7 15 10 16 8 17 11 18 6 19 4 20 6 C= 11.175 S= 3.3429 UCL= 21.2037 CL= 11.175 LCL= 1.14629
- 2. ALUMNA: MARIA DE JESUS GUZMAN HERNANDEZ GRUPO: 3*A CONTROL ESTADISTICO DEL PROCESO n DEFECTOS C C+1 C+2 C+3 C-1 C-2 C-3 1 21 11.175 14.5179 17.8608 21.2037 7.8321 4.4892 1.1463 2 22 11.175 14.5179 17.8608 21.2037 7.8321 4.4892 1.1463 3 9 11.175 14.5179 17.8608 21.2037 7.8321 4.4892 1.1463 4 12 11.175 14.5179 17.8608 21.2037 7.8321 4.4892 1.1463 5 15 11.175 14.5179 17.8608 21.2037 7.8321 4.4892 1.1463 6 8 11.175 14.5179 17.8608 21.2037 7.8321 4.4892 1.1463 7 14 11.175 14.5179 17.8608 21.2037 7.8321 4.4892 1.1463 8 9 11.175 14.5179 17.8608 21.2037 7.8321 4.4892 1.1463 9 13 11.175 14.5179 17.8608 21.2037 7.8321 4.4892 1.1463 10 6 11.175 14.5179 17.8608 21.2037 7.8321 4.4892 1.1463 11 19 11.175 14.5179 17.8608 21.2037 7.8321 4.4892 1.1463 12 17 11.175 14.5179 17.8608 21.2037 7.8321 4.4892 1.1463 13 21 11.175 14.5179 17.8608 21.2037 7.8321 4.4892 1.1463 14 7 11.175 14.5179 17.8608 21.2037 7.8321 4.4892 1.1463 15 10 11.175 14.5179 17.8608 21.2037 7.8321 4.4892 1.1463 16 8 11.175 14.5179 17.8608 21.2037 7.8321 4.4892 1.1463 17 11 11.175 14.5179 17.8608 21.2037 7.8321 4.4892 1.1463 18 6 11.175 14.5179 17.8608 21.2037 7.8321 4.4892 1.1463 19 4 11.175 14.5179 17.8608 21.2037 7.8321 4.4892 1.1463 20 6 11.175 14.5179 17.8608 21.2037 7.8321 4.4892 1.1463 21 3 11.175 14.5179 17.8608 21.2037 7.8321 4.4892 1.1463 22 10 11.175 14.5179 17.8608 21.2037 7.8321 4.4892 1.1463 23 12 11.175 14.5179 17.8608 21.2037 7.8321 4.4892 1.1463 24 17 11.175 14.5179 17.8608 21.2037 7.8321 4.4892 1.1463 25 15 11.175 14.5179 17.8608 21.2037 7.8321 4.4892 1.1463 26 6 11.175 14.5179 17.8608 21.2037 7.8321 4.4892 1.1463 27 16 11.175 14.5179 17.8608 21.2037 7.8321 4.4892 1.1463 28 15 11.175 14.5179 17.8608 21.2037 7.8321 4.4892 1.1463 29 4 11.175 14.5179 17.8608 21.2037 7.8321 4.4892 1.1463 30 8 11.175 14.5179 17.8608 21.2037 7.8321 4.4892 1.1463 31 8 11.175 14.5179 17.8608 21.2037 7.8321 4.4892 1.1463 32 9 11.175 14.5179 17.8608 21.2037 7.8321 4.4892 1.1463 33 10 11.175 14.5179 17.8608 21.2037 7.8321 4.4892 1.1463 34 7 11.175 14.5179 17.8608 21.2037 7.8321 4.4892 1.1463 35 6 11.175 14.5179 17.8608 21.2037 7.8321 4.4892 1.1463 36 21 11.175 14.5179 17.8608 21.2037 7.8321 4.4892 1.1463 37 12 11.175 14.5179 17.8608 21.2037 7.8321 4.4892 1.1463 38 15 11.175 14.5179 17.8608 21.2037 7.8321 4.4892 1.1463 39 6 11.175 14.5179 17.8608 21.2037 7.8321 4.4892 1.1463 40 9 11.175 14.5179 17.8608 21.2037 7.8321 4.4892 1.1463 GRAFICO DE CONTROL DE NO CONFORMIDAD
- 3. ALUMNA: MARIA DE JESUS GUZMAN HERNANDEZ GRUPO: 3*A CONTROL ESTADISTICO DEL PROCESO De esta manera con los cálculos realizados obtenemos un gráfico de control, hasta este punto nosotros podemos darnos una idea de lo que está ocurriendo en la fábrica de aluminio y podemos deducir que no existe una estabilidad en la producción de aluminio en cuanto al % de errores pero debemos concretar una información más completa es ahí conde identificar las Nelson rules nos ayudan. Rule 1: One point is more than 3 standard deviations from the mean. NELSON 1
- 4. ALUMNA: MARIA DE JESUS GUZMAN HERNANDEZ GRUPO: 3*A CONTROL ESTADISTICO DEL PROCESO Rule 2 Nine (or more) points in a row are on the same side of the mean Rule 4 Fourteen (or more) points in a row alternate in direction, increasing then decreasing RULE 2 RULE 4
- 5. ALUMNA: MARIA DE JESUS GUZMAN HERNANDEZ GRUPO: 3*A CONTROL ESTADISTICO DEL PROCESO Rule 5 Two (or three) out of three points in a row are more than 2 standard deviations from the mean in the same direction Rule 6 Four (or five) out of five points in a row are more than 1 standard deviation from the mean in the same direction. RULE 5 RULE 6