October 2011 Market Report for Zip 19151
•
0 gefällt mir•304 views

The document provides a market report for a zip code from October 2011. It includes statistics on property listings, sales, prices, and inventory for the area. Some key findings are that property sales were lower than the previous year, median and average sales prices increased over the previous month and year, and inventory levels decreased compared to the prior year. Days on the market were the highest compared to the past two Octobers, indicating more of a seller's market.

Empfohlen
Weitere ähnliche Inhalte
Andere mochten auch
Andere mochten auch (15)
Mehr von Coldwell Banker Preferred Blue Bell
Mehr von Coldwell Banker Preferred Blue Bell (13)
Kürzlich hochgeladen
Kürzlich hochgeladen (20)
October 2011 Market Report for Zip 19151
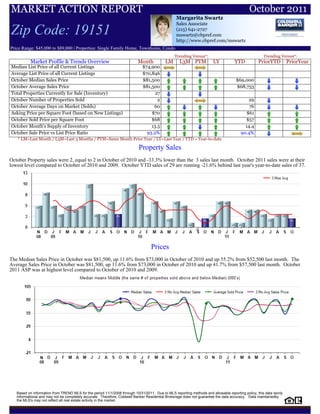
- 1. MARKET ACTION REPORT October 2011 Margarita Swartz Sales Associate Zip Code: 19151 (215) 641-2727 mswartz@cbpref.com http://www.cbpref.com/mswartz Price Range: $45,000 to $89,000 | Properties: Single Family Home, Townhome, Condo Trending Versus*: Trending Versus*: Market Profile & Trends Overview Month LM L3M PYM LY YTD PriorYTD PriorYear Median List Price of all Current Listings $74,900 Average List Price of all Current Listings $70,846 October Median Sales Price $81,500 $69,000 October Average Sales Price $81,500 $68,753 Total Properties Currently for Sale (Inventory) 27 October Number of Properties Sold 2 29 October Average Days on Market (Solds) 60 76 Asking Price per Square Foot (based on New Listings) $70 $61 October Sold Price per Square Foot $68 $57 October Month's Supply of Inventory 13.5 14.4 October Sale Price vs List Price Ratio 93.2% 90.4% * LM=Last Month / L3M=Last 3 Months / PYM=Same Month Prior Year / LY=Last Year / YTD = Year-to-date Property Sales October Property sales were 2, equal to 2 in October of 2010 and -33.3% lower than the 3 sales last month. October 2011 sales were at their lowest level compared to October of 2010 and 2009. October YTD sales of 29 are running -21.6% behind last year's year-to-date sales of 37. Prices The Median Sales Price in October was $81,500, up 11.6% from $73,000 in October of 2010 and up 55.2% from $52,500 last month. The Average Sales Price in October was $81,500, up 11.6% from $73,000 in October of 2010 and up 41.7% from $57,500 last month. October 2011 ASP was at highest level compared to October of 2010 and 2009. Based on information from TREND MLS for the period 11/1/2008 through 10/31/2011. Due to MLS reporting methods and allowable reporting policy, this data isonly informational and may not be completely accurate. Therefore, Coldwell Banker Residential Brokerage does not guarantee the data accuracy. Data maintainedby the MLS's may not reflect all real estate activity in the market.
- 2. MARKET ACTION REPORT October 2011 Margarita Swartz Sales Associate Zip Code: 19151 (215) 641-2727 mswartz@cbpref.com http://www.cbpref.com/mswartz Price Range: $45,000 to $89,000 | Properties: Single Family Home, Townhome, Condo Inventory & MSI The Total Inventory of Properties available for sale as of October was 27, down -3.6% from 28 last month and down -22.9% from 35 in October of last year. October 2011 Inventory was at the lowest level compared to October of 2010 and 2009. A comparatively lower MSI is more beneficial for sellers while a higher MSI is better for buyers. The October 2011 MSI of 13.5 months was at a mid range compared with October of 2010 and 2009. Market Time The average Days On Market(DOM) shows how many days the average Property is on the Market before it sells. An upward trend in DOM tends to indicate a move towards more of a Buyer's market, a downward trend a move towards more of a Seller's market. The DOM for October was 60, up 200.0% from 20 days last month and up 33.3% from 45 days in October of last year. The October 2011 DOM was at its highest level compared with October of 2010 and 2009. Selling Price per Square Foot The Selling Price per Square Foot is a great indicator for the direction of Property values. Since Median Sales Price and Average Sales price can be impacted by the 'mix' of high or low end Properties in the market, the selling price per square foot is a more normalized indicator on the direction of Property values. The October 2011 Selling Price per Square Foot of $68 was up 44.7% from $47 last month and up 54.5% from $44 in October of last year. Based on information from TREND MLS for the period 11/1/2008 through 10/31/2011. Due to MLS reporting methods and allowable reporting policy, this data isonly informational and may not be completely accurate. Therefore, Coldwell Banker Residential Brokerage does not guarantee the data accuracy. Data maintainedby the MLS's may not reflect all real estate activity in the market.
- 3. MARKET ACTION REPORT October 2011 Margarita Swartz Sales Associate Zip Code: 19151 (215) 641-2727 mswartz@cbpref.com http://www.cbpref.com/mswartz Price Range: $45,000 to $89,000 | Properties: Single Family Home, Townhome, Condo Selling Price vs Original Listing Price The Selling Price vs Original Listing Price reveals the average amount that Sellers are agreeing to come down from their original list price. The lower the ratio is below 100% the more of a Buyer's market exists, a ratio at or above 100% indicates more of a Seller's market. The October 2011 Selling Price vs Original List Price of 93.2% was up from 84.4% last month and up from 82.1% in October of last year. Inventory / New Listings / Sales 'This last view of the market combines monthly inventory of Properties for sale along with New Listings and Sales. The graph shows the basic annual seasonality of the market as well as the relationship between these items. The number of New Listings in October 2011 was 5, down - 16.7% from 6 last month and down -37.5% from 8 in October of last year. Based on information from TREND MLS for the period 11/1/2008 through 10/31/2011. Due to MLS reporting methods and allowable reporting policy, this data isonly informational and may not be completely accurate. Therefore, Coldwell Banker Residential Brokerage does not guarantee the data accuracy. Data maintainedby the MLS's may not reflect all real estate activity in the market.
- 4. MARKET ACTION REPORT October 2011 Margarita Swartz Sales Associate Zip Code: 19151 (215) 641-2727 mswartz@cbpref.com http://www.cbpref.com/mswartz Price Range: $45,000 to $89,000 | Properties: Single Family Home, Townhome, Condo N 08 D J 09 F M A M J J A S O N D J 10 F M A M J J A S O N D J 11 F M A M J J A S O Homes Sold 5 8 5 3 5 4 5 10 3 3 6 3 9 10 8 3 6 4 2 6 5 1 0 2 3 6 6 1 1 4 4 3 2 3 3 2 3 Mo. Roll Avg 6 5 4 4 5 6 6 5 4 4 6 7 9 7 6 4 4 4 4 4 2 1 2 4 5 4 3 2 3 4 3 3 3 3 (000's) N 08 D J 09 F M A M J J A S O N D J 10 F M A M J J A S O N D J 11 F M A M J J A S O MedianSalePrice 69 73 80 75 70 64 65 74 60 75 76 82 80 62 62 81 78 60 70 73 84 48 0 73 65 67 67 52 55 77 80 54 74 79 53 82 3 Mo. Roll Avg 74 76 75 70 66 68 66 70 70 78 79 75 68 68 74 73 69 67 75 68 44 40 46 68 66 62 58 62 71 71 70 69 69 71 N 08 D J 09 F M A M J J A S O N D J 10 F M A M J J A S O N D J 11 F M A M J J A S O Inventory 38 32 41 41 38 36 35 41 44 41 46 39 38 38 47 38 42 42 40 37 34 31 39 35 33 33 30 30 36 32 31 32 29 29 28 27 MSI 8 4 8 14 8 9 7 4 15 14 8 13 4 4 6 13 7 11 20 6 7 31 0 18 11 6 5 30 36 8 8 11 15 10 9 14 N 08 D J 09 F M A M J J A S O N D J 10 F M A M J J A S O N D J 11 F M A M J J A S O Days On Market 123 45 34 66 46 113 22 67 5 75 79 19 29 53 98 189 18 176 54 103 25 68 0 45 32 95 98 26 70 70 72 92 165 56 20 60 3 Mo. Roll Avg 67 48 49 75 60 67 31 49 53 58 42 34 60 113 102 128 83 111 61 65 31 38 26 57 75 73 65 55 71 78 110 104 80 45 N 08 D J 09 F M A M J J A S O N D J 10 F M A M J J A S O N D J 11 F M A M J J A S O Price per Sq Ft 61 58 64 59 60 55 51 55 39 73 61 61 62 47 48 58 65 40 61 59 62 37 0 44 56 61 46 41 52 66 69 53 52 69 47 68 3 Mo. Roll Avg 61 60 61 58 55 54 48 56 58 65 61 57 52 51 57 54 55 53 61 53 33 27 33 54 54 49 46 53 62 63 58 58 56 61 N 08 D J 09 F M A M J J A S O N D J 10 F M A M J J A S O N D J 11 F M A M J J A S O Sale to List Price 0.973 0.959 0.961 0.898 0.977 0.893 1.056 0.942 1.084 1.004 0.908 0.923 0.946 0.970 0.907 0.877 0.976 0.894 0.947 0.860 0.981 0.800 0.000 0.821 0.897 0.900 0.958 0.868 0.922 0.846 0.951 0.935 0.995 0.973 0.844 0.932 3 Mo. Roll Avg 0.964 0.939 0.945 0.923 0.975 0.964 1.027 1.010 0.999 0.945 0.926 0.946 0.941 0.918 0.920 0.916 0.939 0.900 0.929 0.880 0.594 0.540 0.573 0.873 0.918 0.909 0.916 0.879 0.906 0.911 0.960 0.968 0.937 0.916 N 08 D J 09 F M A M J J A S O N D J 10 F M A M J J A S O N D J 11 F M A M J J A S O New Listings 7 5 15 6 6 11 6 13 9 6 13 8 7 10 17 4 7 7 5 7 6 4 12 8 6 8 4 8 12 3 7 7 9 6 6 5 Inventory 38 32 41 41 38 36 35 41 44 41 46 39 38 38 47 38 42 42 40 37 34 31 39 35 33 33 30 30 36 32 31 32 29 29 28 27 Sales 5 8 5 3 5 4 5 10 3 3 6 3 9 10 8 3 6 4 2 6 5 1 0 2 3 6 6 1 1 4 4 3 2 3 3 2 (000's) N 08 D J 09 F M A M J J A S O N D J 10 F M A M J J A S O N D J 11 F M A M J J A S O Avg Sale Price 73 69 77 72 72 67 66 72 57 78 74 75 76 64 65 72 75 65 70 73 80 48 0 73 66 68 65 52 55 76 78 55 74 76 58 82 3 Mo. Roll Avg 73 73 74 70 68 68 65 69 70 76 75 72 68 67 70 71 70 69 74 67 43 40 46 69 66 62 57 61 70 70 69 69 69 72 Based on information from TREND MLS for the period 11/1/2008 through 10/31/2011. Due to MLS reporting methods and allowable reporting policy, this data is only informational and may not be completely accurate. Therefore, Coldwell Banker Residential Brokerage does not guarantee the data accuracy. Data maintained by the MLS's may not reflect all real estate activity in the market.