SlideShare ist ein Scribd-Unternehmen logo
1 von 5
Downloaden Sie, um offline zu lesen
Manhattan Institute 1
Reality Check: Fracking, Not Solar Power, Is Reducing U.S. Carbon-Dioxide Emissions
Key Findings
•	After peaking in 2007, U.S. carbon-dioxide emissions
were 1,022 million tons (Mt) lower in 2014 than had they
grown, since 2007, at the same rate as the U.S. economy.
◆◆ Of that reduction, 19 percent came from a fuel shift toward natural gas for
electricity generation.
◆◆ Only 1 percent came from the increased use of solar power.
•	Neither renewable-energy generation nor investment is
growing rapidly—or at all.
◆◆ Year-over-year growth in the generation of wind and solar power has consistently
fallen since 2008. Generation in the first half of 2015 was lower than in the first
half of 2014.
◆◆ Global investment in both wind and solar declined in 3Q:2015 compared with
3Q:2014; in the U.S., investment grew slightly but remains below the 2011 peak.
“Solar power is responsible
for only one percent of the
progress we have made
reducing our carbon dioxide
emissions.”
Oren Cass, Senior Fellow,
Manhattan Institute
On the Record
Fracking, Not Solar Power, Is Reducing
U.S. Carbon-Dioxide Emissions
Oren Cass
ISSUES
2• 0 • 1• 6 REALITY CHECKMI
BARACK OBAMA
“We’ll also keep doing
what we can to prevent
the worst effects of climate
change before it’s too late.
Over the past six years,
we’ve led by example,
generating more clean
energy and lowering our
carbon emissions.”1
“I’m very proud that the
state of Vermont banned
fracking. I hope commu-
nities all over California,
all over America, do the
same.”2
BERNIE SANDERS
In Reality
For all of the attention and federal funds given to renewable energy, it remains a blip on America’s
energy radar: solar power represents less than 1 percent of U.S. electricity generation. Wind and
solar power together generated less electricity in the first half of 2015 than in the first half of 2014,
and investment in the industry has been flat for almost five years, domestically and globally.
U.S. greenhouse gas emissions have fallen significantly since their peak in 2007—more than in
any other country. The biggest cause is America’s fracking-led natural gas boom: solar power is
responsible for 1 percent of the decline in U.S. carbon-dioxide emissions; natural gas is responsible
for nearly 20 percent.
www.manhattan-institute.org/issues2016
Manhattan Institute 2
Reality Check: Fracking, Not Solar Power, Is Reducing U.S. Carbon-Dioxide Emissions
The technology that has done most to
reduce U.S. greenhouse gas emissions
is fracking. In the past seven years, the
fracking-led natural gas boom has cut
U.S. emissions more than ten times
as fast as solar power has. And while
renewable technologies are making
significant progress, growth in their
investment and deployment is slowing
dramatically. Anyone serious about
reducing carbon-dioxide emissions
should be celebrating fracking both in
the U.S. and around the world.”
Oren Cass, Senior Fellow, Manhattan Institute
On the Record
Manhattan Institute 3
Reality Check: Fracking, Not Solar Power, Is Reducing U.S. Carbon-Dioxide Emissions
Renewable-energy technologies have achieved impressive gains in recent years; in particular, solar-panel costs have
fallen dramatically.3
As a result, both wind and solar power now find a variety of applications where they make economic
sense, sometimes even without a generous federal subsidy. They appear poised for continued progress and increasing
deployment in years to come.
However, the growth in electricity generation from these sources looks impressive only in percentage terms. Solar power
contributed only 18 billion kilowatt-hours (kWh) to the 3,936 billion kWh generated by the U.S. electricity sector last year.4
As a result, the country’s massive investment in the technology has made virtually no dent in total emissions of carbon-
dioxide—and will not make a significant dent for the foreseeable future.
Conversely, the extraordinary technological progress that produced America’s natural gas boom has sent natural gas
prices plummeting and has driven a substantial shift from coal to natural gas as the fuel generating U.S. electricity.
Burning natural gas emits only about half as much carbon-dioxide as burning coal (and even smaller fractions of harmful
air pollutants), so its increased use at the expense of coal reduces emissions.5
Fracking, the technique despised by
environmentalists for extracting natural gas from shale, is reducing carbon-dioxide emissions much faster than renewable
energy can.
Manhattan Institute 4
Reality Check: Fracking, Not Solar Power, Is Reducing U.S. Carbon-Dioxide Emissions
Energy Efficiency and Fracking—Not Wind and
Solar—Are Reducing Carbon-Dioxide Emissions
Without changes in the U.S. economy’s composition or technology, energy consumption would rise
roughly in line with economic growth; and carbon-dioxide emissions would rise roughly in line with
energy consumption. Lower emissions must be the result of either improved energy efficiency (less
energy consumption per unit of economic output) or less carbon-intensive energy (less carbon-diox-
ide per unit of energy consumption).
From 2007 to 2014, U.S. GDP grew by 7.3 percent (constant dollars).6
U.S. emissions from energy
consumption peaked at 6,001 megatons of carbon-dioxide (MtCO2
) in 2007.Then, instead of growing
by 7.3 percent, along with GDP, to 6,440 MtCO2
, emissions fell by 9.7 percent, to 5,417 MtCO2.7
How
to explain this elimination of 1,022 MtCO2
of emissions?8
Of the reduction, 551 Mt (54 percent) came from electricity generation, 205 Mt (20 percent) came
from motor-vehicle gasoline, and the remaining 266 Mt (26 percent) came from all other sources,
including industrial uses, heating, and aviation. In the case of electricity, emissions fell from 2,425 Mt
in 2007 to 2,051 Mt in 2014; had they risen in line with GDP growth, they would have risen to 2,602
Mt. The eliminated 551 Mt of emissions from electricity generation had three causes:
•	 Efficiency. Electricity use, per dollar of GDP, declined by 8.4 percent, from 0.269 kWh/
dollar in 2007 to 0.247 in 2014.This alone would have reduced emissions from 2,602
Mt to 2,383 Mt.
•	 Renewables. Zero-carbon electricity generation increased from 27.5 percent in 2007
to 32.3 percent in 2014.This alone would have reduced emissions from 2,602 Mt to
2,431 Mt. Solar power as a share of total electricity generation increased, from 0.02
percent in 2007 to 0.45 percent in 2014.This represented 9.2 percent of the total
zero-carbon increase and, thus, 16 Mt of the 171 Mt reduction.The increase in wind
power, from 0.9 percent to 4.6 percent, accounted for 135 Mt.The combined increase
in hydroelectric, nuclear, and geothermal power would have contributed an additional
20 Mt reduction.
•	 Fracking. Carbon-dioxide emissions per kWh of fossil-fuel-generated electricity de-
clined by 7.9 percent—from 835 tCO2
per million kWh in 2007 to 769 in 2014—thanks
to a ten-point shift in fuel mix, from 28 percent natural gas / 69 percent coal to 39
percent natural gas / 59 percent coal.9
This shift alone would have reduced emissions
from 2,602 Mt to 2,397 Mt.
Thus, credit for the total 1,022 Mt, accounting for covariance,10
goes to:
In 2013, global carbon-dioxide emissions from fossil fuels totaled 36,131 Mt (the most recent year
for which data are available),12
so the reduction achieved by U.S. solar power represented 0.04
percent of global emissions—or less than four hours’ worth.
	 Energy efficiency (electricity)	 203 Mt (20 percent)
	Fracking-driven natural gas increase (electricity) 	 190 Mt (19 percent)
	 Wind power (electricity)	 125 Mt (12 percent)
	 Fuel efficiency (gasoline)	 114 Mt (11 percent)
	 Reduced vehicle-miles (gasoline)	 91 Mt (9 percent)
	 Nuclear, hydro, geothermal power (electricity)	 19 Mt (2 percent)
	 Solar power (electricity)	 15 Mt (1 percent)
	 Other (industrial, heating, aviation, etc.)	 266 Mt (26 percent)11
This Picture
Will Not Change
Anytime Soon
Notwithstanding frequent reports
that renewable-energy production
in the U.S. is “rising at an exponen-
tial rate,”13
its growth has stalled.
Since achieving a 60 percent year-
over-year increase in 2008, growth
in total wind and solar generation
has been consistently slowing: 33
percent in 2009,28 percent in 2010,
27 percent in 2011, 19 percent in
2012, 22 percent in 2013, and 13
percent in 2014—the lowest since
2003. Total generation of wind and
solar power actually fell in the first
half of 2015 compared with the first
half of 2014. Solar continued to
grow, but the rate of growth fell by
more than half, while wind genera-
tion fell in absolute terms.14
The growth in new renewable-en-
ergy investment has ended, too. In
each of the first three quarters of
2015, global investment was below
the equivalent quarter in 2014 and
below the peak achieved in 2011.15
This slowdown has afflicted both
solar and wind: in the third quarter
of 2015,wind and solar investments
declined from the third quarter of
2014.16
Production of solar panels
leveled off in recent years as well,
growing only 4 percent annually
during 2011–13.17
In the U.S., 2015
investment is above the 2014 level
but remains well below its 2011
peak.18
Headlines may continue to herald
each new renewable installation
as a paradigm shift. Analyst reports
may continue to celebrate new, hy-
pothetically low-cost, technologies.
But energy observers who have to
put their money where their mouths
are will continue to take a much
more cautious approach.
Manhattan Institute 5
Reality Check: Fracking, Not Solar Power, Is Reducing U.S. Carbon-Dioxide Emissions
1	 See https://www.whitehouse.gov/the-press-office/2015/10/24/weekly-address-protecting-our-planet-future-
generations.
2	 See https://www.youtube.com/watch?v=2qYzwDbBHZM.
3	 See http://www.eia.gov/forecasts/aeo/electricity_generation.cfm.
4	 See http://www.eia.gov/totalenergy/data/monthly/index.cfm#electricity (September 2015, table 7.2b).
5	 See http://www.eia.gov/tools/faqs/faq.cfm?id=74t=11. This analysis does not include emissions generated by
fuel sources or generation equipment during extraction and production processes.
6	 See http://www.bea.gov/national/index.htm#gdp (current dollars and “real” GDP).
7	 See http://www.eia.gov/totalenergy/data/monthly/index.cfm#environment (September 2015, table 12.6).
8	 For data on allocating emissions reductions, see http://www.eia.gov/totalenergy/data/monthly/index.cfm
(September 2015, tables 7.2b, 12.1, 12.6).
9	 Improved efficiency of coal plants was not a factor in reducing emissions: carbon-dioxide emissions, per kWh of
electricity generated from coal, changed less than 1 percent during 2007–14.
10	 Because effects are overlapping (e.g., greater efficiency is “worth” less, in terms of emission reductions, when the
electricity also comes from less carbon-intensive sources), the sum of individual effects within electricity-related
reductions is larger than the 551 Mt total. Final shares of the total are allocated based on their relative sizes in isolation.
11	 A significant share of this decrease also comes from increased use of natural gas, not counted in the electricity-
specific fracking total.
12	 See http://cdiac.ornl.gov/GCP/ (2014 Budget v1.1—includes cement production and flaring).
13	 See http://www.bloomberg.com/news/articles/2015-10-06/solar-wind-reach-a-big-renewables-turning-point-bnef.
14	 See http://www.eia.gov/totalenergy/data/monthly/index.cfm (September 2015, table 7.2b).
15	 See http://about.bnef.com/content/uploads/sites/4/2015/10/2015-10-08-Clean-Energy-Investment-Q3-2015-
factpack.pdf.
16	 See http://www.bloomberg.com/news/articles/2015-10-08/renewables-shrug-off-slumping-oil-as-investment-
remains-steady.
17	 See http://www.eia.gov/todayinenergy/detail.cfm?id=22912.
18	 See http://about.bnef.com/content/uploads/sites/4/2015/10/2015-10-08-Clean-Energy-Investment-Q3-2015-factpack.pdf.
Endnotes

Weitere ähnliche Inhalte

Was ist angesagt?

The Global Energy Challenges on Role Of Nuclear Energy and Climate Change
The Global Energy Challenges on Role Of Nuclear Energy and Climate ChangeThe Global Energy Challenges on Role Of Nuclear Energy and Climate Change
The Global Energy Challenges on Role Of Nuclear Energy and Climate ChangeMahfuzur Rahman Titu
 
Climate Change: Implications for Energy
Climate Change: Implications for EnergyClimate Change: Implications for Energy
Climate Change: Implications for EnergyECFoundation
 
Global Energy Interconnection
Global Energy InterconnectionGlobal Energy Interconnection
Global Energy InterconnectionXynteo
 
Why nuclear rk tech update 2019
Why nuclear   rk tech update 2019Why nuclear   rk tech update 2019
Why nuclear rk tech update 2019Robert Kieronski
 
Renewable Energy for Sustainable Development of Nepal
Renewable Energy for Sustainable Development of NepalRenewable Energy for Sustainable Development of Nepal
Renewable Energy for Sustainable Development of NepalKushal Gurung
 
Summary Presentation for The Great Transition: Shifting from Fossil Fuels to ...
Summary Presentation for The Great Transition: Shifting from Fossil Fuels to ...Summary Presentation for The Great Transition: Shifting from Fossil Fuels to ...
Summary Presentation for The Great Transition: Shifting from Fossil Fuels to ...Earth Policy Institute
 
IEA fossil fuel emissions & WEO 2013
IEA fossil fuel emissions & WEO 2013IEA fossil fuel emissions & WEO 2013
IEA fossil fuel emissions & WEO 2013Peter Carter
 
William Hogan, Research Director, Harvard Electricity Policy Group, Harvard U...
William Hogan, Research Director, Harvard Electricity Policy Group, Harvard U...William Hogan, Research Director, Harvard Electricity Policy Group, Harvard U...
William Hogan, Research Director, Harvard Electricity Policy Group, Harvard U...Sustainable Prosperity
 
Nic Rivers, Canada Research Chair in Climate and Energy Policy, University of...
Nic Rivers, Canada Research Chair in Climate and Energy Policy, University of...Nic Rivers, Canada Research Chair in Climate and Energy Policy, University of...
Nic Rivers, Canada Research Chair in Climate and Energy Policy, University of...Sustainable Prosperity
 
Passivhaus Conference Keynote Presentation – Nov 2007
Passivhaus Conference Keynote Presentation – Nov 2007Passivhaus Conference Keynote Presentation – Nov 2007
Passivhaus Conference Keynote Presentation – Nov 2007stanner
 
Energy, climate change
Energy, climate changeEnergy, climate change
Energy, climate change L
 
The Big Climate Speech: Why tackling climate change is one of America's great...
The Big Climate Speech: Why tackling climate change is one of America's great...The Big Climate Speech: Why tackling climate change is one of America's great...
The Big Climate Speech: Why tackling climate change is one of America's great...Career Communications Group
 
P6 patterns-of-energy-use
P6 patterns-of-energy-useP6 patterns-of-energy-use
P6 patterns-of-energy-useopsonise
 

Was ist angesagt? (20)

Energy Efficiency
Energy EfficiencyEnergy Efficiency
Energy Efficiency
 
Palz pv 2015
Palz pv 2015Palz pv 2015
Palz pv 2015
 
Apollo programme report
Apollo programme reportApollo programme report
Apollo programme report
 
The Global Energy Challenges on Role Of Nuclear Energy and Climate Change
The Global Energy Challenges on Role Of Nuclear Energy and Climate ChangeThe Global Energy Challenges on Role Of Nuclear Energy and Climate Change
The Global Energy Challenges on Role Of Nuclear Energy and Climate Change
 
How Renewables are Winning - Report
How Renewables are Winning - ReportHow Renewables are Winning - Report
How Renewables are Winning - Report
 
Nuclear for climate
Nuclear for climateNuclear for climate
Nuclear for climate
 
Climate Change: Implications for Energy
Climate Change: Implications for EnergyClimate Change: Implications for Energy
Climate Change: Implications for Energy
 
Global Energy Interconnection
Global Energy InterconnectionGlobal Energy Interconnection
Global Energy Interconnection
 
Why nuclear rk tech update 2019
Why nuclear   rk tech update 2019Why nuclear   rk tech update 2019
Why nuclear rk tech update 2019
 
Renewable Energy for Sustainable Development of Nepal
Renewable Energy for Sustainable Development of NepalRenewable Energy for Sustainable Development of Nepal
Renewable Energy for Sustainable Development of Nepal
 
Summary Presentation for The Great Transition: Shifting from Fossil Fuels to ...
Summary Presentation for The Great Transition: Shifting from Fossil Fuels to ...Summary Presentation for The Great Transition: Shifting from Fossil Fuels to ...
Summary Presentation for The Great Transition: Shifting from Fossil Fuels to ...
 
Energy
EnergyEnergy
Energy
 
IEA fossil fuel emissions & WEO 2013
IEA fossil fuel emissions & WEO 2013IEA fossil fuel emissions & WEO 2013
IEA fossil fuel emissions & WEO 2013
 
William Hogan, Research Director, Harvard Electricity Policy Group, Harvard U...
William Hogan, Research Director, Harvard Electricity Policy Group, Harvard U...William Hogan, Research Director, Harvard Electricity Policy Group, Harvard U...
William Hogan, Research Director, Harvard Electricity Policy Group, Harvard U...
 
Nic Rivers, Canada Research Chair in Climate and Energy Policy, University of...
Nic Rivers, Canada Research Chair in Climate and Energy Policy, University of...Nic Rivers, Canada Research Chair in Climate and Energy Policy, University of...
Nic Rivers, Canada Research Chair in Climate and Energy Policy, University of...
 
Passivhaus Conference Keynote Presentation – Nov 2007
Passivhaus Conference Keynote Presentation – Nov 2007Passivhaus Conference Keynote Presentation – Nov 2007
Passivhaus Conference Keynote Presentation – Nov 2007
 
Energy
EnergyEnergy
Energy
 
Energy, climate change
Energy, climate changeEnergy, climate change
Energy, climate change
 
The Big Climate Speech: Why tackling climate change is one of America's great...
The Big Climate Speech: Why tackling climate change is one of America's great...The Big Climate Speech: Why tackling climate change is one of America's great...
The Big Climate Speech: Why tackling climate change is one of America's great...
 
P6 patterns-of-energy-use
P6 patterns-of-energy-useP6 patterns-of-energy-use
P6 patterns-of-energy-use
 

Andere mochten auch

In Searching of IPhO 2017 Logo: An Unofficial Suggestion
In Searching of IPhO 2017 Logo: An Unofficial SuggestionIn Searching of IPhO 2017 Logo: An Unofficial Suggestion
In Searching of IPhO 2017 Logo: An Unofficial SuggestionSparisoma Viridi
 
Heroin withdrawal treatment - InfoBarrel
Heroin withdrawal treatment - InfoBarrelHeroin withdrawal treatment - InfoBarrel
Heroin withdrawal treatment - InfoBarrelwomanlytraditio77
 
Magnum Hunter Resources' 3Q15 SEC Form 10-Q
Magnum Hunter Resources' 3Q15 SEC Form 10-QMagnum Hunter Resources' 3Q15 SEC Form 10-Q
Magnum Hunter Resources' 3Q15 SEC Form 10-QMarcellus Drilling News
 
Science Museum Learnings and Action: Engaging Girls in STEM
Science Museum Learnings and Action: Engaging Girls in STEMScience Museum Learnings and Action: Engaging Girls in STEM
Science Museum Learnings and Action: Engaging Girls in STEMSociety of Women Engineers
 
Tg dos circunferencias exteriores
Tg dos circunferencias exterioresTg dos circunferencias exteriores
Tg dos circunferencias exterioresJose Manuel Perez
 
Granular Particles and Related System
Granular Particles and Related SystemGranular Particles and Related System
Granular Particles and Related SystemSparisoma Viridi
 
Construction of Maximum Tortuosity of Single Fluid Path in Grid-based 2-d Sys...
Construction of Maximum Tortuosity of Single Fluid Path in Grid-based 2-d Sys...Construction of Maximum Tortuosity of Single Fluid Path in Grid-based 2-d Sys...
Construction of Maximum Tortuosity of Single Fluid Path in Grid-based 2-d Sys...Sparisoma Viridi
 
Still Life Photography
Still Life PhotographyStill Life Photography
Still Life PhotographyShaun Watkiss
 
DSLR Camera Basics
DSLR Camera BasicsDSLR Camera Basics
DSLR Camera BasicsMuhannad
 
Still life photography
Still life photographyStill life photography
Still life photographyLuke Woolhead
 
поиск, отбор и оценка Hr директора 13.05.2015
поиск, отбор и оценка Hr директора 13.05.2015поиск, отбор и оценка Hr директора 13.05.2015
поиск, отбор и оценка Hr директора 13.05.2015Elina Polukhina
 
dsnotify presentation at www2010
dsnotify presentation at www2010 dsnotify presentation at www2010
dsnotify presentation at www2010 Niko Popitsch
 
Resonance condition of bamboo-like trees based on granular particle-spring mo...
Resonance condition of bamboo-like trees based on granular particle-spring mo...Resonance condition of bamboo-like trees based on granular particle-spring mo...
Resonance condition of bamboo-like trees based on granular particle-spring mo...Sparisoma Viridi
 

Andere mochten auch (19)

In Searching of IPhO 2017 Logo: An Unofficial Suggestion
In Searching of IPhO 2017 Logo: An Unofficial SuggestionIn Searching of IPhO 2017 Logo: An Unofficial Suggestion
In Searching of IPhO 2017 Logo: An Unofficial Suggestion
 
Heroin withdrawal treatment - InfoBarrel
Heroin withdrawal treatment - InfoBarrelHeroin withdrawal treatment - InfoBarrel
Heroin withdrawal treatment - InfoBarrel
 
Magnum Hunter Resources' 3Q15 SEC Form 10-Q
Magnum Hunter Resources' 3Q15 SEC Form 10-QMagnum Hunter Resources' 3Q15 SEC Form 10-Q
Magnum Hunter Resources' 3Q15 SEC Form 10-Q
 
Science Museum Learnings and Action: Engaging Girls in STEM
Science Museum Learnings and Action: Engaging Girls in STEMScience Museum Learnings and Action: Engaging Girls in STEM
Science Museum Learnings and Action: Engaging Girls in STEM
 
Tg dos circunferencias exteriores
Tg dos circunferencias exterioresTg dos circunferencias exteriores
Tg dos circunferencias exteriores
 
Granular Particles and Related System
Granular Particles and Related SystemGranular Particles and Related System
Granular Particles and Related System
 
Problema contextualizado geometria
Problema contextualizado geometriaProblema contextualizado geometria
Problema contextualizado geometria
 
Lenguaje visual
Lenguaje visualLenguaje visual
Lenguaje visual
 
Construction of Maximum Tortuosity of Single Fluid Path in Grid-based 2-d Sys...
Construction of Maximum Tortuosity of Single Fluid Path in Grid-based 2-d Sys...Construction of Maximum Tortuosity of Single Fluid Path in Grid-based 2-d Sys...
Construction of Maximum Tortuosity of Single Fluid Path in Grid-based 2-d Sys...
 
Still Life Photography
Still Life PhotographyStill Life Photography
Still Life Photography
 
DSLR Camera Basics
DSLR Camera BasicsDSLR Camera Basics
DSLR Camera Basics
 
Still life photography
Still life photographyStill life photography
Still life photography
 
Leporello
LeporelloLeporello
Leporello
 
Álbum ilustrado
Álbum ilustradoÁlbum ilustrado
Álbum ilustrado
 
поиск, отбор и оценка Hr директора 13.05.2015
поиск, отбор и оценка Hr директора 13.05.2015поиск, отбор и оценка Hr директора 13.05.2015
поиск, отбор и оценка Hr директора 13.05.2015
 
dsnotify presentation at www2010
dsnotify presentation at www2010 dsnotify presentation at www2010
dsnotify presentation at www2010
 
Portraits
PortraitsPortraits
Portraits
 
La guerra fría
La guerra fríaLa guerra fría
La guerra fría
 
Resonance condition of bamboo-like trees based on granular particle-spring mo...
Resonance condition of bamboo-like trees based on granular particle-spring mo...Resonance condition of bamboo-like trees based on granular particle-spring mo...
Resonance condition of bamboo-like trees based on granular particle-spring mo...
 

Ähnlich wie Fracking Cuts US Carbon Emissions 19

Ember's 2020 Global Electricity Review
Ember's 2020 Global Electricity ReviewEmber's 2020 Global Electricity Review
Ember's 2020 Global Electricity ReviewDave Jones
 
UK Energy Policy
UK Energy PolicyUK Energy Policy
UK Energy PolicyJuan Moreno
 
Energy conservation in india
Energy conservation in indiaEnergy conservation in india
Energy conservation in indiaSatyajitMajumder5
 
A2 CAMBRIDGE GEOGRAPHY: ENVIRONMENTAL MANAGEMENT - SUSTAINABLE ENERGY SUPPLIES
A2 CAMBRIDGE GEOGRAPHY: ENVIRONMENTAL MANAGEMENT - SUSTAINABLE ENERGY SUPPLIESA2 CAMBRIDGE GEOGRAPHY: ENVIRONMENTAL MANAGEMENT - SUSTAINABLE ENERGY SUPPLIES
A2 CAMBRIDGE GEOGRAPHY: ENVIRONMENTAL MANAGEMENT - SUSTAINABLE ENERGY SUPPLIESGeorge Dumitrache
 
World Energy Outlook 2016 - Executive Summary
World Energy Outlook 2016 - Executive SummaryWorld Energy Outlook 2016 - Executive Summary
World Energy Outlook 2016 - Executive SummaryMarcellus Drilling News
 
CommentVisions - Greg Bothun - How can Europe and the world learn from the de...
CommentVisions - Greg Bothun - How can Europe and the world learn from the de...CommentVisions - Greg Bothun - How can Europe and the world learn from the de...
CommentVisions - Greg Bothun - How can Europe and the world learn from the de...CommentVisions
 
The Necessity of Nuclear Power in Iran
The Necessity of Nuclear Power in IranThe Necessity of Nuclear Power in Iran
The Necessity of Nuclear Power in IranCSCJournals
 
Energy scanario of usa
Energy scanario of usaEnergy scanario of usa
Energy scanario of usaRavi Rss
 
M6A1 Group Project - Alternative Energy Final - 20190616
M6A1 Group Project - Alternative Energy Final - 20190616 M6A1 Group Project - Alternative Energy Final - 20190616
M6A1 Group Project - Alternative Energy Final - 20190616 ChristopherGibson31
 
M6A1 Group Project - Alternative Energy - 20190616
M6A1 Group Project - Alternative Energy - 20190616M6A1 Group Project - Alternative Energy - 20190616
M6A1 Group Project - Alternative Energy - 20190616ChristopherGibson31
 
CAMBRIDGE GEOGRAPHY A2 - ENVIRONMENTAL MANAGEMENT: FACTORS AFFECTING THE DEMA...
CAMBRIDGE GEOGRAPHY A2 - ENVIRONMENTAL MANAGEMENT: FACTORS AFFECTING THE DEMA...CAMBRIDGE GEOGRAPHY A2 - ENVIRONMENTAL MANAGEMENT: FACTORS AFFECTING THE DEMA...
CAMBRIDGE GEOGRAPHY A2 - ENVIRONMENTAL MANAGEMENT: FACTORS AFFECTING THE DEMA...George Dumitrache
 
Energy power shift 09_2016
Energy power shift 09_2016 Energy power shift 09_2016
Energy power shift 09_2016 Vasilis Rallis
 
DNV Energy Transition Outlook 2022
DNV Energy Transition Outlook 2022DNV Energy Transition Outlook 2022
DNV Energy Transition Outlook 2022Energy for One World
 
The sleeping giant_-_when_energy_prices_awake_whitepaper
The sleeping giant_-_when_energy_prices_awake_whitepaperThe sleeping giant_-_when_energy_prices_awake_whitepaper
The sleeping giant_-_when_energy_prices_awake_whitepaperShannon Scheiwiller, MBA
 
The sleeping giant_-_when_energy_prices_awake_whitepaper
The sleeping giant_-_when_energy_prices_awake_whitepaperThe sleeping giant_-_when_energy_prices_awake_whitepaper
The sleeping giant_-_when_energy_prices_awake_whitepaperShannon Scheiwiller, MBA
 

Ähnlich wie Fracking Cuts US Carbon Emissions 19 (20)

Wichita Cfr
Wichita CfrWichita Cfr
Wichita Cfr
 
Ember's 2020 Global Electricity Review
Ember's 2020 Global Electricity ReviewEmber's 2020 Global Electricity Review
Ember's 2020 Global Electricity Review
 
ENERGY TRANSITION OUTLOOK 2021
ENERGY TRANSITION OUTLOOK  2021ENERGY TRANSITION OUTLOOK  2021
ENERGY TRANSITION OUTLOOK 2021
 
UK Energy Policy
UK Energy PolicyUK Energy Policy
UK Energy Policy
 
Thorium
ThoriumThorium
Thorium
 
Energy conservation in india
Energy conservation in indiaEnergy conservation in india
Energy conservation in india
 
A2 CAMBRIDGE GEOGRAPHY: ENVIRONMENTAL MANAGEMENT - SUSTAINABLE ENERGY SUPPLIES
A2 CAMBRIDGE GEOGRAPHY: ENVIRONMENTAL MANAGEMENT - SUSTAINABLE ENERGY SUPPLIESA2 CAMBRIDGE GEOGRAPHY: ENVIRONMENTAL MANAGEMENT - SUSTAINABLE ENERGY SUPPLIES
A2 CAMBRIDGE GEOGRAPHY: ENVIRONMENTAL MANAGEMENT - SUSTAINABLE ENERGY SUPPLIES
 
World Energy Outlook 2016 - Executive Summary
World Energy Outlook 2016 - Executive SummaryWorld Energy Outlook 2016 - Executive Summary
World Energy Outlook 2016 - Executive Summary
 
Eradicated Coal Paper
Eradicated Coal PaperEradicated Coal Paper
Eradicated Coal Paper
 
CommentVisions - Greg Bothun - How can Europe and the world learn from the de...
CommentVisions - Greg Bothun - How can Europe and the world learn from the de...CommentVisions - Greg Bothun - How can Europe and the world learn from the de...
CommentVisions - Greg Bothun - How can Europe and the world learn from the de...
 
Energy
EnergyEnergy
Energy
 
The Necessity of Nuclear Power in Iran
The Necessity of Nuclear Power in IranThe Necessity of Nuclear Power in Iran
The Necessity of Nuclear Power in Iran
 
Energy scanario of usa
Energy scanario of usaEnergy scanario of usa
Energy scanario of usa
 
M6A1 Group Project - Alternative Energy Final - 20190616
M6A1 Group Project - Alternative Energy Final - 20190616 M6A1 Group Project - Alternative Energy Final - 20190616
M6A1 Group Project - Alternative Energy Final - 20190616
 
M6A1 Group Project - Alternative Energy - 20190616
M6A1 Group Project - Alternative Energy - 20190616M6A1 Group Project - Alternative Energy - 20190616
M6A1 Group Project - Alternative Energy - 20190616
 
CAMBRIDGE GEOGRAPHY A2 - ENVIRONMENTAL MANAGEMENT: FACTORS AFFECTING THE DEMA...
CAMBRIDGE GEOGRAPHY A2 - ENVIRONMENTAL MANAGEMENT: FACTORS AFFECTING THE DEMA...CAMBRIDGE GEOGRAPHY A2 - ENVIRONMENTAL MANAGEMENT: FACTORS AFFECTING THE DEMA...
CAMBRIDGE GEOGRAPHY A2 - ENVIRONMENTAL MANAGEMENT: FACTORS AFFECTING THE DEMA...
 
Energy power shift 09_2016
Energy power shift 09_2016 Energy power shift 09_2016
Energy power shift 09_2016
 
DNV Energy Transition Outlook 2022
DNV Energy Transition Outlook 2022DNV Energy Transition Outlook 2022
DNV Energy Transition Outlook 2022
 
The sleeping giant_-_when_energy_prices_awake_whitepaper
The sleeping giant_-_when_energy_prices_awake_whitepaperThe sleeping giant_-_when_energy_prices_awake_whitepaper
The sleeping giant_-_when_energy_prices_awake_whitepaper
 
The sleeping giant_-_when_energy_prices_awake_whitepaper
The sleeping giant_-_when_energy_prices_awake_whitepaperThe sleeping giant_-_when_energy_prices_awake_whitepaper
The sleeping giant_-_when_energy_prices_awake_whitepaper
 

Mehr von Marcellus Drilling News

Five facts about shale: it’s coming back, and coming back strong
Five facts about shale: it’s coming back, and coming back strongFive facts about shale: it’s coming back, and coming back strong
Five facts about shale: it’s coming back, and coming back strongMarcellus Drilling News
 
Quarterly legislative action update: Marcellus and Utica shale region (4Q16)
Quarterly legislative action update: Marcellus and Utica shale region (4Q16)Quarterly legislative action update: Marcellus and Utica shale region (4Q16)
Quarterly legislative action update: Marcellus and Utica shale region (4Q16)Marcellus Drilling News
 
Access Northeast Pipeline Project - Dec 2016 Update
Access Northeast Pipeline Project - Dec 2016 UpdateAccess Northeast Pipeline Project - Dec 2016 Update
Access Northeast Pipeline Project - Dec 2016 UpdateMarcellus Drilling News
 
Rover Pipeline Letter to FERC Requesting Final Certificate
Rover Pipeline Letter to FERC Requesting Final CertificateRover Pipeline Letter to FERC Requesting Final Certificate
Rover Pipeline Letter to FERC Requesting Final CertificateMarcellus Drilling News
 
DOE Order Granting Elba Island LNG Right to Export to Non-FTA Countries
DOE Order Granting Elba Island LNG Right to Export to Non-FTA CountriesDOE Order Granting Elba Island LNG Right to Export to Non-FTA Countries
DOE Order Granting Elba Island LNG Right to Export to Non-FTA CountriesMarcellus Drilling News
 
LSE Study: Fracking is Revitalizing U.S. Manufacturing
LSE Study: Fracking is Revitalizing U.S. ManufacturingLSE Study: Fracking is Revitalizing U.S. Manufacturing
LSE Study: Fracking is Revitalizing U.S. ManufacturingMarcellus Drilling News
 
Letter From 24 States Asking Trump & Congress to Withdraw the Unlawful Clean ...
Letter From 24 States Asking Trump & Congress to Withdraw the Unlawful Clean ...Letter From 24 States Asking Trump & Congress to Withdraw the Unlawful Clean ...
Letter From 24 States Asking Trump & Congress to Withdraw the Unlawful Clean ...Marcellus Drilling News
 
Report: New U.S. Power Costs: by County, with Environmental Externalities
Report: New U.S. Power Costs: by County, with Environmental ExternalitiesReport: New U.S. Power Costs: by County, with Environmental Externalities
Report: New U.S. Power Costs: by County, with Environmental ExternalitiesMarcellus Drilling News
 
U.S. Crude Oil and Natural Gas Proved Reserves, Year-end 2015
U.S. Crude Oil and Natural Gas Proved Reserves, Year-end 2015U.S. Crude Oil and Natural Gas Proved Reserves, Year-end 2015
U.S. Crude Oil and Natural Gas Proved Reserves, Year-end 2015Marcellus Drilling News
 
U.S. EIA's Drilling Productivity Report - December 2015
U.S. EIA's Drilling Productivity Report - December 2015U.S. EIA's Drilling Productivity Report - December 2015
U.S. EIA's Drilling Productivity Report - December 2015Marcellus Drilling News
 
Velocys Plan to "Build the Business" - Gas-to-Liquids Plants
Velocys Plan to "Build the Business" - Gas-to-Liquids PlantsVelocys Plan to "Build the Business" - Gas-to-Liquids Plants
Velocys Plan to "Build the Business" - Gas-to-Liquids PlantsMarcellus Drilling News
 
PA DEP Revised Permit for Natural Gas Compression Stations, Processing Plants...
PA DEP Revised Permit for Natural Gas Compression Stations, Processing Plants...PA DEP Revised Permit for Natural Gas Compression Stations, Processing Plants...
PA DEP Revised Permit for Natural Gas Compression Stations, Processing Plants...Marcellus Drilling News
 
PA DEP Permit for Unconventional NatGas Well Site Operations and Remote Piggi...
PA DEP Permit for Unconventional NatGas Well Site Operations and Remote Piggi...PA DEP Permit for Unconventional NatGas Well Site Operations and Remote Piggi...
PA DEP Permit for Unconventional NatGas Well Site Operations and Remote Piggi...Marcellus Drilling News
 
PA DEP: Methane Reduction Strategies for Natural Gas Operations
PA DEP: Methane Reduction Strategies for Natural Gas OperationsPA DEP: Methane Reduction Strategies for Natural Gas Operations
PA DEP: Methane Reduction Strategies for Natural Gas OperationsMarcellus Drilling News
 
US EIA's December 2016 Short-Term Energy Outlook
US EIA's December 2016 Short-Term Energy OutlookUS EIA's December 2016 Short-Term Energy Outlook
US EIA's December 2016 Short-Term Energy OutlookMarcellus Drilling News
 
Northeast Gas Association's 2016 Statistical Guide
Northeast Gas Association's 2016 Statistical GuideNortheast Gas Association's 2016 Statistical Guide
Northeast Gas Association's 2016 Statistical GuideMarcellus Drilling News
 
PA PUC Responses to Auditor General's Act 13 Impact Fee Audit
PA PUC Responses to Auditor General's Act 13 Impact Fee AuditPA PUC Responses to Auditor General's Act 13 Impact Fee Audit
PA PUC Responses to Auditor General's Act 13 Impact Fee AuditMarcellus Drilling News
 
Pennsylvania Public Utility Commission Act 13/Impact Fees Audit by PA Auditor...
Pennsylvania Public Utility Commission Act 13/Impact Fees Audit by PA Auditor...Pennsylvania Public Utility Commission Act 13/Impact Fees Audit by PA Auditor...
Pennsylvania Public Utility Commission Act 13/Impact Fees Audit by PA Auditor...Marcellus Drilling News
 
Clyde Mine Discharge/Tenmile Creek Water Quality Final Report
Clyde Mine Discharge/Tenmile Creek Water Quality Final ReportClyde Mine Discharge/Tenmile Creek Water Quality Final Report
Clyde Mine Discharge/Tenmile Creek Water Quality Final ReportMarcellus Drilling News
 
FERC Order Denying Stay of Kinder Morgan's Broad Run Expansion Project
FERC Order Denying Stay of Kinder Morgan's Broad Run Expansion ProjectFERC Order Denying Stay of Kinder Morgan's Broad Run Expansion Project
FERC Order Denying Stay of Kinder Morgan's Broad Run Expansion ProjectMarcellus Drilling News
 

Mehr von Marcellus Drilling News (20)

Five facts about shale: it’s coming back, and coming back strong
Five facts about shale: it’s coming back, and coming back strongFive facts about shale: it’s coming back, and coming back strong
Five facts about shale: it’s coming back, and coming back strong
 
Quarterly legislative action update: Marcellus and Utica shale region (4Q16)
Quarterly legislative action update: Marcellus and Utica shale region (4Q16)Quarterly legislative action update: Marcellus and Utica shale region (4Q16)
Quarterly legislative action update: Marcellus and Utica shale region (4Q16)
 
Access Northeast Pipeline Project - Dec 2016 Update
Access Northeast Pipeline Project - Dec 2016 UpdateAccess Northeast Pipeline Project - Dec 2016 Update
Access Northeast Pipeline Project - Dec 2016 Update
 
Rover Pipeline Letter to FERC Requesting Final Certificate
Rover Pipeline Letter to FERC Requesting Final CertificateRover Pipeline Letter to FERC Requesting Final Certificate
Rover Pipeline Letter to FERC Requesting Final Certificate
 
DOE Order Granting Elba Island LNG Right to Export to Non-FTA Countries
DOE Order Granting Elba Island LNG Right to Export to Non-FTA CountriesDOE Order Granting Elba Island LNG Right to Export to Non-FTA Countries
DOE Order Granting Elba Island LNG Right to Export to Non-FTA Countries
 
LSE Study: Fracking is Revitalizing U.S. Manufacturing
LSE Study: Fracking is Revitalizing U.S. ManufacturingLSE Study: Fracking is Revitalizing U.S. Manufacturing
LSE Study: Fracking is Revitalizing U.S. Manufacturing
 
Letter From 24 States Asking Trump & Congress to Withdraw the Unlawful Clean ...
Letter From 24 States Asking Trump & Congress to Withdraw the Unlawful Clean ...Letter From 24 States Asking Trump & Congress to Withdraw the Unlawful Clean ...
Letter From 24 States Asking Trump & Congress to Withdraw the Unlawful Clean ...
 
Report: New U.S. Power Costs: by County, with Environmental Externalities
Report: New U.S. Power Costs: by County, with Environmental ExternalitiesReport: New U.S. Power Costs: by County, with Environmental Externalities
Report: New U.S. Power Costs: by County, with Environmental Externalities
 
U.S. Crude Oil and Natural Gas Proved Reserves, Year-end 2015
U.S. Crude Oil and Natural Gas Proved Reserves, Year-end 2015U.S. Crude Oil and Natural Gas Proved Reserves, Year-end 2015
U.S. Crude Oil and Natural Gas Proved Reserves, Year-end 2015
 
U.S. EIA's Drilling Productivity Report - December 2015
U.S. EIA's Drilling Productivity Report - December 2015U.S. EIA's Drilling Productivity Report - December 2015
U.S. EIA's Drilling Productivity Report - December 2015
 
Velocys Plan to "Build the Business" - Gas-to-Liquids Plants
Velocys Plan to "Build the Business" - Gas-to-Liquids PlantsVelocys Plan to "Build the Business" - Gas-to-Liquids Plants
Velocys Plan to "Build the Business" - Gas-to-Liquids Plants
 
PA DEP Revised Permit for Natural Gas Compression Stations, Processing Plants...
PA DEP Revised Permit for Natural Gas Compression Stations, Processing Plants...PA DEP Revised Permit for Natural Gas Compression Stations, Processing Plants...
PA DEP Revised Permit for Natural Gas Compression Stations, Processing Plants...
 
PA DEP Permit for Unconventional NatGas Well Site Operations and Remote Piggi...
PA DEP Permit for Unconventional NatGas Well Site Operations and Remote Piggi...PA DEP Permit for Unconventional NatGas Well Site Operations and Remote Piggi...
PA DEP Permit for Unconventional NatGas Well Site Operations and Remote Piggi...
 
PA DEP: Methane Reduction Strategies for Natural Gas Operations
PA DEP: Methane Reduction Strategies for Natural Gas OperationsPA DEP: Methane Reduction Strategies for Natural Gas Operations
PA DEP: Methane Reduction Strategies for Natural Gas Operations
 
US EIA's December 2016 Short-Term Energy Outlook
US EIA's December 2016 Short-Term Energy OutlookUS EIA's December 2016 Short-Term Energy Outlook
US EIA's December 2016 Short-Term Energy Outlook
 
Northeast Gas Association's 2016 Statistical Guide
Northeast Gas Association's 2016 Statistical GuideNortheast Gas Association's 2016 Statistical Guide
Northeast Gas Association's 2016 Statistical Guide
 
PA PUC Responses to Auditor General's Act 13 Impact Fee Audit
PA PUC Responses to Auditor General's Act 13 Impact Fee AuditPA PUC Responses to Auditor General's Act 13 Impact Fee Audit
PA PUC Responses to Auditor General's Act 13 Impact Fee Audit
 
Pennsylvania Public Utility Commission Act 13/Impact Fees Audit by PA Auditor...
Pennsylvania Public Utility Commission Act 13/Impact Fees Audit by PA Auditor...Pennsylvania Public Utility Commission Act 13/Impact Fees Audit by PA Auditor...
Pennsylvania Public Utility Commission Act 13/Impact Fees Audit by PA Auditor...
 
Clyde Mine Discharge/Tenmile Creek Water Quality Final Report
Clyde Mine Discharge/Tenmile Creek Water Quality Final ReportClyde Mine Discharge/Tenmile Creek Water Quality Final Report
Clyde Mine Discharge/Tenmile Creek Water Quality Final Report
 
FERC Order Denying Stay of Kinder Morgan's Broad Run Expansion Project
FERC Order Denying Stay of Kinder Morgan's Broad Run Expansion ProjectFERC Order Denying Stay of Kinder Morgan's Broad Run Expansion Project
FERC Order Denying Stay of Kinder Morgan's Broad Run Expansion Project
 

Kürzlich hochgeladen

Opportunities, challenges, and power of media and information
Opportunities, challenges, and power of media and informationOpportunities, challenges, and power of media and information
Opportunities, challenges, and power of media and informationReyMonsales
 
Rohan Jaitley: Central Gov't Standing Counsel for Justice
Rohan Jaitley: Central Gov't Standing Counsel for JusticeRohan Jaitley: Central Gov't Standing Counsel for Justice
Rohan Jaitley: Central Gov't Standing Counsel for JusticeAbdulGhani778830
 
Top 10 Wealthiest People In The World.pdf
Top 10 Wealthiest People In The World.pdfTop 10 Wealthiest People In The World.pdf
Top 10 Wealthiest People In The World.pdfauroraaudrey4826
 
Manipur-Book-Final-2-compressed.pdfsal'rpk
Manipur-Book-Final-2-compressed.pdfsal'rpkManipur-Book-Final-2-compressed.pdfsal'rpk
Manipur-Book-Final-2-compressed.pdfsal'rpkbhavenpr
 
VIP Girls Available Call or WhatsApp 9711199012
VIP Girls Available Call or WhatsApp 9711199012VIP Girls Available Call or WhatsApp 9711199012
VIP Girls Available Call or WhatsApp 9711199012ankitnayak356677
 
complaint-ECI-PM-media-1-Chandru.pdfra;;prfk
complaint-ECI-PM-media-1-Chandru.pdfra;;prfkcomplaint-ECI-PM-media-1-Chandru.pdfra;;prfk
complaint-ECI-PM-media-1-Chandru.pdfra;;prfkbhavenpr
 
57 Bidens Annihilation Nation Policy.pdf
57 Bidens Annihilation Nation Policy.pdf57 Bidens Annihilation Nation Policy.pdf
57 Bidens Annihilation Nation Policy.pdfGerald Furnkranz
 
Global Terrorism and its types and prevention ppt.
Global Terrorism and its types and prevention ppt.Global Terrorism and its types and prevention ppt.
Global Terrorism and its types and prevention ppt.NaveedKhaskheli1
 
Quiz for Heritage Indian including all the rounds
Quiz for Heritage Indian including all the roundsQuiz for Heritage Indian including all the rounds
Quiz for Heritage Indian including all the roundsnaxymaxyy
 
Brief biography of Julius Robert Oppenheimer
Brief biography of Julius Robert OppenheimerBrief biography of Julius Robert Oppenheimer
Brief biography of Julius Robert OppenheimerOmarCabrera39
 
AP Election Survey 2024: TDP-Janasena-BJP Alliance Set To Sweep Victory
AP Election Survey 2024: TDP-Janasena-BJP Alliance Set To Sweep VictoryAP Election Survey 2024: TDP-Janasena-BJP Alliance Set To Sweep Victory
AP Election Survey 2024: TDP-Janasena-BJP Alliance Set To Sweep Victoryanjanibaddipudi1
 
IndiaWest: Your Trusted Source for Today's Global News
IndiaWest: Your Trusted Source for Today's Global NewsIndiaWest: Your Trusted Source for Today's Global News
IndiaWest: Your Trusted Source for Today's Global NewsIndiaWest2
 
Referendum Party 2024 Election Manifesto
Referendum Party 2024 Election ManifestoReferendum Party 2024 Election Manifesto
Referendum Party 2024 Election ManifestoSABC News
 

Kürzlich hochgeladen (13)

Opportunities, challenges, and power of media and information
Opportunities, challenges, and power of media and informationOpportunities, challenges, and power of media and information
Opportunities, challenges, and power of media and information
 
Rohan Jaitley: Central Gov't Standing Counsel for Justice
Rohan Jaitley: Central Gov't Standing Counsel for JusticeRohan Jaitley: Central Gov't Standing Counsel for Justice
Rohan Jaitley: Central Gov't Standing Counsel for Justice
 
Top 10 Wealthiest People In The World.pdf
Top 10 Wealthiest People In The World.pdfTop 10 Wealthiest People In The World.pdf
Top 10 Wealthiest People In The World.pdf
 
Manipur-Book-Final-2-compressed.pdfsal'rpk
Manipur-Book-Final-2-compressed.pdfsal'rpkManipur-Book-Final-2-compressed.pdfsal'rpk
Manipur-Book-Final-2-compressed.pdfsal'rpk
 
VIP Girls Available Call or WhatsApp 9711199012
VIP Girls Available Call or WhatsApp 9711199012VIP Girls Available Call or WhatsApp 9711199012
VIP Girls Available Call or WhatsApp 9711199012
 
complaint-ECI-PM-media-1-Chandru.pdfra;;prfk
complaint-ECI-PM-media-1-Chandru.pdfra;;prfkcomplaint-ECI-PM-media-1-Chandru.pdfra;;prfk
complaint-ECI-PM-media-1-Chandru.pdfra;;prfk
 
57 Bidens Annihilation Nation Policy.pdf
57 Bidens Annihilation Nation Policy.pdf57 Bidens Annihilation Nation Policy.pdf
57 Bidens Annihilation Nation Policy.pdf
 
Global Terrorism and its types and prevention ppt.
Global Terrorism and its types and prevention ppt.Global Terrorism and its types and prevention ppt.
Global Terrorism and its types and prevention ppt.
 
Quiz for Heritage Indian including all the rounds
Quiz for Heritage Indian including all the roundsQuiz for Heritage Indian including all the rounds
Quiz for Heritage Indian including all the rounds
 
Brief biography of Julius Robert Oppenheimer
Brief biography of Julius Robert OppenheimerBrief biography of Julius Robert Oppenheimer
Brief biography of Julius Robert Oppenheimer
 
AP Election Survey 2024: TDP-Janasena-BJP Alliance Set To Sweep Victory
AP Election Survey 2024: TDP-Janasena-BJP Alliance Set To Sweep VictoryAP Election Survey 2024: TDP-Janasena-BJP Alliance Set To Sweep Victory
AP Election Survey 2024: TDP-Janasena-BJP Alliance Set To Sweep Victory
 
IndiaWest: Your Trusted Source for Today's Global News
IndiaWest: Your Trusted Source for Today's Global NewsIndiaWest: Your Trusted Source for Today's Global News
IndiaWest: Your Trusted Source for Today's Global News
 
Referendum Party 2024 Election Manifesto
Referendum Party 2024 Election ManifestoReferendum Party 2024 Election Manifesto
Referendum Party 2024 Election Manifesto
 

Fracking Cuts US Carbon Emissions 19

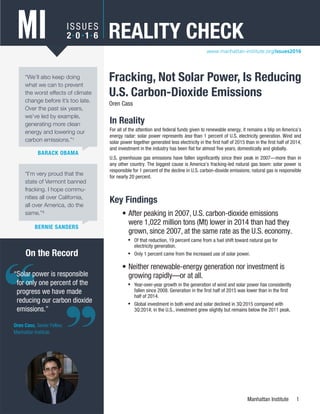
  • 1. Manhattan Institute 1 Reality Check: Fracking, Not Solar Power, Is Reducing U.S. Carbon-Dioxide Emissions Key Findings • After peaking in 2007, U.S. carbon-dioxide emissions were 1,022 million tons (Mt) lower in 2014 than had they grown, since 2007, at the same rate as the U.S. economy. ◆◆ Of that reduction, 19 percent came from a fuel shift toward natural gas for electricity generation. ◆◆ Only 1 percent came from the increased use of solar power. • Neither renewable-energy generation nor investment is growing rapidly—or at all. ◆◆ Year-over-year growth in the generation of wind and solar power has consistently fallen since 2008. Generation in the first half of 2015 was lower than in the first half of 2014. ◆◆ Global investment in both wind and solar declined in 3Q:2015 compared with 3Q:2014; in the U.S., investment grew slightly but remains below the 2011 peak. “Solar power is responsible for only one percent of the progress we have made reducing our carbon dioxide emissions.” Oren Cass, Senior Fellow, Manhattan Institute On the Record Fracking, Not Solar Power, Is Reducing U.S. Carbon-Dioxide Emissions Oren Cass ISSUES 2• 0 • 1• 6 REALITY CHECKMI BARACK OBAMA “We’ll also keep doing what we can to prevent the worst effects of climate change before it’s too late. Over the past six years, we’ve led by example, generating more clean energy and lowering our carbon emissions.”1 “I’m very proud that the state of Vermont banned fracking. I hope commu- nities all over California, all over America, do the same.”2 BERNIE SANDERS In Reality For all of the attention and federal funds given to renewable energy, it remains a blip on America’s energy radar: solar power represents less than 1 percent of U.S. electricity generation. Wind and solar power together generated less electricity in the first half of 2015 than in the first half of 2014, and investment in the industry has been flat for almost five years, domestically and globally. U.S. greenhouse gas emissions have fallen significantly since their peak in 2007—more than in any other country. The biggest cause is America’s fracking-led natural gas boom: solar power is responsible for 1 percent of the decline in U.S. carbon-dioxide emissions; natural gas is responsible for nearly 20 percent. www.manhattan-institute.org/issues2016
  • 2. Manhattan Institute 2 Reality Check: Fracking, Not Solar Power, Is Reducing U.S. Carbon-Dioxide Emissions The technology that has done most to reduce U.S. greenhouse gas emissions is fracking. In the past seven years, the fracking-led natural gas boom has cut U.S. emissions more than ten times as fast as solar power has. And while renewable technologies are making significant progress, growth in their investment and deployment is slowing dramatically. Anyone serious about reducing carbon-dioxide emissions should be celebrating fracking both in the U.S. and around the world.” Oren Cass, Senior Fellow, Manhattan Institute On the Record
  • 3. Manhattan Institute 3 Reality Check: Fracking, Not Solar Power, Is Reducing U.S. Carbon-Dioxide Emissions Renewable-energy technologies have achieved impressive gains in recent years; in particular, solar-panel costs have fallen dramatically.3 As a result, both wind and solar power now find a variety of applications where they make economic sense, sometimes even without a generous federal subsidy. They appear poised for continued progress and increasing deployment in years to come. However, the growth in electricity generation from these sources looks impressive only in percentage terms. Solar power contributed only 18 billion kilowatt-hours (kWh) to the 3,936 billion kWh generated by the U.S. electricity sector last year.4 As a result, the country’s massive investment in the technology has made virtually no dent in total emissions of carbon- dioxide—and will not make a significant dent for the foreseeable future. Conversely, the extraordinary technological progress that produced America’s natural gas boom has sent natural gas prices plummeting and has driven a substantial shift from coal to natural gas as the fuel generating U.S. electricity. Burning natural gas emits only about half as much carbon-dioxide as burning coal (and even smaller fractions of harmful air pollutants), so its increased use at the expense of coal reduces emissions.5 Fracking, the technique despised by environmentalists for extracting natural gas from shale, is reducing carbon-dioxide emissions much faster than renewable energy can.
  • 4. Manhattan Institute 4 Reality Check: Fracking, Not Solar Power, Is Reducing U.S. Carbon-Dioxide Emissions Energy Efficiency and Fracking—Not Wind and Solar—Are Reducing Carbon-Dioxide Emissions Without changes in the U.S. economy’s composition or technology, energy consumption would rise roughly in line with economic growth; and carbon-dioxide emissions would rise roughly in line with energy consumption. Lower emissions must be the result of either improved energy efficiency (less energy consumption per unit of economic output) or less carbon-intensive energy (less carbon-diox- ide per unit of energy consumption). From 2007 to 2014, U.S. GDP grew by 7.3 percent (constant dollars).6 U.S. emissions from energy consumption peaked at 6,001 megatons of carbon-dioxide (MtCO2 ) in 2007.Then, instead of growing by 7.3 percent, along with GDP, to 6,440 MtCO2 , emissions fell by 9.7 percent, to 5,417 MtCO2.7 How to explain this elimination of 1,022 MtCO2 of emissions?8 Of the reduction, 551 Mt (54 percent) came from electricity generation, 205 Mt (20 percent) came from motor-vehicle gasoline, and the remaining 266 Mt (26 percent) came from all other sources, including industrial uses, heating, and aviation. In the case of electricity, emissions fell from 2,425 Mt in 2007 to 2,051 Mt in 2014; had they risen in line with GDP growth, they would have risen to 2,602 Mt. The eliminated 551 Mt of emissions from electricity generation had three causes: • Efficiency. Electricity use, per dollar of GDP, declined by 8.4 percent, from 0.269 kWh/ dollar in 2007 to 0.247 in 2014.This alone would have reduced emissions from 2,602 Mt to 2,383 Mt. • Renewables. Zero-carbon electricity generation increased from 27.5 percent in 2007 to 32.3 percent in 2014.This alone would have reduced emissions from 2,602 Mt to 2,431 Mt. Solar power as a share of total electricity generation increased, from 0.02 percent in 2007 to 0.45 percent in 2014.This represented 9.2 percent of the total zero-carbon increase and, thus, 16 Mt of the 171 Mt reduction.The increase in wind power, from 0.9 percent to 4.6 percent, accounted for 135 Mt.The combined increase in hydroelectric, nuclear, and geothermal power would have contributed an additional 20 Mt reduction. • Fracking. Carbon-dioxide emissions per kWh of fossil-fuel-generated electricity de- clined by 7.9 percent—from 835 tCO2 per million kWh in 2007 to 769 in 2014—thanks to a ten-point shift in fuel mix, from 28 percent natural gas / 69 percent coal to 39 percent natural gas / 59 percent coal.9 This shift alone would have reduced emissions from 2,602 Mt to 2,397 Mt. Thus, credit for the total 1,022 Mt, accounting for covariance,10 goes to: In 2013, global carbon-dioxide emissions from fossil fuels totaled 36,131 Mt (the most recent year for which data are available),12 so the reduction achieved by U.S. solar power represented 0.04 percent of global emissions—or less than four hours’ worth. Energy efficiency (electricity) 203 Mt (20 percent) Fracking-driven natural gas increase (electricity) 190 Mt (19 percent) Wind power (electricity) 125 Mt (12 percent) Fuel efficiency (gasoline) 114 Mt (11 percent) Reduced vehicle-miles (gasoline) 91 Mt (9 percent) Nuclear, hydro, geothermal power (electricity) 19 Mt (2 percent) Solar power (electricity) 15 Mt (1 percent) Other (industrial, heating, aviation, etc.) 266 Mt (26 percent)11 This Picture Will Not Change Anytime Soon Notwithstanding frequent reports that renewable-energy production in the U.S. is “rising at an exponen- tial rate,”13 its growth has stalled. Since achieving a 60 percent year- over-year increase in 2008, growth in total wind and solar generation has been consistently slowing: 33 percent in 2009,28 percent in 2010, 27 percent in 2011, 19 percent in 2012, 22 percent in 2013, and 13 percent in 2014—the lowest since 2003. Total generation of wind and solar power actually fell in the first half of 2015 compared with the first half of 2014. Solar continued to grow, but the rate of growth fell by more than half, while wind genera- tion fell in absolute terms.14 The growth in new renewable-en- ergy investment has ended, too. In each of the first three quarters of 2015, global investment was below the equivalent quarter in 2014 and below the peak achieved in 2011.15 This slowdown has afflicted both solar and wind: in the third quarter of 2015,wind and solar investments declined from the third quarter of 2014.16 Production of solar panels leveled off in recent years as well, growing only 4 percent annually during 2011–13.17 In the U.S., 2015 investment is above the 2014 level but remains well below its 2011 peak.18 Headlines may continue to herald each new renewable installation as a paradigm shift. Analyst reports may continue to celebrate new, hy- pothetically low-cost, technologies. But energy observers who have to put their money where their mouths are will continue to take a much more cautious approach.
  • 5. Manhattan Institute 5 Reality Check: Fracking, Not Solar Power, Is Reducing U.S. Carbon-Dioxide Emissions 1 See https://www.whitehouse.gov/the-press-office/2015/10/24/weekly-address-protecting-our-planet-future- generations. 2 See https://www.youtube.com/watch?v=2qYzwDbBHZM. 3 See http://www.eia.gov/forecasts/aeo/electricity_generation.cfm. 4 See http://www.eia.gov/totalenergy/data/monthly/index.cfm#electricity (September 2015, table 7.2b). 5 See http://www.eia.gov/tools/faqs/faq.cfm?id=74t=11. This analysis does not include emissions generated by fuel sources or generation equipment during extraction and production processes. 6 See http://www.bea.gov/national/index.htm#gdp (current dollars and “real” GDP). 7 See http://www.eia.gov/totalenergy/data/monthly/index.cfm#environment (September 2015, table 12.6). 8 For data on allocating emissions reductions, see http://www.eia.gov/totalenergy/data/monthly/index.cfm (September 2015, tables 7.2b, 12.1, 12.6). 9 Improved efficiency of coal plants was not a factor in reducing emissions: carbon-dioxide emissions, per kWh of electricity generated from coal, changed less than 1 percent during 2007–14. 10 Because effects are overlapping (e.g., greater efficiency is “worth” less, in terms of emission reductions, when the electricity also comes from less carbon-intensive sources), the sum of individual effects within electricity-related reductions is larger than the 551 Mt total. Final shares of the total are allocated based on their relative sizes in isolation. 11 A significant share of this decrease also comes from increased use of natural gas, not counted in the electricity- specific fracking total. 12 See http://cdiac.ornl.gov/GCP/ (2014 Budget v1.1—includes cement production and flaring). 13 See http://www.bloomberg.com/news/articles/2015-10-06/solar-wind-reach-a-big-renewables-turning-point-bnef. 14 See http://www.eia.gov/totalenergy/data/monthly/index.cfm (September 2015, table 7.2b). 15 See http://about.bnef.com/content/uploads/sites/4/2015/10/2015-10-08-Clean-Energy-Investment-Q3-2015- factpack.pdf. 16 See http://www.bloomberg.com/news/articles/2015-10-08/renewables-shrug-off-slumping-oil-as-investment- remains-steady. 17 See http://www.eia.gov/todayinenergy/detail.cfm?id=22912. 18 See http://about.bnef.com/content/uploads/sites/4/2015/10/2015-10-08-Clean-Energy-Investment-Q3-2015-factpack.pdf. Endnotes