SlideShare ist ein Scribd-Unternehmen logo
1 von 7
Downloaden Sie, um offline zu lesen
Trends in Energy Production and Prices
03.03.2015 | Originally published here: ​http://goo.gl/d6nlmF
Natural gas and oil production has been increasing in the United States since 2009, while coal production has
been falling. Contributing to these national trends are the four states of the Federal Reserve’s Fourth
District—Kentucky, Ohio, Pennsylvania, and West Virginia—which together produce 14 percent of the nation’s
natural gas and 28 percent of its coal. Changes in production have coincided with falling prices in residential
natural gas and, more recently, gasoline prices. Some of these movements in production and prices have the
potential to benefit various sectors of the Fourth District economy.
Between 2009 and 2014, US natural gas production expanded by 21 percent. The Fourth District played a
significant role in this increase, with Pennsylvania’s output rising from 274 billion cubic feet in 2009 to 3,259 billion
cubic feet in 2013 (the most recent data available). Ohio and West Virginia also more than doubled their natural
gas output. In contrast, US coal production was down from 2009 to 2014, and Kentucky, Ohio, and West Virginia’s
production levels all declined. The most extreme change in production has been seen in oil drilling, with total US
output rising 59 percent from 2009 to 2014. Oil production in the Fourth District states jumped up by 158 percent
but represents just 1 percent of the national total.
Production of Natural Gas, Coal, and Oil in Fourth District States
Ohio Pennsylvania Kentucky West Virginia
2009 2013 2009 2013 2009 2013 2009 2013
Natural gas 88.8 186.2 273.9 3,259.0 113.3 94.7 264.4 717.9
Coal 27.7 23.3 59.1 59.9 107.8 79.0 137.2 112.2
Oil 4.9 14.0 3.0 6.2 2.6 3.3 1.5 7.5
Units: Natural gas: billions of cubic feet; Coal: millions of short tons; Oil: millions of barrels.
Source: US Energy Information Administration.
Federal Reserve Bank of Cleveland Page 1
Total US Production of Natural Gas, Coal, and Oil
2009 2013 2014
Natural gas 26,056.9 30,005.3 31,562.1
Coal 1,073.0 982.7 987.3
Oil 1,952.7 2,718.6 987.3
Units: Natural gas: billions of cubic feet; Coal: millions of short tons; Oil: millions of barrels.
Note: 2014 values are for December 2013–November 2014.
Source: US Energy Information Administration.
Turning from quantities to prices, oil, natural gas, and coal prices have taken disparate paths since 2009,
according to the three commonly cited national price measures for these commodities. Wholesale natural gas
prices declined during 2011, rose in 2012 and 2013, and fell in 2014. Coal prices have trended down since late
2010. Oil prices held steady after climbing out of their recession lows. All three prices declined during the last two
quarters of 2014. The decline has been the most pronounced for oil, at 54 percent between June and January.
Natural gas prices have fallen by 34 percent in these two quarters, and coal prices by 24 percent.
Federal Reserve Bank of Cleveland Page 2
We would expect movements in natural gas, oil, and coal prices to impact households through multiple channels
including electric and natural gas bills and gasoline prices at the pump. However, residential natural gas prices
have not followed the same down-up-up-down trend seen in the wholesale price. Rather, households have
experienced price declines over the course of the 2009-2014 period. Nationally, residential prices during the
heating season (the troughs on the chart below) declined by 19 percent between 2009 and January 2013,
dropping from $11.02 to $8.93 per thousand cubic feet. In Ohio the decrease was 35 percent over the four years,
while in Pennsylvania it was 25 percent. However, in every month of 2014, average residential prices were slightly
above those in 2013 for customers in Ohio, Pennsylvania, and the nation.
Federal Reserve Bank of Cleveland Page 3
Industrial customers have seen declining natural gas prices in Ohio but rising prices in Pennsylvania. The average
price during 2014 in Ohio was 25 percent lower than the average price during 2009. The Pennsylvania average in
2014 was 2 percent higher than the 2009 average. The national average price for industrial natural gas has
followed the wholesale price.
Federal Reserve Bank of Cleveland Page 4
The decline in residential natural gas prices from 2009 to 2013 could reflect the increase in supply. Utilities
customers are not seeing similar savings in their electricity rates. Despite falling prices for coal, electricity rates
have changed only slightly since 2009. Residential electricity rates were up 2 to 6 percent year-over-year during
every month in 2014.
Federal Reserve Bank of Cleveland Page 5
Gasoline prices have followed oil prices in their recent steep decline. The national average gasoline price
plummeted 43 percent from a recent peak of $3.69 per gallon in June 2014 to a low of $2.11 in January 2015.
We have seen that coal production and prices have both fallen, while natural gas production has risen and its price
movements have been mixed. Although many factors impact energy markets, substitution between the two fuels is
very likely part of the explanation for these trends. Approximately 94 percent of coal and 30 percent of natural gas
are used for electrical generation. Between 2009 and 2014, the megawatts generated with coal dropped by 150
million, an 8.6 percent decline. At the same, the megawatts generated with natural gas increased by 196 million, a
21 percent increase. If this substitution is driven by technological improvements in drilling that have made natural
gas less expensive to extract, the savings should eventually appear in electricity rates.
Federal Reserve Bank of Cleveland Page 6
Meet the Author
Christopher Vecchio
Christopher Vecchio is a research analyst in the Research Department of the Federal Reserve Bank of Cleveland. His primary
interests include development economics, international economics, and the economics of terrorism. Mr. Vecchio holds a
bachelor’s degree in economics from John Carroll University and a master’s degree in economics from Cleveland State University.
Stephan Whitaker
Stephan Whitaker is a research economist in the Research Department at the Federal Reserve Bank of Cleveland. His current
w ork includes research on housing markets and studies of state and local public finance. Dr. Whitaker earned his PhD in public
policy from the Harris School at the University of Chicago. He holds an MS in statistics from Colorado State University and a BA in
economics from Columbia University. Before earning his doctorate, Dr. Whitaker served as a lieutenant in the U.S. Air Force.
Federal Reserve Bank of Cleveland Page 7

Weitere ähnliche Inhalte

Was ist angesagt?

BP Statistical Review of World Energy 2012: Summary of 2011 data
BP Statistical Review of World Energy 2012: Summary of 2011 dataBP Statistical Review of World Energy 2012: Summary of 2011 data
BP Statistical Review of World Energy 2012: Summary of 2011 data
bp
 
Natural gas energy 790321
Natural gas energy 790321Natural gas energy 790321
Natural gas energy 790321
callsworld
 
The Energy Expenditure of the United States - The Importance of Energy
The Energy Expenditure of the United States - The Importance of EnergyThe Energy Expenditure of the United States - The Importance of Energy
The Energy Expenditure of the United States - The Importance of Energy
iakovosal
 
Inflation watch 10.25.11
Inflation watch 10.25.11Inflation watch 10.25.11
Inflation watch 10.25.11
REALTORS
 

Was ist angesagt? (19)

Bord Gáis Energy Index September 2015
Bord Gáis Energy Index September 2015Bord Gáis Energy Index September 2015
Bord Gáis Energy Index September 2015
 
BP Statistical Review of World Energy 2012: Summary of 2011 data
BP Statistical Review of World Energy 2012: Summary of 2011 dataBP Statistical Review of World Energy 2012: Summary of 2011 data
BP Statistical Review of World Energy 2012: Summary of 2011 data
 
Bord Gáis Energy Index December 2015
Bord Gáis Energy Index December 2015Bord Gáis Energy Index December 2015
Bord Gáis Energy Index December 2015
 
Aranca views - Shale Gas - the Next Cradle of Energy?
Aranca views - Shale Gas - the Next Cradle of Energy?Aranca views - Shale Gas - the Next Cradle of Energy?
Aranca views - Shale Gas - the Next Cradle of Energy?
 
Linkman | Infographic | Atradius | Gas Market Outlook
Linkman | Infographic | Atradius | Gas Market OutlookLinkman | Infographic | Atradius | Gas Market Outlook
Linkman | Infographic | Atradius | Gas Market Outlook
 
65th Annual BP Statistical Review of World Energy - June 2015
65th Annual BP Statistical Review of World Energy - June 201565th Annual BP Statistical Review of World Energy - June 2015
65th Annual BP Statistical Review of World Energy - June 2015
 
February 2014 energy index
February 2014 energy indexFebruary 2014 energy index
February 2014 energy index
 
An All-of-the-Above Energy Strategy as a Path to Sustainable Economic Growth
An All-of-the-Above Energy Strategy as a Path to Sustainable Economic GrowthAn All-of-the-Above Energy Strategy as a Path to Sustainable Economic Growth
An All-of-the-Above Energy Strategy as a Path to Sustainable Economic Growth
 
EIA Early Release of the 2014 Annual Energy Outlook
EIA Early Release of the 2014 Annual Energy OutlookEIA Early Release of the 2014 Annual Energy Outlook
EIA Early Release of the 2014 Annual Energy Outlook
 
Bord Gáis Energy Index October 2013
Bord Gáis Energy Index October 2013Bord Gáis Energy Index October 2013
Bord Gáis Energy Index October 2013
 
Bord Gáis Energy Index June 2013
Bord Gáis Energy Index June 2013Bord Gáis Energy Index June 2013
Bord Gáis Energy Index June 2013
 
World Energy Outlook 2012 - Factsheet
World Energy Outlook 2012 - FactsheetWorld Energy Outlook 2012 - Factsheet
World Energy Outlook 2012 - Factsheet
 
BP Statistical Review of World Energy 2017
BP Statistical Review of World Energy 2017BP Statistical Review of World Energy 2017
BP Statistical Review of World Energy 2017
 
Bord Gáis Energy Index November 2013
Bord Gáis Energy Index November 2013 Bord Gáis Energy Index November 2013
Bord Gáis Energy Index November 2013
 
Natural gas energy 790321
Natural gas energy 790321Natural gas energy 790321
Natural gas energy 790321
 
The Energy Expenditure of the United States - The Importance of Energy
The Energy Expenditure of the United States - The Importance of EnergyThe Energy Expenditure of the United States - The Importance of Energy
The Energy Expenditure of the United States - The Importance of Energy
 
Bord Gáis Energy Index May 2014
Bord Gáis Energy Index May 2014Bord Gáis Energy Index May 2014
Bord Gáis Energy Index May 2014
 
Inflation watch 10.25.11
Inflation watch 10.25.11Inflation watch 10.25.11
Inflation watch 10.25.11
 
EIA: Short-Term Energy and Winter Fuels Outlook
EIA: Short-Term Energy and Winter Fuels OutlookEIA: Short-Term Energy and Winter Fuels Outlook
EIA: Short-Term Energy and Winter Fuels Outlook
 

Andere mochten auch

Andere mochten auch (19)

Study of Methane Emissions in the Marcellus, Haynesville and Fayetteville Sha...
Study of Methane Emissions in the Marcellus, Haynesville and Fayetteville Sha...Study of Methane Emissions in the Marcellus, Haynesville and Fayetteville Sha...
Study of Methane Emissions in the Marcellus, Haynesville and Fayetteville Sha...
 
Report: LNG Exports are America's Once-in-a-Generation Opportunity
Report: LNG Exports are America's Once-in-a-Generation OpportunityReport: LNG Exports are America's Once-in-a-Generation Opportunity
Report: LNG Exports are America's Once-in-a-Generation Opportunity
 
NY Court of Appeals Decision in Walter R Beardslee v Inflection Energy
NY Court of Appeals Decision in Walter R Beardslee v Inflection EnergyNY Court of Appeals Decision in Walter R Beardslee v Inflection Energy
NY Court of Appeals Decision in Walter R Beardslee v Inflection Energy
 
Draft Revisions to PA Chapter 78 Oil & Gas Drilling Regulations
Draft Revisions to PA Chapter 78 Oil & Gas Drilling RegulationsDraft Revisions to PA Chapter 78 Oil & Gas Drilling Regulations
Draft Revisions to PA Chapter 78 Oil & Gas Drilling Regulations
 
EIA: Top 100 U.S. Oil and Gas Fields
EIA: Top 100 U.S. Oil and Gas FieldsEIA: Top 100 U.S. Oil and Gas Fields
EIA: Top 100 U.S. Oil and Gas Fields
 
EIA Drilling Productivity Report - Oct 2013
EIA Drilling Productivity Report - Oct 2013EIA Drilling Productivity Report - Oct 2013
EIA Drilling Productivity Report - Oct 2013
 
Report: Youth Perspectives on Marcellus Shale Gas Development: Community Chan...
Report: Youth Perspectives on Marcellus Shale Gas Development: Community Chan...Report: Youth Perspectives on Marcellus Shale Gas Development: Community Chan...
Report: Youth Perspectives on Marcellus Shale Gas Development: Community Chan...
 
Mountaineer XPress Project - Open Season & Project Information
Mountaineer XPress Project - Open Season & Project InformationMountaineer XPress Project - Open Season & Project Information
Mountaineer XPress Project - Open Season & Project Information
 
Is Marcellus Shale Frack Wastewater More Radioactive Than Previously Thought?
Is Marcellus Shale Frack Wastewater More Radioactive Than Previously Thought?Is Marcellus Shale Frack Wastewater More Radioactive Than Previously Thought?
Is Marcellus Shale Frack Wastewater More Radioactive Than Previously Thought?
 
2014 Marcellus and Utica Shale Databook - Vol. 3
2014 Marcellus and Utica Shale Databook - Vol. 32014 Marcellus and Utica Shale Databook - Vol. 3
2014 Marcellus and Utica Shale Databook - Vol. 3
 
Rex Energy Investor Presentation May 2015
Rex Energy Investor Presentation May 2015Rex Energy Investor Presentation May 2015
Rex Energy Investor Presentation May 2015
 
HSBC Report: Stranded assets - what's next?
HSBC Report: Stranded assets - what's next?HSBC Report: Stranded assets - what's next?
HSBC Report: Stranded assets - what's next?
 
Tuscarora Lateral Project - Open House Presentation on New 17-Mile Pipeline i...
Tuscarora Lateral Project - Open House Presentation on New 17-Mile Pipeline i...Tuscarora Lateral Project - Open House Presentation on New 17-Mile Pipeline i...
Tuscarora Lateral Project - Open House Presentation on New 17-Mile Pipeline i...
 
Executive Summary of EPA Draft Report on Fracking Impacts on Water Supplies -...
Executive Summary of EPA Draft Report on Fracking Impacts on Water Supplies -...Executive Summary of EPA Draft Report on Fracking Impacts on Water Supplies -...
Executive Summary of EPA Draft Report on Fracking Impacts on Water Supplies -...
 
Sunoco Logistics 1Q14 Analyst PowerPoint Presentation
Sunoco Logistics 1Q14 Analyst PowerPoint PresentationSunoco Logistics 1Q14 Analyst PowerPoint Presentation
Sunoco Logistics 1Q14 Analyst PowerPoint Presentation
 
Motion to Intervene in ET Rover Pipeline Application for Eminent Domain befor...
Motion to Intervene in ET Rover Pipeline Application for Eminent Domain befor...Motion to Intervene in ET Rover Pipeline Application for Eminent Domain befor...
Motion to Intervene in ET Rover Pipeline Application for Eminent Domain befor...
 
Siena College Research Institute NY Poll - Jan 11-15, 2015
Siena College Research Institute NY Poll - Jan 11-15, 2015Siena College Research Institute NY Poll - Jan 11-15, 2015
Siena College Research Institute NY Poll - Jan 11-15, 2015
 
Research: Welfare and Distributional Implications of Shale Gas
Research: Welfare and Distributional Implications of Shale GasResearch: Welfare and Distributional Implications of Shale Gas
Research: Welfare and Distributional Implications of Shale Gas
 
Presentation: Induced AC Interference, Corrosion & Mitigation
Presentation: Induced AC Interference, Corrosion & MitigationPresentation: Induced AC Interference, Corrosion & Mitigation
Presentation: Induced AC Interference, Corrosion & Mitigation
 

Ähnlich wie Federal Reserve Bank: Trends in Energy Production and Prices

The sleeping giant_-_when_energy_prices_awake_whitepaper
The sleeping giant_-_when_energy_prices_awake_whitepaperThe sleeping giant_-_when_energy_prices_awake_whitepaper
The sleeping giant_-_when_energy_prices_awake_whitepaper
Shannon Scheiwiller, MBA
 
Correlation of U.S. Gas Prices and National Oil Consumption
Correlation of U.S. Gas Prices and National Oil ConsumptionCorrelation of U.S. Gas Prices and National Oil Consumption
Correlation of U.S. Gas Prices and National Oil Consumption
bfalk1990
 
Correlation of U.S. Gas Prices and Yearly National Oil Consumption
Correlation of U.S. Gas Prices and Yearly National Oil ConsumptionCorrelation of U.S. Gas Prices and Yearly National Oil Consumption
Correlation of U.S. Gas Prices and Yearly National Oil Consumption
bfalk1990
 
2304 oil and gas-oil prices
2304 oil and gas-oil prices2304 oil and gas-oil prices
2304 oil and gas-oil prices
callsworld
 
2601 oil prices-crude oil
2601 oil prices-crude oil2601 oil prices-crude oil
2601 oil prices-crude oil
callsworld
 
429025 crude oil-ameratex
429025 crude oil-ameratex429025 crude oil-ameratex
429025 crude oil-ameratex
callsworld
 
Oil and natural gas natural gas 384400
Oil and natural gas natural gas 384400Oil and natural gas natural gas 384400
Oil and natural gas natural gas 384400
level3host
 
Energy crude oil-512656
Energy crude oil-512656Energy crude oil-512656
Energy crude oil-512656
level3host
 
784996 oil drilling oil and gas
784996 oil drilling oil and gas784996 oil drilling oil and gas
784996 oil drilling oil and gas
valenciastories
 
Petroleum natural gas 459684
Petroleum natural gas 459684Petroleum natural gas 459684
Petroleum natural gas 459684
level3host
 

Ähnlich wie Federal Reserve Bank: Trends in Energy Production and Prices (20)

Bp statistical-review-of-world-energy-2014-full-report
Bp statistical-review-of-world-energy-2014-full-reportBp statistical-review-of-world-energy-2014-full-report
Bp statistical-review-of-world-energy-2014-full-report
 
The US Coal Crash | Evidence for Structural Change
The US Coal Crash | Evidence for Structural ChangeThe US Coal Crash | Evidence for Structural Change
The US Coal Crash | Evidence for Structural Change
 
The sleeping giant_-_when_energy_prices_awake_whitepaper
The sleeping giant_-_when_energy_prices_awake_whitepaperThe sleeping giant_-_when_energy_prices_awake_whitepaper
The sleeping giant_-_when_energy_prices_awake_whitepaper
 
The sleeping giant_-_when_energy_prices_awake_whitepaper
The sleeping giant_-_when_energy_prices_awake_whitepaperThe sleeping giant_-_when_energy_prices_awake_whitepaper
The sleeping giant_-_when_energy_prices_awake_whitepaper
 
Gas Market
Gas MarketGas Market
Gas Market
 
Gas presentation
Gas presentationGas presentation
Gas presentation
 
Correlation of U.S. Gas Prices and National Oil Consumption
Correlation of U.S. Gas Prices and National Oil ConsumptionCorrelation of U.S. Gas Prices and National Oil Consumption
Correlation of U.S. Gas Prices and National Oil Consumption
 
Correlation of U.S. Gas Prices and Yearly National Oil Consumption
Correlation of U.S. Gas Prices and Yearly National Oil ConsumptionCorrelation of U.S. Gas Prices and Yearly National Oil Consumption
Correlation of U.S. Gas Prices and Yearly National Oil Consumption
 
Virtuous vs. vicious energy cycles
Virtuous vs. vicious energy cyclesVirtuous vs. vicious energy cycles
Virtuous vs. vicious energy cycles
 
Energy
EnergyEnergy
Energy
 
2304 oil and gas-oil prices
2304 oil and gas-oil prices2304 oil and gas-oil prices
2304 oil and gas-oil prices
 
2601 oil prices-crude oil
2601 oil prices-crude oil2601 oil prices-crude oil
2601 oil prices-crude oil
 
Electric utility fuel sources and prices
Electric utility fuel sources and pricesElectric utility fuel sources and prices
Electric utility fuel sources and prices
 
Deloitte: Oil and Gas Reality Check 2014
Deloitte: Oil and Gas Reality Check 2014Deloitte: Oil and Gas Reality Check 2014
Deloitte: Oil and Gas Reality Check 2014
 
Lecture 7
Lecture 7 Lecture 7
Lecture 7
 
429025 crude oil-ameratex
429025 crude oil-ameratex429025 crude oil-ameratex
429025 crude oil-ameratex
 
Oil and natural gas natural gas 384400
Oil and natural gas natural gas 384400Oil and natural gas natural gas 384400
Oil and natural gas natural gas 384400
 
Energy crude oil-512656
Energy crude oil-512656Energy crude oil-512656
Energy crude oil-512656
 
784996 oil drilling oil and gas
784996 oil drilling oil and gas784996 oil drilling oil and gas
784996 oil drilling oil and gas
 
Petroleum natural gas 459684
Petroleum natural gas 459684Petroleum natural gas 459684
Petroleum natural gas 459684
 

Mehr von Marcellus Drilling News

Mehr von Marcellus Drilling News (20)

Five facts about shale: it’s coming back, and coming back strong
Five facts about shale: it’s coming back, and coming back strongFive facts about shale: it’s coming back, and coming back strong
Five facts about shale: it’s coming back, and coming back strong
 
Quarterly legislative action update: Marcellus and Utica shale region (4Q16)
Quarterly legislative action update: Marcellus and Utica shale region (4Q16)Quarterly legislative action update: Marcellus and Utica shale region (4Q16)
Quarterly legislative action update: Marcellus and Utica shale region (4Q16)
 
Access Northeast Pipeline Project - Dec 2016 Update
Access Northeast Pipeline Project - Dec 2016 UpdateAccess Northeast Pipeline Project - Dec 2016 Update
Access Northeast Pipeline Project - Dec 2016 Update
 
Rover Pipeline Letter to FERC Requesting Final Certificate
Rover Pipeline Letter to FERC Requesting Final CertificateRover Pipeline Letter to FERC Requesting Final Certificate
Rover Pipeline Letter to FERC Requesting Final Certificate
 
DOE Order Granting Elba Island LNG Right to Export to Non-FTA Countries
DOE Order Granting Elba Island LNG Right to Export to Non-FTA CountriesDOE Order Granting Elba Island LNG Right to Export to Non-FTA Countries
DOE Order Granting Elba Island LNG Right to Export to Non-FTA Countries
 
LSE Study: Fracking is Revitalizing U.S. Manufacturing
LSE Study: Fracking is Revitalizing U.S. ManufacturingLSE Study: Fracking is Revitalizing U.S. Manufacturing
LSE Study: Fracking is Revitalizing U.S. Manufacturing
 
Letter From 24 States Asking Trump & Congress to Withdraw the Unlawful Clean ...
Letter From 24 States Asking Trump & Congress to Withdraw the Unlawful Clean ...Letter From 24 States Asking Trump & Congress to Withdraw the Unlawful Clean ...
Letter From 24 States Asking Trump & Congress to Withdraw the Unlawful Clean ...
 
Report: New U.S. Power Costs: by County, with Environmental Externalities
Report: New U.S. Power Costs: by County, with Environmental ExternalitiesReport: New U.S. Power Costs: by County, with Environmental Externalities
Report: New U.S. Power Costs: by County, with Environmental Externalities
 
U.S. Crude Oil and Natural Gas Proved Reserves, Year-end 2015
U.S. Crude Oil and Natural Gas Proved Reserves, Year-end 2015U.S. Crude Oil and Natural Gas Proved Reserves, Year-end 2015
U.S. Crude Oil and Natural Gas Proved Reserves, Year-end 2015
 
U.S. EIA's Drilling Productivity Report - December 2015
U.S. EIA's Drilling Productivity Report - December 2015U.S. EIA's Drilling Productivity Report - December 2015
U.S. EIA's Drilling Productivity Report - December 2015
 
Velocys Plan to "Build the Business" - Gas-to-Liquids Plants
Velocys Plan to "Build the Business" - Gas-to-Liquids PlantsVelocys Plan to "Build the Business" - Gas-to-Liquids Plants
Velocys Plan to "Build the Business" - Gas-to-Liquids Plants
 
PA DEP Revised Permit for Natural Gas Compression Stations, Processing Plants...
PA DEP Revised Permit for Natural Gas Compression Stations, Processing Plants...PA DEP Revised Permit for Natural Gas Compression Stations, Processing Plants...
PA DEP Revised Permit for Natural Gas Compression Stations, Processing Plants...
 
PA DEP Permit for Unconventional NatGas Well Site Operations and Remote Piggi...
PA DEP Permit for Unconventional NatGas Well Site Operations and Remote Piggi...PA DEP Permit for Unconventional NatGas Well Site Operations and Remote Piggi...
PA DEP Permit for Unconventional NatGas Well Site Operations and Remote Piggi...
 
PA DEP: Methane Reduction Strategies for Natural Gas Operations
PA DEP: Methane Reduction Strategies for Natural Gas OperationsPA DEP: Methane Reduction Strategies for Natural Gas Operations
PA DEP: Methane Reduction Strategies for Natural Gas Operations
 
US EIA's December 2016 Short-Term Energy Outlook
US EIA's December 2016 Short-Term Energy OutlookUS EIA's December 2016 Short-Term Energy Outlook
US EIA's December 2016 Short-Term Energy Outlook
 
Northeast Gas Association's 2016 Statistical Guide
Northeast Gas Association's 2016 Statistical GuideNortheast Gas Association's 2016 Statistical Guide
Northeast Gas Association's 2016 Statistical Guide
 
PA PUC Responses to Auditor General's Act 13 Impact Fee Audit
PA PUC Responses to Auditor General's Act 13 Impact Fee AuditPA PUC Responses to Auditor General's Act 13 Impact Fee Audit
PA PUC Responses to Auditor General's Act 13 Impact Fee Audit
 
Pennsylvania Public Utility Commission Act 13/Impact Fees Audit by PA Auditor...
Pennsylvania Public Utility Commission Act 13/Impact Fees Audit by PA Auditor...Pennsylvania Public Utility Commission Act 13/Impact Fees Audit by PA Auditor...
Pennsylvania Public Utility Commission Act 13/Impact Fees Audit by PA Auditor...
 
Clyde Mine Discharge/Tenmile Creek Water Quality Final Report
Clyde Mine Discharge/Tenmile Creek Water Quality Final ReportClyde Mine Discharge/Tenmile Creek Water Quality Final Report
Clyde Mine Discharge/Tenmile Creek Water Quality Final Report
 
FERC Order Denying Stay of Kinder Morgan's Broad Run Expansion Project
FERC Order Denying Stay of Kinder Morgan's Broad Run Expansion ProjectFERC Order Denying Stay of Kinder Morgan's Broad Run Expansion Project
FERC Order Denying Stay of Kinder Morgan's Broad Run Expansion Project
 

Kürzlich hochgeladen

Powerful Love Spells in Phoenix, AZ (310) 882-6330 Bring Back Lost Lover
Powerful Love Spells in Phoenix, AZ (310) 882-6330 Bring Back Lost LoverPowerful Love Spells in Phoenix, AZ (310) 882-6330 Bring Back Lost Lover
Powerful Love Spells in Phoenix, AZ (310) 882-6330 Bring Back Lost Lover
PsychicRuben LoveSpells
 

Kürzlich hochgeladen (20)

Powerful Love Spells in Phoenix, AZ (310) 882-6330 Bring Back Lost Lover
Powerful Love Spells in Phoenix, AZ (310) 882-6330 Bring Back Lost LoverPowerful Love Spells in Phoenix, AZ (310) 882-6330 Bring Back Lost Lover
Powerful Love Spells in Phoenix, AZ (310) 882-6330 Bring Back Lost Lover
 
Enjoy Night ≽ 8448380779 ≼ Call Girls In Palam Vihar (Gurgaon)
Enjoy Night ≽ 8448380779 ≼ Call Girls In Palam Vihar (Gurgaon)Enjoy Night ≽ 8448380779 ≼ Call Girls In Palam Vihar (Gurgaon)
Enjoy Night ≽ 8448380779 ≼ Call Girls In Palam Vihar (Gurgaon)
 
2024 02 15 AZ GOP LD4 Gen Meeting Minutes_FINAL_20240228.docx
2024 02 15 AZ GOP LD4 Gen Meeting Minutes_FINAL_20240228.docx2024 02 15 AZ GOP LD4 Gen Meeting Minutes_FINAL_20240228.docx
2024 02 15 AZ GOP LD4 Gen Meeting Minutes_FINAL_20240228.docx
 
China's soft power in 21st century .pptx
China's soft power in 21st century   .pptxChina's soft power in 21st century   .pptx
China's soft power in 21st century .pptx
 
Transformative Leadership: N Chandrababu Naidu and TDP's Vision for Innovatio...
Transformative Leadership: N Chandrababu Naidu and TDP's Vision for Innovatio...Transformative Leadership: N Chandrababu Naidu and TDP's Vision for Innovatio...
Transformative Leadership: N Chandrababu Naidu and TDP's Vision for Innovatio...
 
BDSM⚡Call Girls in Sector 143 Noida Escorts >༒8448380779 Escort Service
BDSM⚡Call Girls in Sector 143 Noida Escorts >༒8448380779 Escort ServiceBDSM⚡Call Girls in Sector 143 Noida Escorts >༒8448380779 Escort Service
BDSM⚡Call Girls in Sector 143 Noida Escorts >༒8448380779 Escort Service
 
30042024_First India Newspaper Jaipur.pdf
30042024_First India Newspaper Jaipur.pdf30042024_First India Newspaper Jaipur.pdf
30042024_First India Newspaper Jaipur.pdf
 
Verified Love Spells in Little Rock, AR (310) 882-6330 Get My Ex-Lover Back
Verified Love Spells in Little Rock, AR (310) 882-6330 Get My Ex-Lover BackVerified Love Spells in Little Rock, AR (310) 882-6330 Get My Ex-Lover Back
Verified Love Spells in Little Rock, AR (310) 882-6330 Get My Ex-Lover Back
 
1971 war india pakistan bangladesh liberation.ppt
1971 war india pakistan bangladesh liberation.ppt1971 war india pakistan bangladesh liberation.ppt
1971 war india pakistan bangladesh liberation.ppt
 
Enjoy Night⚡Call Girls Rajokri Delhi >༒8448380779 Escort Service
Enjoy Night⚡Call Girls Rajokri Delhi >༒8448380779 Escort ServiceEnjoy Night⚡Call Girls Rajokri Delhi >༒8448380779 Escort Service
Enjoy Night⚡Call Girls Rajokri Delhi >༒8448380779 Escort Service
 
Pakistan PMLN Election Manifesto 2024.pdf
Pakistan PMLN Election Manifesto 2024.pdfPakistan PMLN Election Manifesto 2024.pdf
Pakistan PMLN Election Manifesto 2024.pdf
 
Busty Desi⚡Call Girls in Sector 62 Noida Escorts >༒8448380779 Escort Service
Busty Desi⚡Call Girls in Sector 62 Noida Escorts >༒8448380779 Escort ServiceBusty Desi⚡Call Girls in Sector 62 Noida Escorts >༒8448380779 Escort Service
Busty Desi⚡Call Girls in Sector 62 Noida Escorts >༒8448380779 Escort Service
 
Enjoy Night ≽ 8448380779 ≼ Call Girls In Gurgaon Sector 46 (Gurgaon)
Enjoy Night ≽ 8448380779 ≼ Call Girls In Gurgaon Sector 46 (Gurgaon)Enjoy Night ≽ 8448380779 ≼ Call Girls In Gurgaon Sector 46 (Gurgaon)
Enjoy Night ≽ 8448380779 ≼ Call Girls In Gurgaon Sector 46 (Gurgaon)
 
Enjoy Night ≽ 8448380779 ≼ Call Girls In Gurgaon Sector 47 (Gurgaon)
Enjoy Night ≽ 8448380779 ≼ Call Girls In Gurgaon Sector 47 (Gurgaon)Enjoy Night ≽ 8448380779 ≼ Call Girls In Gurgaon Sector 47 (Gurgaon)
Enjoy Night ≽ 8448380779 ≼ Call Girls In Gurgaon Sector 47 (Gurgaon)
 
Julius Randle's Injury Status: Surgery Not Off the Table
Julius Randle's Injury Status: Surgery Not Off the TableJulius Randle's Injury Status: Surgery Not Off the Table
Julius Randle's Injury Status: Surgery Not Off the Table
 
WhatsApp 📞 8448380779 ✅Call Girls In Chaura Sector 22 ( Noida)
WhatsApp 📞 8448380779 ✅Call Girls In Chaura Sector 22 ( Noida)WhatsApp 📞 8448380779 ✅Call Girls In Chaura Sector 22 ( Noida)
WhatsApp 📞 8448380779 ✅Call Girls In Chaura Sector 22 ( Noida)
 
BDSM⚡Call Girls in Indirapuram Escorts >༒8448380779 Escort Service
BDSM⚡Call Girls in Indirapuram Escorts >༒8448380779 Escort ServiceBDSM⚡Call Girls in Indirapuram Escorts >༒8448380779 Escort Service
BDSM⚡Call Girls in Indirapuram Escorts >༒8448380779 Escort Service
 
Nara Chandrababu Naidu's Visionary Policies For Andhra Pradesh's Development
Nara Chandrababu Naidu's Visionary Policies For Andhra Pradesh's DevelopmentNara Chandrababu Naidu's Visionary Policies For Andhra Pradesh's Development
Nara Chandrababu Naidu's Visionary Policies For Andhra Pradesh's Development
 
Nurturing Families, Empowering Lives: TDP's Vision for Family Welfare in Andh...
Nurturing Families, Empowering Lives: TDP's Vision for Family Welfare in Andh...Nurturing Families, Empowering Lives: TDP's Vision for Family Welfare in Andh...
Nurturing Families, Empowering Lives: TDP's Vision for Family Welfare in Andh...
 
Enjoy Night⚡Call Girls Iffco Chowk Gurgaon >༒8448380779 Escort Service
Enjoy Night⚡Call Girls Iffco Chowk Gurgaon >༒8448380779 Escort ServiceEnjoy Night⚡Call Girls Iffco Chowk Gurgaon >༒8448380779 Escort Service
Enjoy Night⚡Call Girls Iffco Chowk Gurgaon >༒8448380779 Escort Service
 

Federal Reserve Bank: Trends in Energy Production and Prices

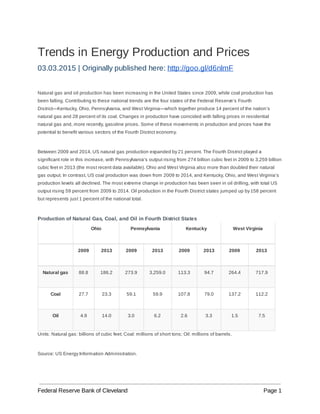
  • 1. Trends in Energy Production and Prices 03.03.2015 | Originally published here: ​http://goo.gl/d6nlmF Natural gas and oil production has been increasing in the United States since 2009, while coal production has been falling. Contributing to these national trends are the four states of the Federal Reserve’s Fourth District—Kentucky, Ohio, Pennsylvania, and West Virginia—which together produce 14 percent of the nation’s natural gas and 28 percent of its coal. Changes in production have coincided with falling prices in residential natural gas and, more recently, gasoline prices. Some of these movements in production and prices have the potential to benefit various sectors of the Fourth District economy. Between 2009 and 2014, US natural gas production expanded by 21 percent. The Fourth District played a significant role in this increase, with Pennsylvania’s output rising from 274 billion cubic feet in 2009 to 3,259 billion cubic feet in 2013 (the most recent data available). Ohio and West Virginia also more than doubled their natural gas output. In contrast, US coal production was down from 2009 to 2014, and Kentucky, Ohio, and West Virginia’s production levels all declined. The most extreme change in production has been seen in oil drilling, with total US output rising 59 percent from 2009 to 2014. Oil production in the Fourth District states jumped up by 158 percent but represents just 1 percent of the national total. Production of Natural Gas, Coal, and Oil in Fourth District States Ohio Pennsylvania Kentucky West Virginia 2009 2013 2009 2013 2009 2013 2009 2013 Natural gas 88.8 186.2 273.9 3,259.0 113.3 94.7 264.4 717.9 Coal 27.7 23.3 59.1 59.9 107.8 79.0 137.2 112.2 Oil 4.9 14.0 3.0 6.2 2.6 3.3 1.5 7.5 Units: Natural gas: billions of cubic feet; Coal: millions of short tons; Oil: millions of barrels. Source: US Energy Information Administration. Federal Reserve Bank of Cleveland Page 1
  • 2. Total US Production of Natural Gas, Coal, and Oil 2009 2013 2014 Natural gas 26,056.9 30,005.3 31,562.1 Coal 1,073.0 982.7 987.3 Oil 1,952.7 2,718.6 987.3 Units: Natural gas: billions of cubic feet; Coal: millions of short tons; Oil: millions of barrels. Note: 2014 values are for December 2013–November 2014. Source: US Energy Information Administration. Turning from quantities to prices, oil, natural gas, and coal prices have taken disparate paths since 2009, according to the three commonly cited national price measures for these commodities. Wholesale natural gas prices declined during 2011, rose in 2012 and 2013, and fell in 2014. Coal prices have trended down since late 2010. Oil prices held steady after climbing out of their recession lows. All three prices declined during the last two quarters of 2014. The decline has been the most pronounced for oil, at 54 percent between June and January. Natural gas prices have fallen by 34 percent in these two quarters, and coal prices by 24 percent. Federal Reserve Bank of Cleveland Page 2
  • 3. We would expect movements in natural gas, oil, and coal prices to impact households through multiple channels including electric and natural gas bills and gasoline prices at the pump. However, residential natural gas prices have not followed the same down-up-up-down trend seen in the wholesale price. Rather, households have experienced price declines over the course of the 2009-2014 period. Nationally, residential prices during the heating season (the troughs on the chart below) declined by 19 percent between 2009 and January 2013, dropping from $11.02 to $8.93 per thousand cubic feet. In Ohio the decrease was 35 percent over the four years, while in Pennsylvania it was 25 percent. However, in every month of 2014, average residential prices were slightly above those in 2013 for customers in Ohio, Pennsylvania, and the nation. Federal Reserve Bank of Cleveland Page 3
  • 4. Industrial customers have seen declining natural gas prices in Ohio but rising prices in Pennsylvania. The average price during 2014 in Ohio was 25 percent lower than the average price during 2009. The Pennsylvania average in 2014 was 2 percent higher than the 2009 average. The national average price for industrial natural gas has followed the wholesale price. Federal Reserve Bank of Cleveland Page 4
  • 5. The decline in residential natural gas prices from 2009 to 2013 could reflect the increase in supply. Utilities customers are not seeing similar savings in their electricity rates. Despite falling prices for coal, electricity rates have changed only slightly since 2009. Residential electricity rates were up 2 to 6 percent year-over-year during every month in 2014. Federal Reserve Bank of Cleveland Page 5
  • 6. Gasoline prices have followed oil prices in their recent steep decline. The national average gasoline price plummeted 43 percent from a recent peak of $3.69 per gallon in June 2014 to a low of $2.11 in January 2015. We have seen that coal production and prices have both fallen, while natural gas production has risen and its price movements have been mixed. Although many factors impact energy markets, substitution between the two fuels is very likely part of the explanation for these trends. Approximately 94 percent of coal and 30 percent of natural gas are used for electrical generation. Between 2009 and 2014, the megawatts generated with coal dropped by 150 million, an 8.6 percent decline. At the same, the megawatts generated with natural gas increased by 196 million, a 21 percent increase. If this substitution is driven by technological improvements in drilling that have made natural gas less expensive to extract, the savings should eventually appear in electricity rates. Federal Reserve Bank of Cleveland Page 6
  • 7. Meet the Author Christopher Vecchio Christopher Vecchio is a research analyst in the Research Department of the Federal Reserve Bank of Cleveland. His primary interests include development economics, international economics, and the economics of terrorism. Mr. Vecchio holds a bachelor’s degree in economics from John Carroll University and a master’s degree in economics from Cleveland State University. Stephan Whitaker Stephan Whitaker is a research economist in the Research Department at the Federal Reserve Bank of Cleveland. His current w ork includes research on housing markets and studies of state and local public finance. Dr. Whitaker earned his PhD in public policy from the Harris School at the University of Chicago. He holds an MS in statistics from Colorado State University and a BA in economics from Columbia University. Before earning his doctorate, Dr. Whitaker served as a lieutenant in the U.S. Air Force. Federal Reserve Bank of Cleveland Page 7