Maine Governor Survey Release 102714

This memorandum is a summary of an automated survey of 869 likely voters in Maine. The survey was fielded October 23rd and 24th and has a margin of error of +/- 3.32% at the 95% confidence level. The survey finds Republican Governor Paul LePage and Democrat Mike Michaud in a statistical tie with one week to go before Election Day. Among all voters, Paul LePage has 42.3% support; Mike Michaud has 41.6%, and independent candidate Eliot Cutler has 13.2% support. Among all male voters Paul LePage leads Mike Michaud by 3 points, 43% to 40% respectively, and among all female voters Mike Michaud leads by 1 point, 43% to 42% respectively. Independent Eliot Cutler’s strongest base of support is among married men and independent voters, with 16%. The image ratings of both Paul LePage and Mike Michaud are very similar. Among all voters, 47% have a favorable opinion of Mike Michaud and 46% have an unfavorable opinion of him. For Paul LePage 48% of voters have a favorable opinion of him and 47% have an unfavorable opinion of him. The following table shows the ballot test by voter subgroup.

Empfohlen
Empfohlen
Weitere ähnliche Inhalte
Was ist angesagt?
Was ist angesagt? (19)
Andere mochten auch
Ähnlich wie Maine Governor Survey Release 102714
Ähnlich wie Maine Governor Survey Release 102714 (20)
Mehr von Magellan Strategies
Mehr von Magellan Strategies (17)
Kürzlich hochgeladen
Kürzlich hochgeladen (20)
Maine Governor Survey Release 102714
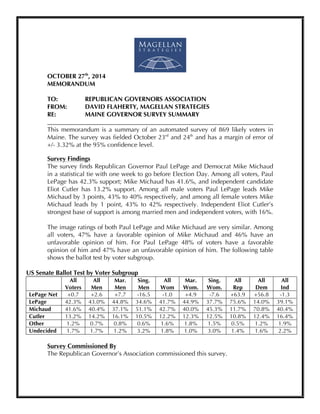
- 1. ! OCTOBER 27th, 2014 MEMORANDUM TO: REPUBLICAN GOVERNORS ASSOCIATION FROM: DAVID FLAHERTY, MAGELLAN STRATEGIES RE: MAINE GOVERNOR SURVEY SUMMARY ________________________________________________________________________ This memorandum is a summary of an automated survey of 869 likely voters in Maine. The survey was fielded October 23rd and 24th and has a margin of error of +/- 3.32% at the 95% confidence level. Survey Findings The survey finds Republican Governor Paul LePage and Democrat Mike Michaud in a statistical tie with one week to go before Election Day. Among all voters, Paul LePage has 42.3% support; Mike Michaud has 41.6%, and independent candidate Eliot Cutler has 13.2% support. Among all male voters Paul LePage leads Mike Michaud by 3 points, 43% to 40% respectively, and among all female voters Mike Michaud leads by 1 point, 43% to 42% respectively. Independent Eliot Cutler’s strongest base of support is among married men and independent voters, with 16%. The image ratings of both Paul LePage and Mike Michaud are very similar. Among all voters, 47% have a favorable opinion of Mike Michaud and 46% have an unfavorable opinion of him. For Paul LePage 48% of voters have a favorable opinion of him and 47% have an unfavorable opinion of him. The following table shows the ballot test by voter subgroup. US Senate Ballot Test by Voter Subgroup All Voters All Men Mar. Men Sing. Men All Wom Mar. Wom. Sing. Wom. All Rep All Dem All Ind LePage Net +0.7 +2.6 +7.7 -16.5 -1.0 +4.9 -7.6 +63.9 +56.8 -1.3 LePage 42.3% 43.0% 44.8% 34.6% 41.7% 44.9% 37.7% 75.6% 14.0% 39.1% Michaud 41.6% 40.4% 37.1% 51.1% 42.7% 40.0% 45.3% 11.7% 70.8% 40.4% Cutler 13.2% 14.2% 16.1% 10.5% 12.2% 12.3% 12.5% 10.8% 12.4% 16.4% Other 1.2% 0.7% 0.8% 0.6% 1.6% 1.8% 1.5% 0.5% 1.2% 1.9% Undecided 1.7% 1.7% 1.2% 3.2% 1.8% 1.0% 3.0% 1.4% 1.6% 2.2% Survey Commissioned By The Republican Governor’s Association commissioned this survey.
- 2. Magellan Strategies Maine Governor Survey Summary 869n, MoE +/- 3.32%, October 23rd – 24th, 2014 Magellan Strategies |1685 Boxelder Street, Suite 300 | Louisville, CO 80027 MagellanStrategies.com | 303-861-8585 2 Survey Methodology This survey was conducted using automated voice recorded technology. The sample for this survey was randomly drawn from a Maine voter file. The results were weighted based upon past voter demographics of the non-Presidential voting population in Maine. Any questions regarding the methodology of this survey should be directed to David Flaherty of Magellan Strategies at dflaherty@magellanstrategies.com or 303-861-8585. The survey toplines and crosstabs are included in this document.
- 3. !!!!! Maine General Election Survey Topline Results Magellan Strategies are pleased to present the topline results for an 869n autodial survey of likely general election voters in the state of Maine. The interviews were conducted October 23rd and 24th, 2014. This survey has a margin of error of +/- 3.32% at the 95 percent confidence interval. This survey was weighted based upon past general election voting demographics. T1. Are you registered to vote as a Republican, a Democrat, an independent, or are you not registered to vote? Democrat ................................................................ 35% Republican .............................................................. 33% Independent ............................................................ 32% T2. How likely are you to vote in the upcoming November general election? Extremely likely ....................................................... 94% Very likely ................................................................. 5% Somewhat likely ........................................................ 1% T3. Do you have a favorable or unfavorable opinion of Mike Michaud? Favorable ................................................................ 47% Unfavorable ............................................................ 46% Heard of, No Opinion ............................................... 7% Never Heard of ......................................................... 0% Name ID ............................................................... 100% Hard Name ID ........................................................ 93%
- 4. Magellan ID#: MEGEN-102314 Maine General Election Survey Topline Results Field Dates: 10/23/14 – 10/24/14, MoE +/- 3.32%, 869n, CONFIDENTIAL Magellan Strategies | 1685 Boxelder St. Suite 300 | Louisville, CO 80027 www.MagellanStrategies.com | (303) 861-8585 2 T4. Do you have a favorable or unfavorable opinion of Paul LePage? Favorable ................................................................ 48% Unfavorable ............................................................ 47% Heard of, No Opinion ............................................... 5% Never Heard of ......................................................... 0% Name ID ............................................................... 100% Hard Name ID ........................................................ 95% T5. Do you have a favorable or unfavorable opinion of Eliot Cutler? Favorable ................................................................ 36% Unfavorable ............................................................ 47% Heard of, No Opinion ............................................. 16% Never Heard of ......................................................... 1% Name ID ................................................................. 99% Hard Name ID ........................................................ 83% T6. If the election for Governor were being held today, for whom would you vote if the candidates were Mike Michaud, Democrat, Paul LePage, Republican, and Eliot Cutler, Independent? Paul LePage ............................................................ 42% Mike Michaud ......................................................... 42% Eliot Cutler .............................................................. 13% Other Candidate ....................................................... 1% Undecided ................................................................ 2% T7. Do you consider yourself to be conservative, moderate or liberal in your political beliefs? Conservative ........................................................... 35% Moderate ................................................................ 45% Liberal ..................................................................... 17% Unsure or No Opinion .............................................. 3% T8. For statistical purposes, are you a man or a woman? Woman ................................................................... 52% Man ........................................................................ 48%
- 5. Magellan ID#: MEGEN-102314 Maine General Election Survey Topline Results Field Dates: 10/23/14 – 10/24/14, MoE +/- 3.32%, 869n, CONFIDENTIAL Magellan Strategies | 1685 Boxelder St. Suite 300 | Louisville, CO 80027 www.MagellanStrategies.com | (303) 861-8585 3 T9. Which of the following age groups applies to you? 18-29 ........................................................................ 7% 30-44 ...................................................................... 17% 45-54 ...................................................................... 21% 55-64 ...................................................................... 24% 65+ ......................................................................... 31% Unsure or no opinion ................................................ 0% T10. What is your marital status? Married ................................................................... 63% Widowed ................................................................ 13% Single, never been married ........................................ 8% Divorced ................................................................... 8% Unmarried living with partner ................................... 3% Separated .................................................................. 2% Unsure or no opinion ................................................ 3% Survey Methodology This survey was conducted using automated telephone touchtone technology. The sample used for this survey was randomly drawn from a Maine voter file. The survey response data was weighted based upon past general election voting demographics. The interviews were conducted on October 23rd and 24th, 2014. Three attempts were made to interview each household in the sample. This survey has a margin of error of 3.32% at the 95 percent confidence interval.
- 6. Maine General Election Survey, October 23rd - 24th, 2014, 869N, 3.32% MoE, Weighted Results, Magellan Strategies, 1685 Boxelder St. Suite 300, Louisville, CO 80027, 303-861-8585 Table 2-1 T1. Are you registered to vote as a Republican, a Democrat, an independent, or are you not registered to vote? GENDER~MARITAL AGE REPUBLICANS DEMOCRATS INDEPENDENTS ----------------------------------------------------------------- ------------------------------------------------------ ------------------------------- ------------------------------- ------------------------------- TOTAL --------- MEN --------- MARR MEN -------- SING MEN --------- WOM --------- MARR WOM -------- SING WOM --------- 18-29 --------- 30-44 -------- 45-54 --------- 55-64 --------- 65 PLUS -------- REP TOT --------- REP MEN -------- REP WOM --------- DEM TOT --------- DEM MEN -------- DEM WOM --------- IND TOT --------- IND MEN -------- IND WOM --------- TOTAL 869 100.0 426 100.0 293 100.0 118 100.0 443 100.0 259 100.0 177 100.0 61 100.0 148 100.0 182 100.0 209 100.0 265 100.0 287 100.0 140 100.0 147 100.0 304 100.0 119 100.0 185 100.0 278 100.0 167 100.0 111 100.0 DEMOCRAT 304 35.0 119 27.9 79 27.1 36 30.7 185 41.8 107 41.2 76 43.0 15 25.3 36 24.6 60 32.7 75 36.0 117 44.0 304 100.0 119 100.0 185 100.0 REPUBLICAN 287 33.0 140 32.9 115 39.2 24 20.6 147 33.1 94 36.5 52 29.2 11 18.8 56 37.9 69 37.9 62 29.6 86 32.5 287 100.0 140 100.0 147 100.0 INDEPENDENT 278 32.0 167 39.3 99 33.8 57 48.7 111 25.0 58 22.4 49 27.8 34 56.0 55 37.5 54 29.4 72 34.4 62 23.5 278 100.0 167 100.0 111 100.0
- 7. Maine General Election Survey, October 23rd - 24th, 2014, 869N, 3.32% MoE, Weighted Results, Magellan Strategies, 1685 Boxelder St. Suite 300, Louisville, CO 80027, 303-861-8585 Table 3-1 T2. How likely are you to vote in the upcoming November election? GENDER~MARITAL AGE REPUBLICANS DEMOCRATS INDEPENDENTS ----------------------------------------------------------------- ------------------------------------------------------ ------------------------------- ------------------------------- ------------------------------- TOTAL --------- MEN --------- MARR MEN -------- SING MEN --------- WOM --------- MARR WOM -------- SING WOM --------- 18-29 --------- 30-44 -------- 45-54 --------- 55-64 --------- 65 PLUS -------- REP TOT --------- REP MEN -------- REP WOM --------- DEM TOT --------- DEM MEN -------- DEM WOM --------- IND TOT --------- IND MEN -------- IND WOM --------- TOTAL 869 100.0 426 100.0 293 100.0 118 100.0 443 100.0 259 100.0 177 100.0 61 100.0 148 100.0 182 100.0 209 100.0 265 100.0 287 100.0 140 100.0 147 100.0 304 100.0 119 100.0 185 100.0 278 100.0 167 100.0 111 100.0 EXTREMELY LIKELY 812 93.5 400 93.9 285 97.3 103 88.0 412 93.1 244 94.0 163 91.7 52 85.8 140 94.6 172 94.0 201 96.3 244 92.2 272 94.8 135 96.4 137 93.3 280 92.1 111 93.3 169 91.4 260 93.5 154 92.1 106 95.6 VERY LIKELY 44 5.0 16 3.8 4 1.2 8 7.0 28 6.2 14 5.5 13 7.5 3 5.5 8 5.4 11 6.0 6 2.7 15 5.7 14 4.9 4 3.2 10 6.5 19 6.4 6 4.6 14 7.5 10 3.7 6 3.6 4 3.7 SOMEWHAT LIKELY 13 1.5 10 2.4 4 1.5 6 4.9 3 0.7 1 0.5 1 0.8 5 8.6 2 1.1 6 2.2 1 0.3 1 0.4 0.2 4 1.5 2 2.0 2 1.1 8 2.8 7 4.2 1 0.7
- 8. Maine General Election Survey, October 23rd - 24th, 2014, 869N, 3.32% MoE, Weighted Results, Magellan Strategies, 1685 Boxelder St. Suite 300, Louisville, CO 80027, 303-861-8585 Table 4-1 T3. Do you have a favorable or unfavorable opinion of Mike Michaud? GENDER~MARITAL AGE REPUBLICANS DEMOCRATS INDEPENDENTS ----------------------------------------------------------------- ------------------------------------------------------ ------------------------------- ------------------------------- ------------------------------- TOTAL --------- MEN --------- MARR MEN -------- SING MEN --------- WOM --------- MARR WOM -------- SING WOM --------- 18-29 --------- 30-44 -------- 45-54 --------- 55-64 --------- 65 PLUS -------- REP TOT --------- REP MEN -------- REP WOM --------- DEM TOT --------- DEM MEN -------- DEM WOM --------- IND TOT --------- IND MEN -------- IND WOM --------- TOTAL 869 100.0 426 100.0 293 100.0 118 100.0 443 100.0 259 100.0 177 100.0 61 100.0 148 100.0 182 100.0 209 100.0 265 100.0 287 100.0 140 100.0 147 100.0 304 100.0 119 100.0 185 100.0 278 100.0 167 100.0 111 100.0 FAVORABLE 408 47.0 194 45.6 126 42.9 65 54.9 214 48.3 115 44.4 94 52.8 21 35.1 69 46.4 75 41.3 105 50.2 138 52.1 46 16.0 17 12.2 29 19.6 232 76.2 94 78.8 138 74.6 130 46.9 84 50.1 47 42.1 UNFAVORABLE 396 45.5 214 50.2 155 53.0 47 40.3 182 41.1 118 45.6 63 35.4 32 51.9 75 50.5 94 51.8 87 41.6 105 39.6 215 74.9 116 82.8 99 67.4 65 21.3 23 19.3 42 22.7 116 41.7 75 44.8 41 36.9 HEARD OF NO OPINION 61 7.1 17 4.1 12 4.0 6 4.8 44 10.0 23 8.8 21 11.8 5 7.8 5 3.1 13 6.9 17 8.1 21 8.1 26 9.1 7 5.0 19 13.0 7 2.4 2 2.0 5 2.7 28 10.1 8 4.8 20 18.2 NEVER HEARD OF 4 0.4 1 0.1 1 0.2 3 0.7 3 1.2 3 5.2 1 0.2 4 1.3 1 0.3 3 2.8 NAME ID 865 99.6 425 99.9 292 99.8 118 100.0 440 99.3 256 98.8 177 100.0 58 94.8 148 100.0 182 100.0 209 100.0 264 99.8 287 100.0 140 100.0 147 100.0 304 100.0 119 100.0 185 100.0 274 98.7 167 99.7 108 97.2 HARD NAME ID 804 92.5 408 95.8 281 95.8 112 95.2 396 89.3 233 90.0 157 88.2 53 87.0 143 96.9 170 93.1 192 91.9 243 91.7 261 90.9 133 95.0 128 87.0 297 97.6 116 98.0 180 97.3 246 88.5 159 94.9 88 79.0
- 9. Maine General Election Survey, October 23rd - 24th, 2014, 869N, 3.32% MoE, Weighted Results, Magellan Strategies, 1685 Boxelder St. Suite 300, Louisville, CO 80027, 303-861-8585 Table 5-1 T4. Do you have a favorable or unfavorable opinion of Paul LePage? GENDER~MARITAL AGE REPUBLICANS DEMOCRATS INDEPENDENTS ----------------------------------------------------------------- ------------------------------------------------------ ------------------------------- ------------------------------- ------------------------------- TOTAL --------- MEN --------- MARR MEN -------- SING MEN --------- WOM --------- MARR WOM -------- SING WOM --------- 18-29 --------- 30-44 -------- 45-54 --------- 55-64 --------- 65 PLUS -------- REP TOT --------- REP MEN -------- REP WOM --------- DEM TOT --------- DEM MEN -------- DEM WOM --------- IND TOT --------- IND MEN -------- IND WOM --------- TOTAL 869 100.0 426 100.0 293 100.0 118 100.0 443 100.0 259 100.0 177 100.0 61 100.0 148 100.0 182 100.0 209 100.0 265 100.0 287 100.0 140 100.0 147 100.0 304 100.0 119 100.0 185 100.0 278 100.0 167 100.0 111 100.0 FAVORABLE 421 48.4 217 51.0 154 52.5 52 43.9 203 45.9 123 47.6 78 44.2 41 66.6 88 59.2 94 51.4 82 39.3 113 42.5 234 81.5 120 86.0 113 77.3 53 17.3 19 15.7 34 18.3 134 48.3 78 46.9 56 50.5 UNFAVORABLE 409 47.1 189 44.3 132 44.9 54 45.6 220 49.7 128 49.4 88 49.6 17 27.5 58 39.5 81 44.1 116 55.7 137 51.8 46 15.9 20 14.0 26 17.7 234 77.0 88 74.2 146 78.7 129 46.5 81 48.4 48 43.7 HEARD OF NO OPINION 37 4.3 20 4.6 8 2.6 12 10.1 18 4.0 6 2.4 11 6.2 4 5.9 2 1.3 8 4.5 10 4.6 14 5.3 6 2.2 6 4.3 17 5.4 12 9.7 5 2.7 14 5.2 8 4.8 6 5.9 NEVER HEARD OF 2 0.2 0.1 0.4 1 0.3 1 0.5 1 0.5 1 0.3 1 0.3 1 0.6 1 0.3 0.4 0.3 NAME ID 867 99.8 425 99.9 293 100.0 117 99.6 442 99.7 258 99.5 177 100.0 61 100.0 148 100.0 182 100.0 208 99.5 264 99.7 286 99.7 140 100.0 146 99.4 303 99.7 118 99.6 185 99.7 278 100.0 167 100.0 111 100.0 HARD NAME ID 830 95.5 406 95.3 285 97.4 105 89.5 424 95.6 251 97.0 166 93.8 57 94.1 146 98.7 174 95.5 198 94.9 250 94.4 279 97.4 140 100.0 139 95.0 287 94.2 107 89.9 180 97.0 264 94.8 159 95.2 104 94.1
- 10. Maine General Election Survey, October 23rd - 24th, 2014, 869N, 3.32% MoE, Weighted Results, Magellan Strategies, 1685 Boxelder St. Suite 300, Louisville, CO 80027, 303-861-8585 Table 6-1 T5. Do you have a favorable or unfavorable opinion of Eliot Cutler? GENDER~MARITAL AGE REPUBLICANS DEMOCRATS INDEPENDENTS ----------------------------------------------------------------- ------------------------------------------------------ ------------------------------- ------------------------------- ------------------------------- TOTAL --------- MEN --------- MARR MEN -------- SING MEN --------- WOM --------- MARR WOM -------- SING WOM --------- 18-29 --------- 30-44 -------- 45-54 --------- 55-64 --------- 65 PLUS -------- REP TOT --------- REP MEN -------- REP WOM --------- DEM TOT --------- DEM MEN -------- DEM WOM --------- IND TOT --------- IND MEN -------- IND WOM --------- TOTAL 869 100.0 426 100.0 293 100.0 118 100.0 443 100.0 259 100.0 177 100.0 61 100.0 148 100.0 182 100.0 209 100.0 265 100.0 287 100.0 140 100.0 147 100.0 304 100.0 119 100.0 185 100.0 278 100.0 167 100.0 111 100.0 FAVORABLE 311 35.8 160 37.7 115 39.4 43 36.5 151 34.0 86 33.2 65 36.5 16 25.8 52 35.1 77 42.1 79 38.1 86 32.4 97 33.7 47 33.3 50 34.1 104 34.2 39 32.5 66 35.3 111 39.7 75 45.0 35 31.8 UNFAVORABLE 407 46.9 196 46.0 130 44.3 57 48.9 211 47.7 129 49.7 79 44.3 42 69.0 76 51.4 67 36.8 103 49.3 117 44.1 142 49.6 70 50.0 72 49.3 155 51.1 61 51.6 94 50.8 109 39.3 65 38.6 45 40.5 HEARD OF NO OPINION 141 16.3 65 15.2 45 15.3 15 12.8 77 17.3 41 15.9 33 18.6 20 13.5 37 20.3 25 12.1 59 22.3 45 15.8 22 15.7 23 15.8 42 13.9 16 13.9 26 13.9 54 19.4 26 15.7 28 24.9 NEVER HEARD OF 9 1.1 5 1.2 3 1.0 2 1.8 4 1.0 3 1.2 1 0.7 3 5.2 1 0.8 1 0.5 3 1.2 3 0.9 1 1.0 1 0.8 2 0.8 2 2.0 4 1.6 1 0.7 3 2.8 NAME ID 860 98.9 421 98.8 290 99.0 115 98.2 439 99.0 256 98.8 176 99.3 58 94.8 148 100.0 181 99.2 207 99.5 262 98.8 284 99.1 139 99.0 146 99.2 302 99.2 116 98.0 185 100.0 274 98.4 166 99.3 108 97.2 HARD NAME ID 718 82.7 356 83.6 245 83.7 100 85.4 362 81.8 215 82.9 143 80.8 58 94.8 128 86.5 144 78.9 182 87.4 203 76.5 239 83.3 117 83.3 122 83.3 260 85.3 100 84.1 160 86.1 220 79.1 140 83.6 80 72.3
- 11. Maine General Election Survey, October 23rd - 24th, 2014, 869N, 3.32% MoE, Weighted Results, Magellan Strategies, 1685 Boxelder St. Suite 300, Louisville, CO 80027, 303-861-8585 Table 7-1 T6. If the election for Governor were being held today, for whom would you vote if the candidates were Mike Michaud, Democrat, Paul LePage, Republican, and Eliot Cutler, Independent? GENDER~MARITAL AGE REPUBLICANS DEMOCRATS INDEPENDENTS ----------------------------------------------------------------- ------------------------------------------------------ ------------------------------- ------------------------------- ------------------------------- TOTAL --------- MEN --------- MARR MEN -------- SING MEN --------- WOM --------- MARR WOM -------- SING WOM --------- 18-29 --------- 30-44 -------- 45-54 --------- 55-64 --------- 65 PLUS -------- REP TOT --------- REP MEN -------- REP WOM --------- DEM TOT --------- DEM MEN -------- DEM WOM --------- IND TOT --------- IND MEN -------- IND WOM --------- TOTAL 869 100.0 426 100.0 293 100.0 118 100.0 443 100.0 259 100.0 177 100.0 61 100.0 148 100.0 182 100.0 209 100.0 265 100.0 287 100.0 140 100.0 147 100.0 304 100.0 119 100.0 185 100.0 278 100.0 167 100.0 111 100.0 PAUL LEPAGE 368 42.3 183 43.0 131 44.8 41 34.6 185 41.6 116 44.8 67 37.7 33 53.8 68 46.4 82 45.0 78 37.3 103 38.9 217 75.6 108 77.3 109 74.0 42 13.9 12 10.2 30 16.3 109 39.1 63 37.6 46 41.3 MIKE MICHAUD 361 41.6 172 40.4 109 37.1 60 51.1 189 42.7 104 40.1 80 45.3 21 35.1 61 41.1 67 36.5 93 44.4 120 45.3 33 11.7 14 10.3 19 13.0 215 70.8 86 72.4 130 69.8 112 40.4 72 42.9 41 36.7 ELIOT CUTLER 115 13.2 61 14.2 47 16.2 12 10.5 54 12.2 32 12.3 22 12.5 4 5.9 17 11.3 34 18.5 30 14.2 31 11.8 31 10.9 16 11.7 15 10.0 38 12.5 16 13.6 22 11.7 46 16.5 28 16.8 18 15.9 OTHER 10 1.2 3 0.7 2 0.8 1 0.6 7 1.6 5 1.8 3 1.5 3 5.2 2 0.9 4 1.7 2 0.5 1 0.7 0.3 4 1.2 1 0.6 3 1.6 5 1.8 1 0.7 4 3.5 UNDECIDED 15 1.7 7 1.7 3 1.2 4 3.2 8 1.8 2 1.0 5 3.0 2 1.3 7 3.3 6 2.4 4 1.3 4 2.6 5 1.6 4 3.2 1 0.6 6 2.2 3 2.0 3 2.6
- 12. Maine General Election Survey, October 23rd - 24th, 2014, 869N, 3.32% MoE, Weighted Results, Magellan Strategies, 1685 Boxelder St. Suite 300, Louisville, CO 80027, 303-861-8585 Table 8-1 T7. Do you consider yourself to be conservative, moderate or liberal in your political beliefs? GENDER~MARITAL AGE REPUBLICANS DEMOCRATS INDEPENDENTS ----------------------------------------------------------------- ------------------------------------------------------ ------------------------------- ------------------------------- ------------------------------- TOTAL --------- MEN --------- MARR MEN -------- SING MEN --------- WOM --------- MARR WOM -------- SING WOM --------- 18-29 --------- 30-44 -------- 45-54 --------- 55-64 --------- 65 PLUS -------- REP TOT --------- REP MEN -------- REP WOM --------- DEM TOT --------- DEM MEN -------- DEM WOM --------- IND TOT --------- IND MEN -------- IND WOM --------- TOTAL 869 100.0 426 100.0 293 100.0 118 100.0 443 100.0 259 100.0 177 100.0 61 100.0 148 100.0 182 100.0 209 100.0 265 100.0 287 100.0 140 100.0 147 100.0 304 100.0 119 100.0 185 100.0 278 100.0 167 100.0 111 100.0 CONSERVATIVE 307 35.4 167 39.2 116 39.5 44 37.7 140 31.6 80 30.9 60 33.9 26 43.1 57 38.9 66 36.1 67 32.1 91 34.2 166 57.8 90 64.4 76 51.6 45 14.7 17 14.3 28 14.9 97 34.8 60 35.9 37 33.2 MODERATE 392 45.1 203 47.6 142 48.3 54 45.7 189 42.6 119 45.8 65 36.7 7 10.9 72 48.4 87 47.5 109 52.1 115 43.2 106 37.0 46 32.8 60 40.9 154 50.6 73 61.5 81 43.6 132 47.4 84 50.1 48 43.4 LIBERAL 142 16.3 49 11.5 31 10.6 17 14.4 93 21.0 52 20.2 40 22.6 19 31.2 19 12.7 30 16.3 30 14.5 44 16.7 10 3.4 3 2.4 6 4.4 97 31.9 25 20.8 72 39.0 35 12.7 21 12.4 14 13.0 UNSURE NO OPINION 28 3.2 7 1.7 5 1.6 3 2.3 21 4.7 8 3.2 12 6.8 9 14.8 3 1.3 15 5.8 5 1.8 1 0.4 5 3.1 9 2.9 4 3.5 5 2.5 14 5.1 3 1.5 12 10.4
- 13. Maine General Election Survey, October 23rd - 24th, 2014, 869N, 3.32% MoE, Weighted Results, Magellan Strategies, 1685 Boxelder St. Suite 300, Louisville, CO 80027, 303-861-8585 Table 9-1 T8. Are you a man or a woman? GENDER~MARITAL AGE REPUBLICANS DEMOCRATS INDEPENDENTS ----------------------------------------------------------------- ------------------------------------------------------ ------------------------------- ------------------------------- ------------------------------- TOTAL --------- MEN --------- MARR MEN -------- SING MEN --------- WOM --------- MARR WOM -------- SING WOM --------- 18-29 --------- 30-44 -------- 45-54 --------- 55-64 --------- 65 PLUS -------- REP TOT --------- REP MEN -------- REP WOM --------- DEM TOT --------- DEM MEN -------- DEM WOM --------- IND TOT --------- IND MEN -------- IND WOM --------- TOTAL 869 100.0 426 100.0 293 100.0 118 100.0 443 100.0 259 100.0 177 100.0 61 100.0 148 100.0 182 100.0 209 100.0 265 100.0 287 100.0 140 100.0 147 100.0 304 100.0 119 100.0 185 100.0 278 100.0 167 100.0 111 100.0 WOMAN 443 51.0 443 100.0 259 100.0 177 100.0 37 60.8 65 43.9 88 48.2 102 48.8 149 56.2 147 51.2 147 100.0 185 61.0 185 100.0 111 39.9 111 100.0 MAN 426 49.0 426 100.0 293 100.0 118 100.0 24 39.2 83 56.1 94 51.8 107 51.2 116 43.8 140 48.8 140 100.0 119 39.0 119 100.0 167 60.1 167 100.0
- 14. Maine General Election Survey, October 23rd - 24th, 2014, 869N, 3.32% MoE, Weighted Results, Magellan Strategies, 1685 Boxelder St. Suite 300, Louisville, CO 80027, 303-861-8585 Table 10-1 T9. Which of the following age groups applies to you? GENDER~MARITAL AGE REPUBLICANS DEMOCRATS INDEPENDENTS ----------------------------------------------------------------- ------------------------------------------------------ ------------------------------- ------------------------------- ------------------------------- TOTAL --------- MEN --------- MARR MEN -------- SING MEN --------- WOM --------- MARR WOM -------- SING WOM --------- 18-29 --------- 30-44 -------- 45-54 --------- 55-64 --------- 65 PLUS -------- REP TOT --------- REP MEN -------- REP WOM --------- DEM TOT --------- DEM MEN -------- DEM WOM --------- IND TOT --------- IND MEN -------- IND WOM --------- TOTAL 869 100.0 426 100.0 293 100.0 118 100.0 443 100.0 259 100.0 177 100.0 61 100.0 148 100.0 182 100.0 209 100.0 265 100.0 287 100.0 140 100.0 147 100.0 304 100.0 119 100.0 185 100.0 278 100.0 167 100.0 111 100.0 18-29 61 7.0 24 5.6 19 15.8 37 8.3 10 3.8 27 15.3 61 100.0 11 4.0 3 2.4 8 5.5 15 5.1 3 2.3 13 6.8 34 12.2 18 10.6 16 14.7 30-44 148 17.0 83 19.4 53 18.2 22 18.7 65 14.6 43 16.5 22 12.5 148 100.0 56 19.5 35 24.9 21 14.5 36 11.9 10 8.6 26 14.1 55 19.9 38 22.6 18 15.8 45-54 182 21.0 94 22.2 73 24.8 22 18.7 88 19.9 68 26.4 20 11.1 182 100.0 69 24.1 28 19.9 41 28.1 60 19.6 27 22.9 33 17.6 54 19.3 39 23.6 14 12.9 55-64 209 24.0 107 25.1 81 27.8 24 20.7 102 23.0 61 23.7 36 20.3 209 100.0 62 21.5 34 24.4 28 18.7 75 24.7 34 28.3 42 22.4 72 25.8 39 23.4 33 29.4 65+ 265 30.5 116 27.2 84 28.7 30 25.7 149 33.6 76 29.4 72 40.6 265 100.0 86 30.0 38 27.0 48 32.9 117 38.4 45 37.9 72 38.7 62 22.4 33 19.8 29 26.2 UNSURE NO OPINION 4 0.5 2 0.4 1 0.5 1 0.5 2 0.6 1 0.3 0.3 2 0.8 2 1.3 0.3 1 0.3 1 0.5 1 0.4 1 1.0
- 15. Maine General Election Survey, October 23rd - 24th, 2014, 869N, 3.32% MoE, Weighted Results, Magellan Strategies, 1685 Boxelder St. Suite 300, Louisville, CO 80027, 303-861-8585 Table 11-1 T10. What is your marital status? GENDER~MARITAL AGE REPUBLICANS DEMOCRATS INDEPENDENTS ----------------------------------------------------------------- ------------------------------------------------------ ------------------------------- ------------------------------- ------------------------------- TOTAL --------- MEN --------- MARR MEN -------- SING MEN --------- WOM --------- MARR WOM -------- SING WOM --------- 18-29 --------- 30-44 -------- 45-54 --------- 55-64 --------- 65 PLUS -------- REP TOT --------- REP MEN -------- REP WOM --------- DEM TOT --------- DEM MEN -------- DEM WOM --------- IND TOT --------- IND MEN -------- IND WOM --------- TOTAL 869 100.0 426 100.0 293 100.0 118 100.0 443 100.0 259 100.0 177 100.0 61 100.0 148 100.0 182 100.0 209 100.0 265 100.0 287 100.0 140 100.0 147 100.0 304 100.0 119 100.0 185 100.0 278 100.0 167 100.0 111 100.0 MARRIED 552 63.5 293 68.8 293 100.0 259 58.5 259 100.0 10 16.1 96 65.1 141 77.2 143 68.5 160 60.5 209 72.9 115 82.0 94 64.4 186 61.2 79 66.8 107 57.6 157 56.4 99 59.2 58 52.2 WIDOWED 111 12.8 27 6.3 27 23.0 84 19.0 84 47.4 13 21.4 13 8.9 4 2.1 16 7.6 64 24.2 40 14.0 9 6.2 31 21.4 47 15.4 10 8.6 37 19.7 24 8.7 8 4.8 16 14.5 SINGLE AND NEVER MARRIED 72 8.3 38 9.0 38 32.5 34 7.7 34 19.3 23 37.2 11 7.6 19 10.4 9 4.3 11 4.0 8 2.8 3 2.0 5 3.4 28 9.4 9 7.5 20 10.6 36 13.0 26 15.8 10 8.7 DIVORCED 68 7.8 32 7.5 32 27.1 36 8.1 36 20.3 9 6.0 10 5.3 27 13.0 22 8.3 22 7.6 11 7.7 11 7.5 20 6.7 10 8.0 11 5.8 26 9.2 11 6.9 14 12.8 UNMARRIED LIVING WITH PARTNER 27 3.1 15 3.6 15 13.0 11 2.6 11 6.4 2 4.0 7 4.6 8 4.2 6 2.8 4 1.5 5 1.7 2 1.3 3 2.1 10 3.3 6 5.5 4 2.0 12 4.2 7 4.2 5 4.2 SEPARATED 17 1.9 5 1.2 5 4.5 12 2.6 12 6.6 8 12.7 4 2.8 1 0.7 2 1.1 2 0.6 1 0.4 1 0.9 7 2.2 1 0.9 6 3.1 9 3.2 4 2.5 5 4.3 UNSURE NO OPINION 22 2.5 15 3.6 7 1.5 5 8.6 7 5.0 6 2.7 3 1.0 2 0.5 1 0.8 0.3 6 1.9 3 2.7 2 1.3 15 5.3 11 6.6 4 3.3