
Empfohlen
Empfohlen
Weitere ähnliche Inhalte
Was ist angesagt?
Was ist angesagt? (20)
Ähnlich wie DLL-ENGLISH-Q4-WEEK 3.pdf
Ähnlich wie DLL-ENGLISH-Q4-WEEK 3.pdf (20)
Mehr von MaCatherineMendoza
Mehr von MaCatherineMendoza (14)
Kürzlich hochgeladen
Kürzlich hochgeladen (20)
DLL-ENGLISH-Q4-WEEK 3.pdf
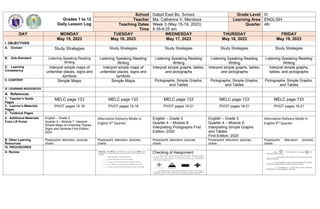
- 1. Grades 1 to 12 Daily Lesson Log School Dalipit East Bo. School Grade Level III Teacher Ma. Catherine V. Mendoza Learning Area ENGLISH Teaching Dates Time Week 3 (May 15-19, 2023) 8:35-9:25 am Quarter 4th DAY MONDAY TUESDAY WEDNESDAY THURSDAY FRIDAY May 15, 2023 May 16, 2023 May 17, 2023 May 18, 2023 May 19, 2023 I. OBJECTIVES A. Domain Study Strategies Study Strategies Study Strategies Study Strategies Study Strategies B. Sub-Standard Listening Speaking Reading Writing Listening Speaking Reading Writing Listening Speaking Reading Writing Listening Speaking Reading Writing Listening Speaking Reading Writing C. Learning Competency Interpret simple maps of unfamiliar places, signs and symbols Interpret simple maps of unfamiliar places, signs and symbols Interpret simple graphs, tables, and pictographs Interpret simple graphs, tables, and pictographs Interpret simple graphs, tables, and pictographs II. CONTENT Simple Maps Simple Maps Pictographs, Simple Graphs, and Tables Pictographs, Simple Graphs, and Tables Pictographs, Simple Graphs, and Tables III. LEARNING RESOURCES A. References 1. Teacher’s Guide Pages MELC page 133 MELC page 133 MELC page 133 MELC page 133 MELC page 133 2. Learner’s Materials Pages PIVOT pages 15-18 PIVOT pages 15-18 PIVOT pages 18-21 PIVOT pages 18-21 PIVOT pages 18-21 3. Textbook Pages 4. Additional Materials From LR Portal English – Grade 3 Quarter 4 – Module 7: Interpret Simple Maps of Unfamiliar Places, Signs and Symbols First Edition, 2020 Alternative Delivery Mode in English 4th Quarter English – Grade 3 Quarter 4 – Module 8: Interpreting Pictographs First Edition, 2020 English – Grade 3 Quarter 4 – Module 9: Interpreting Simple Graphs and Tables First Edition, 2020 Alternative Delivery Mode in English 4th Quarter B. Other Learning Resources Powerpoint, television, pictures, charts Powerpoint, television, pictures, charts Powerpoint, television, pictures, charts Powerpoint, television, pictures, charts Powerpoint, television, pictures, charts IV. PROCEDURES A. Review Checking of Assignment
- 2. B. Establishing Purpose Pag-usapan ang larawan/mapa: Bobby joined his community’s tree-planting drive to help protect the environment against air pollution and global warming. This pictograph shows the number trees planted by Bobby in a wee What favourite food snacks do you like to eat during recess in school? Ramirez Family donated face masks to their neighboring barngays as part of their advocacy to prevent the spread of virus. Study the pictograph below then answer the questions C. Presenting Examples 1. How many trees did Bobby plant in three days? 2. Why do you think Bobby joined the tree-planting drive? Mrs. Rose Santos, a canteen manager in Nagpayong Elementary School, makes ready and prepares everyday different variety of food snacks for the 45 pupils. Mrs. Santos and the canteen helpers cook delicious and tasty food such as champorado, spaghetti and sopas. They also offer boiled eggs and hopia. About 20 pupils like spaghetti and 15 pupils like champorado very much, while 10 pupils like sopas and 5 pupils like boiled egg. Some children like banana cue and hopia D. Discussing New Concepts and predicting new skills Q1 1. What is the title of the pictograph? 2. How many barangays received donations of facemasks? 3. How many boxes of face masks did Barangay Pag-asa receive? 4. Which barangay has the highest number of facemasks received? 5. How many boxes of facemasks did the Ramirez Family donate in all? E. Discussing New Concepts and Predicting New Skills Q2/Guided Practice Tables and graphs are visual representations of data. They are used to show the relationships of information. They are used to compare two or more values in an organized way. Bar graphs and the pictographs both give us information as to the number of objects or symbols represent
- 3. F. Developing Mastery (Leads to Formative Assessment) Draw a simple map showing the location of your house in your community. Do it on a separate sheet of paper. G. Finding practical application of concepts and skills in daily living application H. Making generalization and Abstraction about the lesson Remember: Symbols, signs and the four directions are used in locating areas or places using maps Remember: Symbols, signs and the four directions are used in locating areas or places using maps A graph, bar graph and pictograph use pictures or symbols to represent numbers.
- 4. Prepared by: MA. CATHERINE V. MENDOZA Teacher III Noted: EFRENIA H. JAVIER Head Teacher III I. Evaluating Learning 1. The school is at the___________ of the church. 2. The post office is at the________ of the fire station. 3. The church is at the__________ of the farm. 4. The pond is at the_________ of the post office. J. Additional activities for application or remediation Assignment V. REMARKS VI. REFLECTION A. No. of Learners who earned 80% in the evaluation