
Empfohlen
Weitere ähnliche Inhalte
Ähnlich wie 130304 jpm samsung supply chains-finding winning sub-sectors and companies
Ähnlich wie 130304 jpm samsung supply chains-finding winning sub-sectors and companies (20)
Mehr von MTKDMI
Mehr von MTKDMI (16)
130304 jpm samsung supply chains-finding winning sub-sectors and companies
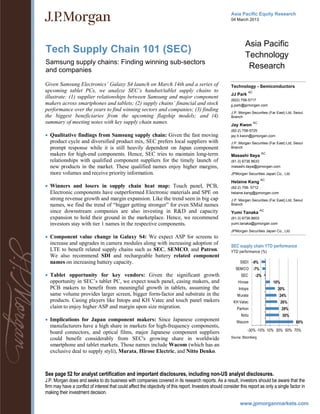
- 1. Asia Pacific Equity Research 04 March 2013 Asia Pacific Tech Supply Chain 101 (SEC) Technology Samsung supply chains: Finding winning sub-sectors and companies Research Given Samsung Electronics’ Galaxy S4 launch on March 14th and a series of Technology - Semiconductors upcoming tablet PCs, we analyze SEC’s handset/tablet supply chains to AC JJ Park illustrate: (1) supplier relationships between Samsung and major component (822) 758-5717 makers across smartphones and tablets; (2) supply chains’ financial and stock jj.park@jpmorgan.com performance over the years to find winning sectors and companies; (3) finding J.P. Morgan Securities (Far East) Ltd, Seoul the biggest beneficiaries from the upcoming flagship models; and (4) Branch summary of meeting notes with key supply chain names. Jay Kwon AC (82-2) 758-5725 Qualitative findings from Samsung supply chain: Given the fast moving jay.h.kwon@jpmorgan.com product cycle and diversified product mix, SEC prefers local suppliers with J.P. Morgan Securities (Far East) Ltd, Seoul prompt response while it is still heavily dependent on Japan component Branch makers for high-end components. Hence, SEC tries to maintain long-term Masashi Itaya AC relationships with qualified component suppliers for the timely launch of (81-3) 6736 8633 new products in the market. These qualified names enjoy higher margins, masashi.itaya@jpmorgan.com more volumes and receive priority information. JPMorgan Securities Japan Co., Ltd. AC Helaine Kang Winners and losers in supply chain heat map: Touch panel, PCB, (82-2) 758- 5712 Electronic components have outperformed Electronic materials and SPE on helaine.kang@jpmorgan.com strong revenue growth and margin expansion. Like the trend seen in big cap J.P. Morgan Securities (Far East) Ltd, Seoul names, we find the trend of “bigger getting stronger” for even SMid names Branch since downstream companies are also investing in R&D and capacity Yumi Tanaka AC expansion to hold their ground in the marketplace. Hence, we recommend (81-3) 6736-8603 investors stay with tier 1 names in the respective components. yumi.tanaka@jpmorgan.com JPMorgan Securities Japan Co., Ltd. Component value change in Galaxy S4: We expect ASP for screens to increase and upgrades in camera modules along with increasing adoption of SEC supply chain YTD performance LTE to benefit related supply chains such as SEC, SEMCO, and Patron. YTD performance (%) We also recommend SDI and rechargeable battery related component names on increasing battery capacity. SSDI -9% SEMCO -7% Tablet opportunity for key vendors: Given the significant growth SEC -2% opportunity in SEC’s tablet PC, we expect touch panel, casing makers, and Hirose 10% PCB makers to benefit from meaningful growth in tablets, assuming the Intops 20% same volume provides larger screen, bigger form-factor and substrate in the Murata 24% products. Casing players like Intops and KH Vatec and touch panel makers KH Vatec 26% claim to enjoy higher ASP and margin upon size migration. Partron 29% Nitto 30% Implications for Japan component makers: Since Japanese component Wacom 60% manufacturers have a high share in markets for high-frequency components, -30% -10% 10% 30% 50% 70% board connectors, and optical films, major Japanese component suppliers could benefit considerably from SEC's growing share in worldwide Source: Bloomberg smartphone and tablet markets. Those names include Wacom (which has an exclusive deal to supply styli), Murata, Hirose Electric, and Nitto Denko. See page 52 for analyst certification and important disclosures, including non-US analyst disclosures. J.P. Morgan does and seeks to do business with companies covered in its research reports. As a result, investors should be aware that the firm may have a conflict of interest that could affect the objectivity of this report. Investors should consider this report as only a single factor in making their investment decision. www.jpmorganmarkets.com
- 2. JJ Park Asia Pacific Equity Research (822) 758-5717 04 March 2013 jj.park@jpmorgan.com Table of Contents Executive Summary .................................................................3 Section I: Who does what?......................................................4 Mobile device (handset) ..........................................................................................4 Mobile device (Tablet) ............................................................................................6 Qualitative findings from Samsung supply chain......................................................8 Korea Tech – Small Cap DB constituents ................................................................9 Section II: Supply Chain Heat Map........................................10 Sub-sector performance comparison ......................................................................10 Section III: Finding winners within the sub-sectors ............15 Electronic components sector ................................................................................15 PCB sector ............................................................................................................17 Electronic Materials sector ....................................................................................18 SPE sector.............................................................................................................20 Touch Panel ..........................................................................................................21 Section IV: Where is the market heading? ...........................24 Samsung vs. Sub-sectors .......................................................................................25 Section V: Implication from potential component value changes in next Galaxy S-series...........................................28 Galaxy series shipment momentum vs. Market Cap analysis ..................................29 Section VI: Implications to Japan component makers........31 Section VII: Meeting Note Summary .....................................33 Duksan Hi-Metal (NC, 077360.KQ) ......................................................................34 Duksan Hi-Metal: Summary of Financials.........................................35 Interflex (NC, 051370.KQ)....................................................................................36 Interflex: Summary of Financials ....................................................37 Partron (NC, 091700.KQ)......................................................................................38 Partron: Summary of Financials .....................................................39 KH Vatec (NC, 060720.KQ) .................................................................................40 KH Vatec: Summary of Financials...................................................41 SFA Engineering (NC, 056190.KS).......................................................................42 SFA Engineering: Summary of Financials ........................................43 AP Systems (NC, 054620.KQ) ..............................................................................44 Asia Pacific Systems: Summary of Financials ..................................45 Iljin Display (NC, 020760.KS) ..............................................................................46 Iljin Display: Summary of Financials ...............................................47 S-MAC (NC, 097780.KQ).....................................................................................48 S-MAC: Summary of Financials ......................................................49 2
- 3. JJ Park Asia Pacific Equity Research (822) 758-5717 04 March 2013 jj.park@jpmorgan.com Executive Summary This is our first intensive report on “Tech supply chain 101 – Samsung supply chain” and herein we illustrate: (1) Supplier relationships between Samsung and supply chains across smartphones and tablets; (2) Supply chains’ financial and share performance over the years to analyze key winning sectors; (3) JPM’s view and implication on sub-sectors for upcoming new flagship series as well as a comparison between Samsung and supply chain sub-sectors; and (4) Meeting notes summary with supply chain companies. We expect this detailed handbook report to help investors capture key changes and upcoming key trends in Samsung’s supply chain. As some companies have not disclosed their 4Q12 performance yet, actual financial numbers may change from the one in the report. Supply chain at a glance We categorize SEC’s key supply chains in five sub-sectors: (1) Electronic materials, (2) PCB, (3) Electronic components, (4) Touch panels, and (5) SPE. We conduct an analysis of financial performance, share price performance, and their relative position in various matrix. Finally, we identify key growth drivers for each sub-sector to find relative performance to other sub-sectors. Accordingly, we try to provide implications from component value changes in the next Galaxy S-series (Galaxy S4 and Note3) to find winning sub-sectors. Tablet PC opportunity As most suppliers in tablet PC overlap and we expect SEC's tablet shipment momentum to accelerate, we believe touch panel, casing makers, and PCB makers will benefit more from strong growth in tablets, assuming the same volume provides larger screen, bigger form-factor and substrate in the products in terms of top-line and earnings. In terms of SEC’s Galaxy-series shipment momentum vs. market cap trend, touch panel has stronger correlation with tablet PC shipment momentum. Beneficiaries: Sectors and companies Increasing value of display continues to benefit Samsung Display (SDC) and OLED related material players–Duksan Hi-Metal and potentially Cheil Industries. Casing players (KH Vatec and Intops) could benefit as larger device form-factor usually incurs higher ASP and better margin (especially for tablet PCs). PCB players (Interflex and Flexcom) will likely benefit as set makers require slimmer substrate and even flexible substrate. With upgrades in camera modules, SEMCO could be the main supplier along with front camera suppliers such as Partron, Jawha and Power Logics. Also, emergence of diverse functional antenna would benefit Partron and Amotech. Finally, Samsung SDI remains the largest battery supplier for SEC's mobile devices. In Japan, Wacom which has an exclusive deal to supply styli, and Murata, Hirose Electric and Nitto Denko for high frequency components, board connectors, and optical films. Also, Ibiden could benefit given SEC is using layer printed circuit boards for its Galaxy S4. 3
- 4. JJ Park Asia Pacific Equity Research (822) 758-5717 04 March 2013 jj.park@jpmorgan.com Section I: Who does what? Mobile device (handset) Smartphone supply chain: Qualified suppliers with technology edge benefit As Korea handset makers increase their presence in the smartphone market, key component suppliers from Samsung group (e.g. SEC, Samsung SDI, SEMCO), and non-Samsung suppliers—Patron (091700 KQ, NC; camera module), Iljin Display (035720 KQ, NC; Touch panel makers), Intops & KH Vatec (casing players), and other related supply chain would benefit. In this section, we lay out the supplier relationship for each component. Below is a teardown picture of SEC's key flagship smartphone–Galaxy Note II. Figure 1: Smartphone Teardown Figure by components (Samsung Galaxy Note II) Source: Company data, J.P. Morgan 4
- 5. JJ Park Asia Pacific Equity Research (822) 758-5717 04 March 2013 jj.park@jpmorgan.com Major components are internally supplied across Samsung supply chain As is well known in the market, key smartphone components (i.e. AP, OLED panel, mDRAM, MLCC, Camera, and Battery) are supplied by SEC or Samsung group affiliates. A large number of chipset components (i.e. baseband, model and network chipset, and sensor components) were supplied externally, however, Samsung has recently begun to adopt internally developed components (baseband and model chipset for new flagship smartphones). According to our BOM cost analysis, total BOM + manufacturing cost is slightly above $250, which accounts for ~45% of Galaxy S III's retailer price ($550 w/o lock-up discount). Table 1: Smartphone supplier relationship table (Samsung smartphone) Components Galaxy S III Detailed Components Supplier Rev. Exposure (FY12) Memory 30.0 NAND Flash 17.4 NAND (Internal Memory) SEC SEC (6%) DRAM 12.6 mobile DRAM SEC SEC (4%) Display & Touch Screen 51.5 OLED panel SDC SDC small mobile (+60%) Display 37.5 OLED material SDC, Duksan hi-metal, Doosan, UDC Duksan (~85%), Doosan (<1%) LCD panel SDC SDC small mobile (~40%) Mobile BLU SDC, E-litecom SDC small mobile (~40%), E-litecom (~50%) Touch Screen 14.0 Touch Panel module Iljin Display, S-MAC, Melfas, ELK Iljin (95%), S-MAC (95%), Melfas (85%) Touch Panel sensor Melfas Melfas (85%) Driver IC SDC, Siliconworks Siliconworks (<5%) Processor 25.3 Application Processor SEC, Qualcomm SEC (2%), Qualcomm (18%) MLCC SEMCO SEMCO (~20%) Camera(s) 19.6 Camera module SEMCO, Partron SEMCO (~25%), Partron (~80%) Image sensor/components SEC / Sony / Jahwa Elec Jahwa Elec (100%) Camera lens Sony Proximity Sensor SEC Wireless section - 38.0 Baseband chip Qualcomm, Intel, SEC Intel (<1%), Qualcomm (18%) BB/RF/PA Radio Frequency chip Partron Partron (~80%) Power Amplifier chip Skyworks LTE, HSPA, Modem Chip Qualcomm, SEC Qualcomm (18%) User Interface & Sensors 6.9 Accelerometer ST Micro ST Micro (~10%) Gyroscope ST Micro ST Micro (~10%) Pressure sensor Partron Partron (~80%) Audio Interface Wolfson Micro Wolfson Micro (+30%) WLAN/BT/FM/GPS 6.5 WLAN Broadcom Broadcom (17%) FM transceiver Infineon Infineon (low single %) Bluetooth Broadcom, Murata, Partron, Amotech Partron (~80%), Amotech (~45%) Wi-Fi Broadcom, Murata, Partron Partron (~80%) NFC chipset NXP, Partron, Amotech Partron (~80%), Amotech (~45%) Power Management 10.0 Power management IC Maxim, TI, Silicon Mitus, Magna Chip Battery 4.5 Battery Pack Samsung SDI Samsung SDI (60%) Battery Cell Samsung SDI Samsung SDI (60%) Battery Components material Power Logics, Iljin Materials Power Logics (65%), Iljin Materials (50%) Daeduck Electronics, Interflex, Daeduck (50%), Interflex (+40%), Flexcom Mechanical 38.0 PCB / FPCB / FC-CSP Flexcom, Simm Tech, BH (+90%) / Electro-mechanical Microphone BSE CM, Partron BSE CM (~70%), Partron (~80%) Speaker receiver BSE CM BSE CM (~70%) Casing Intops, KH Vatec, Shinyang Intops (~95%), KH Vatec (60%) LCD bracket KH Vatec, Innox KH Vatec (60%) SAW filter Wisol Box Contents 7.0 Charger RF Tech RF Tech (+40%) BOM Cost 237.1 Manufacturing Cost 16.0 BOM Cost + Manufact. 253.1 Smartphone ASP (US$) 550.0 Source: Gartner, Company data, J.P. Morgan estimates. *Supplier revenue exposure data based on company data. BOM cost based on Galaxy SIII, component supply status based on overall Samsung smartphone line-ups. Supplier list includes companies above US$ 100mn market cap only. Revenue exposure (%) stands for total Samsung Electronics. 5
- 6. JJ Park Asia Pacific Equity Research (822) 758-5717 04 March 2013 jj.park@jpmorgan.com Mobile device (Tablet) Tablet supply chain: Similar to smartphone, but less profitable due to higher BOM We expect 2013 would be the turning point for the tablet space as Android and Window-OS based set makers aggressively penetrate into Apple dominated market with various pricing points and product features. Although Tablets do not provide healthy margins to set makers compared to smartphones due to higher BOM cost burden, Samsung is generating a profit from supplying same components and benefits from cost spread effect upon economies of scale. Samsung SDI (OW, 006400.KS) is our top preferable supply chain name under our coverage thanks to larger battery capacity. For non-Samsung supply chain names, touch panel makers (Iljin Display, NC; 035720.KS, S-MAC, NC; 097780.KQ, and ELK, NC; 094190.KQ) could benefit thanks to increasing ASP on larger screen size. Also, cost-driven suppliers like PCB/FPCB players (Interflex, NC; 051370.KQ and Flexcom, NC; 065270.KQ) could benefit from larger substrate components. Casing players (Intops, NC; 049070.KQ, KH Vatec, NC; 060720.KQ) also claim to enjoy higher ASP and margin from increasing tablet PC penetration given sophisticated manufacturing processes. Figure 2: Smartphone Teardown Figure by components (Samsung Galaxy Note 10.1”) Source: ifixit, Company data, J.P. Morgan No major change from smartphone suppliers, qualified names continue to stay A comparison of tablet PC supply chain names with smartphone suppliers indicates that they have lots of names in common. Although revenue and earnings contribution from tablets may be different from smartphones, we believe proliferation of Samsung tablets in the market should be beneficial for the relevant supply chain. Major components are internally supplied (i.e. AP, mDRAM, MLCC, and Battery). Unlike smartphones, camera exposure from SEMCO is much smaller given tablets usually 6
- 7. JJ Park Asia Pacific Equity Research (822) 758-5717 04 March 2013 jj.park@jpmorgan.com adopt lower-spec camera module. Moreover, due to higher pricing points and tight supply, OLED panel adoption into tablet PC is at a premature stage. As battery consumption becomes a critical point, PMIC component becomes more important (but no domestic players have yet made a notable presence). S-Pen (pen-type input device for tablet PC) has been added to tablet PC recently in addition to Galaxy Note smartphone series (developed by Wacom and manufactured by SEC). According to our BOM cost analysis, total BOM + manufacturing cost is slightly below $280, which accounts for 56% of Galaxy Note 10.1's retailer price (~$499). Table 2: Tablet PC supplier relationship table (Samsung Tablet PC) Galaxy Components Detailed Components Supplier Rev. Exposure (FY12) Note 10.1” Memory 30.0 NAND Flash 17.4 NAND (Internal Memory) SEC SEC (6%) DRAM 12.6 mobile DRAM SEC SEC (4%) Display & Touch Screen 100.0 LCD panel SDC SDC small mobile (+60%) Display 60.0 Mobile BLU SDC, E-litecom SDC small mobile (~40%), E-litecom (~50%) Touch Screen 40.0 Touch Panel module Iljin Display, S-MAC, Melfas, ELK Iljin (95%), S-MAC (95%), Melfas (85%) Touch Panel sensor Melfas Melfas (85%) Driver IC / Controller IC SDC, Siliconworks, Melfas Siliconworks (<5%), Melfas (85%) Processor 18.8 Application Processor SEC, Qualcomm SEC (2%), Qualcomm (18%) MLCC SEMCO SEMCO (~20%) Camera(s) 15.0 Camera module Partron, SEMCO SEMCO (~25%), Partron (~80%) Image sensor/components SEC, Sony, Jahwa Elec Jahwa Elec (100%) Camera lens Sony Proximity Sensor SEC User Interface & Sensors 18.0 Accelerometer ST Micro ST Micro (~10%) Gyroscope ST Micro ST Micro (~10%) S-Pen input Wacom, SEC Pressure sensor Partron Partron (~80%) Audio Interface Wolfson Micro Wolfson Micro (+30%) WLAN/BT/FM/GPS 15.0 WLAN Broadcom Broadcom (17%) FM transceiver Infineon Infineon (low single %) Bluetooth Broadcom, Murata, Partron, Amotech Partron (~80%), Amotech (~45%) Wi-Fi Broadcom, Murata, Partron Partron (~80%) Power Management 12.0 Power management IC Maxim, TI, Silicon Mitus, Magna Chip Battery 18.0 Battery Pack Samsung SDI Samsung SDI (60%) Battery Cell Samsung SDI Samsung SDI (60%) Battery Components material Power Logics, Iljin Materials Power Logics (65%), Iljin Materials (50%) Daeduck Electronics, Interflex, Daeduck (50%), Interflex (+40%), Flexcom Mechanical 35.0 PCB / FPCB / FC-CSP Flexcom, Simm Tech, BH (+90%) / Electro-mechanical Microphone BSE CM BSE CM (~70%) Speaker receiver BSE CM BSE CM (~70%) Casing Intops, KH Vatec, Shinyang Intops (~95%), KH Vatec (60%) LCD bracket KH Vatec, Innox KH Vatec (60%) SAW filter Wisol Box Contents 6.0 Earphone, Charger RF Tech RF Tech (+40%) BOM cost 267.8 Manufacturing Cost 10.0 BOM + Manufacturing 277.8 Tablet PC ASP (US$) 499.0 Source: Gartner, Company data, J.P. Morgan estimates. *Supplier revenue exposure data based on company data. BOM cost based on Galaxy Note 10.1”, component supply status based on overall Samsung tablet PC line-ups. Supplier list includes companies above US$ 100mn market cap only. Revenue exposure (%) stands for total Samsung Electronics. 7
- 8. JJ Park Asia Pacific Equity Research (822) 758-5717 04 March 2013 jj.park@jpmorgan.com Qualitative findings from Samsung supply chain 1. Which company continues as the top vendor is a major supply chain concern Samsung did not disclose its supplier list officially to the public before Galaxy SIII. Although names were not provided, the company provided a hint to the market about its supplier guideline. Given the fast moving product life-cycle, it is extremely important for set makers to launch new products in the market in a timely fashion. For example, Galaxy SIII experienced casing yield issues at the beginning of its global launch and the company said it solved the issue within three days. This leads to a continuous relationship between SEC and qualified suppliers. Hence, qualified names (Top Vendors) enjoy higher margins, more volumes and receive priority information, which in turn generates positive feedback from SEC. 2. Localization trend continues. SEC prefers local suppliers with prompt response There are many suppliers outside Korean (especially from Japan; material, chipset, and SPE makers). We believe SEC increased its Korean supplier portion from low- 10% in early 2000 to high 20% or more in 2011 and this trend is likely to continue. Recently, as Samsung set up a production site outside Korea (i.e. handset production at Vietnam and China), many supply chain names have kicked in overseas production to actively deal with SEC. For instance, casing players (KH Vatec and Intops) have built majority of capacity overseas and this strategy has worked successfully. 3. Level of product differentiation does matter. Is the supplier dominant enough? Although highly differentiated products are internally supplied, there are few products in which non-Samsung players maintain a dominant position. For OLED material (HIL/HTL materials), Duksan Hi-Metal (DSHM) has been the major supplier from the beginning. SEC has put OLED upfront to differentiate it from competitors, and this strategy has worked successfully. Samsung tried to internalize material supply from Cheil Industries, but progress is still at the premature stage. As a result, DSHM has been enjoying good OPM (~30%) for the last 2 years. 4. Are non-Samsung players ready to embrace in-Samsung supplier position? Given the shortened product life-cycle, SEC and in-Samsung suppliers are efficiently restructuring the supply chain system. Key challenges to non-Samsung suppliers are whether they are ready to take the empty positions and step up to be a part of the inner-circle. SEC merged with Samsung Hainan Fiberoptics-Korea (SEHF) in Sept- 2012 and the merger process was completed by end of Dec-2012. Partron took over SEHF's camera module business in the SEC supply chain and Power Logics / Jahwa Electronics stepped up to directly supply camera image sensor to SEC's handset division. This is a good example of opportunity pursuit from non-Samsung supply chains and we are likely to see more such cases going forward as SEC continues to try outsourcing less profitable components to external parties and focus on core components. 8
- 9. JJ Park Asia Pacific Equity Research (822) 758-5717 04 March 2013 jj.park@jpmorgan.com Korea Tech – Small Cap DB constituents Table 3: Korea SMid-cap Tech list Company List with sub-sector Ticker Company List with sub-sector Ticker Small caps - Electronics Components Small caps - SPE Partron 091700 KQ SFA Engineering 056190 KS Jahwa Electronics 033240 KS Nepes 033640 KQ Sekonix 053450 KQ ICD 040910 KQ Foosung 093370 KS AP System 054620 KQ Iljin Materials 020150 KS Jusung Engineering 036930 KS Intops 049070 KQ SNU Precision 080000 KS KH Vatec 060720 KQ Soulbrain 036830 KQ Shinyang Engineering 086830 KQ Wonik IPS 030530 KQ Innochip Technology 080420 KQ Small caps - Touch Panel Wisol 122990 KQ Iljin Display 020760 KS RFSemi Technologies 096610 KQ S-MAC 097780 KQ E-litecom 041520 KQ Melfas 096640.KQ BSE CM 045970 KQ ELK 094190 KQ Crucial Tech 114120 KQ Small caps - Others Small caps - PCB Silicon Works 108320 KS Daeduck Electronics 008060 KS Anapass 123860 KQ Interflex 051370 KQ Power Logics 047310 KQ Flexcom 065270 KQ DnF solution 092070 KQ SimmTech 036710 KQ Infraware 041020 KQ Korea Circuit 007810 KS Barun Electronics 064520 KQ BH 090460 KQ ABCO Electronics 036010 KQ Small caps - Electronics Material Sangsin EDP 091580 KQ Duksan Himetal 077360 KQ Lumens 038060 KS I-Component 059100 KQ Sapphire Technology 123260 KS Sangbo 027580 KQ Od-Tech 080520 KQ Innox 088390 KQ Kumho Electric 001210 KS Source: J.P. Morgan Table 4: Korea SMid-cap tech supply chain - Asia peer list Ticker Company Taiwan peers Japan peers 056190 KS SFA Engineering Corp Acter/United Integrated Services Tokki (Canon), ULVAC 091700 KQ Partron Co Ltd Foxconn/Chicony/Lite-on Sony/Sharp 077360 KQ Duksan Hi-Metal Co Ltd Hodogaya, Idemitsu Kosan 036830 KQ Soulbrain Co Ltd Sino-American Silicon SUMCO/Shin Etsu/Hitachi Chemical/JSR 051370 KQ Interflex Co Ltd Unimicron/Compeq/Tripod Sumitomo batelite/Ibiden/Meiko 020760 KS Iljin Display Co Ltd TPK/WintekYoungfast/Jtouch/Jtouch/CMI Alps Electric/Nissha Printing 008060 KS Daeduck Electronics Co Unimicron/Compeq/Tripod Sumitomo batelite/Ibiden/Meiko 007810 KS Korea Circuit Co Ltd Unimicron/Compeq/Tripod Sumitomo batelite/Ibiden/Meiko 033640 KQ NEPES Corp Acter/United Integrated Services Tokki (Canon), ULVAC 030530 KQ Wonik IPS Co Ltd Acter/United Integrated Services Tokki (Canon), ULVAC 096640.KQ Melfas Inc TPK/WintekYoungfast/Jtouch/Jtouch/CMI Alps Electric/Nissha Printing 033240 KS Jahwa Electronics Co Ltd Foxconn/Chicony/Lite-on Sony/Sharp 108320 KS Silicon Works Co Ltd Novatek/Realtek/Himax/Orise/Sitronix/Itlitek Renesas Source: J.P. Morgan 9
- 10. JJ Park Asia Pacific Equity Research (822) 758-5717 04 March 2013 jj.park@jpmorgan.com Section II: Supply Chain Heat Map Sub-sector performance comparison Share price trend – snapshot of performance We note that the electronics material/PCB/electronic components sub-sectors have outperformed other sub-sectors in terms of share price performance (Jan 2012 -YTD). The PCB sub-sector's impressive performance can be attributed to increasing competitiveness of domestic FPCB makers such as Flexcom, Interflex and Korea Circuit. In addition, proactive capex investments have increased investor hopes for a better topline and bottomline growth in this sub-sector. The touch panel sector has been riding the smartphone/tablet growth wave as demand for touch functionality percolates to feature phones. Moreover, with the launch of Windows 8 in October 2012, the touch functionality is now being increasingly adopted in notebooks. These factors have fueled the growth of domestic touch panel module makers and touch sensor chip providers (Melfas). The electronics components sector thrived under high demand for ever-increasing image resolution specs and high pixel modules. SPE's poor run is mainly an indicator of negative investor sentiment on the AMOLED sector owing to delays in investment by SEC and technological glitches which affected yield. Further, high demand for Innox’s FCCL and EMI films and Duksan’s dominant position in OLED material supply has fueled growth in the electronics materials sector. Figure 3: Sub-sector wise share price performance (Market-cap Figure 4: Sub-sector wise share price (Market-cap weighted) weighted); Jan 2012 – YTD appreciation; Jan 2012 – YTD Jan 2012 = 100 % change since Jan,2012 180 60% 57% 53% 160 50% 38% 140 40% 30% 26% 25% 120 100 20% 80 10% 60 0% Jan-12 Apr-12 Jul-12 Oct-12 Jan-13 -10% -20% -10% Electronics Components PCB Electronics Material Touch Panel PCB Elec components Elec Materials Others (incl SPE SPE Touch Panel Others LED/Solar) Source: Bloomberg, J.P. Morgan Source: Bloomberg, J.P. Morgan Financial performance – Supply chain heat-map In terms of top-line growth, touch panel sectors presented the strongest growth over years especially during 2009-2012 followed by Electronic materials and Electronic components sectors. Margin-wise, the touch panel sector witnessed the highest margin expansion. PCB sectors' general performance (both in terms of top-line growth and margin expansion) was rather muted compared to top two sectors. We find that this is mainly due to Interflex whose share performance heavily appreciated upon serving Apple in addition to Samsung. While the SPE sector was the biggest revenue generating sub-sector at the beginning of 2007, now an electronic component has taken over its place. 10
- 11. JJ Park Asia Pacific Equity Research (822) 758-5717 04 March 2013 jj.park@jpmorgan.com Table 5: Korea Tech – Revenue and OP growth, margin trend with top two performing sub- sectors Revenue/OP in US$ mn, Growth/Margin in % 2007 2008 2009 2010 2011 2012 Revenue Electronic Components 1,236 1,348 1,559 1,972 2,620 3,174 PCB 1,206 1,209 1,282 1,762 2,226 2,799 Electronic Materials 156 143 189 323 428 512 SPE 1,049 1,095 956 1,629 2,192 1,783 Touch Panel 168 206 353 700 1,161 1,406 Others (incl. LED/Solar) 793 862 1,096 1,568 1,821 1,623 Total 4,608 4,862 5,435 7,955 10,447 11,296 Revenue growth Y/Y Electronic Components 25.1% 9.0% 15.7% 26.5% 32.8% 21.2% PCB 8.0% 0.3% 6.0% 37.4% 26.3% 25.8% Electronic Materials 27.1% -8.7% 32.9% 70.6% 32.4% 19.7% SPE -0.1% 4.4% -12.7% 70.4% 34.5% -18.7% Touch Panel 40.5% 22.3% 71.6% 98.6% 65.7% 21.1% Others (incl. LED/Solar) 9.0% 8.7% 27.1% 43.1% 16.1% -10.9% Total 11.7% 5.5% 11.8% 46.4% 31.3% 8.1% OP Electronic Components 70 40 160 176 197 215 PCB 1 38 85 143 154 198 Electronic Materials 23 16 18 32 61 72 SPE 134 100 76 165 217 140 Touch Panel 18 8 26 73 94 114 Others (incl. LED/Solar) 67 74 91 168 93 108 Total 319 305 483 813 799 781 OP Margin Electronic Components 5.7% 2.9% 10.2% 8.9% 7.5% 6.8% PCB 0.1% 3.1% 6.6% 8.1% 6.9% 7.1% Electronic Materials 14.4% 11.5% 9.7% 9.9% 14.4% 14.0% SPE 12.8% 9.2% 7.9% 10.1% 9.9% 7.8% Touch Panel 10.7% 4.0% 7.4% 10.4% 8.1% 8.1% Others (incl. LED/Solar) 8.5% 8.6% 8.3% 10.7% 5.1% 6.7% Total 6.8% 5.7% 8.4% 9.5% 7.8% 7.5% OP growth Y/Y Electronic Components -17.9% -43.7% 302.4% 10.3% 11.8% 9.5% PCB -96.0% 4908.6% 126.6% 68.1% 7.7% 28.9% Electronic Materials 43.0% -27.5% 13.0% 73.1% 92.3% 16.5% SPE -8.4% -25.4% -24.7% 118.8% 31.1% -35.6% Touch Panel 180.1% -54.8% 222.7% 178.7% 28.9% 20.6% Others (incl. LED/Solar) -16.7% 9.7% 23.8% 83.2% -44.2% 15.7% Total -11.5% -12.0% 65.4% 65.9% 7.9% 3.7% Source: Bloomberg, J.P. Morgan Revenue growth The touch panel sector outperformed other sub-sectors with a CAGR of 59% from 2009 - 2012. The success of Korean touch module makers hinges on stable production yields and increasing technological competitiveness. Also, increasing penetration of tablet-PCs has fueled the growth of this sector. Electronic components, PCB and electronic materials have registered revenue CAGR of 27%/30%/39% respectively. PCB sub-sector revenue growth has been resilient from 2009 - 2012, reflecting the ever changing landscape of the smartphone and tablet-PC market. SPE sector's revenue dipped in 2012 owing to yield issues while adopting the AMOLED technology for mid-large sized panels. Of note, Samsung's On cell AMOLED panels for its flagship smartphones is developed internally. 11
- 12. JJ Park Asia Pacific Equity Research (822) 758-5717 04 March 2013 jj.park@jpmorgan.com Figure 5: Sub-sector wise revenue growth Y/Y growth (%) 100% 80% 60% 40% 20% 0% -20% -40% 2007 2008 2009 2010 2011 2012 Electronic Components PCB Electronic Materials SPE Touch Panel Others (incl. LED/Solar) Source: Bloomberg, J.P. Morgan. Figure 6: Sub-sector wise revenue growth (CAGR): 2009 – 2012 CAGR (%) 100% 80% 59% 60% 39% 40% 27% 30% 23% 20% 14% 0% Electronic PCB Electronic SPE Touch Panel Others (incl. Components Materials LED/Solar) 3yr Revenue CAGR (2009-2012) Source: Bloomberg, J.P. Morgan Operating Profit/Operating profit margin In terms of OP CAGR, we find that touch panel, electronic materials, and PCB are the top three performing sub-sectors within the Korean Tech supply chain. We find commonalities across three sub-sectors; highly operating leverage as volume driven economies of scale provide margin improvement in longer-term. On the other hand, electronic components, SPE, and other sectors reported poor margin growth. Figure 7: Sub-sector wise 3 yr OP CAGR (2009-2012) CAGR (%) 100% 80% 63% 57% 60% 40% 33% 23% 20% 11% 6% 0% Electronic PCB Electronic SPE Touch Panel Others (incl. Components Materials LED/Solar) 3yr OP CAGR (2009-2012) Source: Bloomberg, J.P. Morgan. 12
- 13. JJ Park Asia Pacific Equity Research (822) 758-5717 04 March 2013 jj.park@jpmorgan.com On an annual OPM basis, FY12 margin remained flattish Y/Y while the electronic material sub-sector outperformed its peer sub-sectors. We find this is largely due to level of product differentiation as most electronic materials companies appear to have secured a dominant position in the niche-segment. Figure 8: Sub-sector wise Annual OPM trend OPM (%) 20% 14% 14% 15% 11% 10% 10% 10% 11% 10% 9% 9% 10% 10% 9%8% 10% 8%7%8% 8%7% 8% 8% 7% 8% 7% 7% 7% 5% 5% 3%3% 4% 0% 2008 2009 2010 2011 2012 Electronic Components PCB Electronic Materials SPE Touch Panel Others (incl. LED/Solar) Average Source: Bloomberg, J.P. Morgan. Big fishes becoming even bigger We note that the market cap of the top 5 companies in the Korean supply chain as a % of the total market cap of all the companies has steadily grown from 2009 to 2012. This theory especially holds true in case of touch panel makers where the degree of vertical integration is crucial. Also, in an environment of changing technological landscape, it is important for downstream tech companies to invest in R&D and capacity expansions in order to hold their ground in the marketplace. We note that the total contribution of the top 5 companies has steadily increased both in terms of topline and bottomline from 2009 onwards. Like the trend in large cap Asian Tech names, we find the trend of big fishes becoming even bigger even among Small Cap tech names (Asia-Pacific Tech Database: Finding winning sector and country, published in Sep. 2012). Figure 9: Top 5 market cap trend Figure 10: Korean tech: Top-5 revenue and OP contribution Portion (%) Portion (%) 30% 28% 40% 25% 25% 26% 25% 21% 22% 35% 19% 20% 17% 30% 15% 15% 25% 10% 20% 5% 15% 0% 10% 2004 2005 2006 2007 2008 2009 2010 2011 2012 2007 2008 2009 2010 2011 2012 Top 5 revenue contribution (%) Top 5 OP contribution (%) Major Top 5 Market Capitalization % over total Korea Tech small cap Source: Bloomberg, J.P. Morgan. *Note: Top 5 Market Cap companies refer to Source: Bloomberg, J.P. Morgan. *Note: Top 5 Market Cap companies refer to SFA, Partron, DSHM, Soulbrain and Interflex SFA, Partron, DSHM, Soulbrain and Interflex 13
- 14. JJ Park Asia Pacific Equity Research (822) 758-5717 04 March 2013 jj.park@jpmorgan.com The following table presents the market cap, revenue, OP and OPM for small cap companies in the Korean tech supply chain, ranked in decreasing order of market cap. Table 6: Korean tech supply chain (small cap) Market cap, Revenue and OP in USD millions, OPM (%) Name Market Cap 2012 Rev 2012 OP 2012 OPM SFA Engineering Corp 975 429 51 12% Partron Co Ltd 843 707 76 11% Duksan Hi-Metal Co Ltd 694 132 38 29% Soulbrain Co Ltd 627 525 88 17% Interflex Co Ltd 581 685 41 6% Iljin Display Co Ltd 555 527 58 11% Daeduck Electronics Co 506 657 49 7% Korea Circuit Co Ltd 373 393 31 8% Foosung Co Ltd 368 199 8 4% NEPES Corp 362 254 35 14% Melfas Inc 341 317 24 8% Wonik IPS Co Ltd 339 225 15 7% Iljin Materials Co Ltd 333 310 (3) -1% Jahwa Electronics Co Ltd 329 268 28 10% Silicon Works Co Ltd 319 420 42 10% Lumens Co Ltd 312 400 24 6% CrucialTec Co Ltd 271 122 (8) -7% Simm Tech Co Ltd 265 559 40 7% ELK Corp/Korea 264 163 4 2% KH Vatec Co Ltd 264 215 16 7% S-MAC Co Ltd/Korea 260 399 27 7% Flexcom Inc 256 304 21 7% INTOPS Co Ltd 254 494 21 4% Innox Corp 219 126 19 15% Kumho Electric Co Ltd 214 54 5 10% Jusung Engineering Co Ltd 203 68 (52) -77% Infraware Inc 201 39 9 22% Sapphire Technology Co Ltd 198 28 (7) -27% ICD Co Ltd 195 47 2 4% Sangbo Corp 189 225 15 7% e-LITECOM Co Ltd 183 448 30 7% BH Co Ltd 183 201 16 8% Innochips Technology Inc 174 68 12 18% Asia Pacific Systems Inc 174 197 9 4% Sekonix Co Ltd 157 131 14 11% Power Logics Co Ltd 148 227 5 2% WiSoL Co Ltd 141 76 13 17% ShinYang Engineering Co Ltd 136 97 2 2% Anapass Inc 124 99 11 11% Opto Device Technology Co Ltd 124 83 7 8% SNU Precision Co Ltd 119 39 (8) -20% RFsemi Technologies Inc 95 38 7 18% DNF Co Ltd 82 24 2 9% BSE Holdings Co Ltd 82 2 -0 3% i-Components Co Ltd 64 29 (0) -1% Barun Electronics Co Ltd 52 139 7 5% ABco Electronics Co Ltd 49 30 1 3% Sangsin Energy Display Precisi 40 82 4 4% Total 13,235 11,301 849 8% Source: Bloomberg; J.P. Morgan; Note: The aggregate OPM is calculated on a market-cap weighted basis 14
- 15. JJ Park Asia Pacific Equity Research (822) 758-5717 04 March 2013 jj.park@jpmorgan.com Section III: Finding winners within the sub- sectors In the below section, we categorize five sub-sectors, (1) Electronic components; (2) PCB; (3) Electronic materials; (4) SPE; and (5) Touch panel and analyze share price trend, financial performance, and key growth drivers of each sub sector. Electronic components sector Share performance Recent share price trend (Jan 2012 – YTD) clearly shows the impressive share price performance of camera module maker Partron and camera component makers such as Jahwa Electronics and Sekonix. Sekonix has been chosen as a supplier of 13MP camera lenses for SEC’s flagship smartphone, Galaxy S IV. In addition, Sekonix has been enjoying healthy production yield on its high-end lens business. Partron maintains a dominant position in the 3-MP segment and this has translated to higher margins compared to its peers. Casing makers such as Shinyang and Intops also delivered a healthy share price appreciation thanks to SEC’s robust smartphone growth. Iljin Materials’ share price slump can be attributed to the delayed recovery of profits in its PCB-elec foil business. Figure 11: Electronic Components: Share price appreciation: Jan 2012 – YTD % change since Jan, 2012 300% 256% 250% 193% 200% 150% 112% 109% 103% 78% 65% 100% 41% 38% 50% 9% 0% -50% -17% -18% -100% -41% -47% RF semi Tech INTOPS CrucialTech WiSoL Co e-LITECOM Jahwa Elec KH Vatec Iljin Materials ShinYang Foosung Sekonix Innochips Partron BSE Holdings Electronic components index Source: Bloomberg, J.P. Morgan Figure 12: Electronic Components: Share price trend: Jan 2012 – YTD Jan 2012 = 100 400 350 300 250 200 150 100 50 Jan-12 Apr-12 Jul-12 Oct-12 Jan-13 Partron Co Ltd Jahwa Electronics Co Ltd ShinYang Engineering Co Ltd Innochips Technology Inc Sekonix Co Ltd Source: Bloomberg, J.P. Morgan 15
- 16. JJ Park Asia Pacific Equity Research (822) 758-5717 04 March 2013 jj.park@jpmorgan.com Financial performance As highlighted above, Partron’s dominant position in the 3MP segment has translated to higher margins compared to its peers. Also, the migration to higher pixels has led to increase in OP for camera module makers. Iljin materials recorded a slump in its OP in 2012 on account of its PCB-electric foil business. Figure 13: Electronic components: Revenue trend 2008 - 2012 Figure 14: Electronic components: OP trend 2008 – 2012 USD, millions USD, millions 800.0 80.0 700.0 70.0 60.0 600.0 50.0 500.0 40.0 400.0 30.0 300.0 20.0 200.0 10.0 100.0 - - -10.0 2008 2009 2010 2011 2012 2008 2009 2010 2011 2012 Partron Jahwa Electronics Sekonix Partron Jahwa Electronics Sekonix Iljin Materials Intops E-litecom Intops Iljin Materials E-litecom Source: Bloomberg, J.P. Morgan. Source: Bloomberg, J.P. Morgan. Figure 15: Electronic components: Financial snapshot 2007 - 2012 Revenue and OP in USD millions; OPM (%) 3,500 12% 3,000 10% 2,500 8% 2,000 6% 1,500 4% 1,000 500 2% 0 0% 2007 2008 2009 2010 2011 2012 Revenue OP OPM (RHS) Source: Bloomberg, J.P. Morgan. Key growth drivers As smartphone makers are increasingly looking towards adopting hardware differentiation strategies, demand for high pixel modules (8+MP) and enhanced resolution will gain momentum on the back of high-end smartphone launches slated for 2Q13. Camera module makers should also benefit from the technology shift from standalone cameras to handset cameras. In addition, video calling and other enhanced features such as "motion recognition" should boost the specs for front cameras. 16
- 17. JJ Park Asia Pacific Equity Research (822) 758-5717 04 March 2013 jj.park@jpmorgan.com PCB sector Share performance Flexcom, an established supplier of FPCB products to SEC, has been riding the success of SEC's Galaxy Note 10.1 and Galaxy Note 2 after it began supplying its digitizer products, for use in these models, in 3Q12. Of note, Korea Circuit owns 32% stake in Interflex, which is Korea's top FPCB maker. BH's share price rallied during Jan 2012-YTD owing to its capacity expansion in 2012 which is expected to boost its bottomline. Figure 16: PCB: Share price appreciation: Jan 2012 – YTD Figure 17: PCB: Share price Trend: 2008 - 2012 Change since Jan, 2012 (%) Jan 2012 = 100 200% 179% 300 158% 250 150% 104% 200 100% 150 50% 20% 100 0% 50 -6% Jan-12 Apr-12 Jul-12 Oct-12 Jan-13 -50% -27% Daeduck Electronics Co Interflex Co Ltd Flexcom Inc Flexcom Korea Circuit BH Co Ltd Interflex Daeduck Simm Tech PCB sector index Simm Tech Co Ltd Korea Circuit Co Ltd BH Co Ltd Source: Bloomberg, J.P. Morgan. Source: Bloomberg, J.P. Morgan. Financial performance The PCB sector enjoyed a healthy growth during 2009 - 2010, both in terms of OPM and revenue. However, the growth appears to have slowed down during 2010 – 2012. Korea Circuit has enjoyed higher operating margins, thanks to stable production yields for PCB, and it is gaining increasing competitiveness in the PCB domain. Of note, Simm Tech’s revenue and OP both declined in 2012. Figure 18: PCB: Financial snapshot: 2007 – 2012 Revenue and OP in USD millions; OPM (%) 3,000 9% 8% 2,500 7% 2,000 6% 5% 1,500 4% 1,000 3% 2% 500 1% 0 0% 2007 2008 2009 2010 2011 2012 Revenue OP OPM (RHS) Source: Bloomberg, J.P. Morgan 17
- 18. JJ Park Asia Pacific Equity Research (822) 758-5717 04 March 2013 jj.park@jpmorgan.com Figure 19: PCB: Revenue trend: 2008 – 2012 Figure 20: PCB: OP trend: 2008 – 2012 USD millions USD millions 800.0 80.0 700.0 60.0 600.0 500.0 40.0 400.0 20.0 300.0 200.0 - 100.0 -20.0 - 2008 2009 2010 2011 2012 2008 2009 2010 2011 2012 Daeduck Electronics Interflex Flexcom Daeduck Electronics Interflex Flexcom SimmTech SimmTech Korea Circuit BH Korea Circuit BH Source: Bloomberg, J.P. Morgan. Source: Bloomberg, J.P. Morgan. Key growth drivers Migration towards slimmer and lighter mobile devices will continue to boost the PCB sector (high-density wiring). We expect demand for FPCB will grow in line with the smartphone and tablet-market growth as FPCB links the smartphone/tablet components to the main substrate. On an average, around five FPCBs are used per handset and around 10 FPCBs are used per tablet-PC. FPCB sector is largely impacted by economies of scale and yield. Higher economies of scale and high yield translate to higher margins. Increase in capacity expansion spending is also a key driver for this sector. Electronic Materials sector Share performance The tepid performance of Duksan Hi-Metal is primarily due to negative investor sentiment owing to delays in AMOLED TV launches, uncertainties in facility investment and doubts regarding marketability of AMOLED panels. As panel makers focus on producing large sized panels, the demand for multi-functional sheets (protection + prism) developed by Sangbo is gaining momentum, which has translated to positive share price movement. Further, high demand for Innox’s EMI films and flexible copper clad laminate (FCCL) films has fueled its growth. 18