
Empfohlen
Weitere ähnliche Inhalte
Ähnlich wie MODEL OF DEMAND
Ähnlich wie MODEL OF DEMAND (20)
Kürzlich hochgeladen
Kürzlich hochgeladen (20)
MODEL OF DEMAND
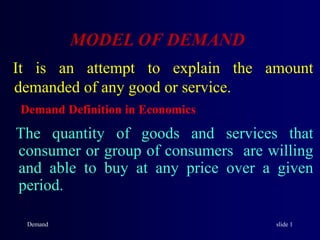
- 1. Demand slide 1 MODEL OF DEMAND It is an attempt to explain the amount demanded of any good or service. Demand Definition in Economics The quantity of goods and services that consumer or group of consumers are willing and able to buy at any price over a given period.
- 2. Demand slide 2 THE “STANDARD” MODEL OF DEMAND The DEPENDENT variable is the amount demanded. The INDEPENDENT variables are: The good’s own price The consumer’s money income The prices of other goods Preferences (tastes)
- 3. Demand slide 3 YOU COULD WRITE THE MODEL THIS WAY: The demand for Pizza QD(Pizza) = D(Ptacos, Income, Pspaghetti, tastes)
- 4. Demand slide 4 HOW CHANGES IN EACH INDEPENDENT VARIABLE AFFECT THE AMOUNT DEMANDED?
- 5. The Demand Schedule The quantity of a commodity that people buy at any one time depends on its price. Higher price means less demand. And other things being equal , Lower price means more demand Demand slide 5
- 6. Demand slide 6 Price $ per apple P Quantity demanded (million apple per year) Q A 5 9 B 4 10 C 3 12 D 2 15 E 1 20
- 7. Demand slide 7 THE DEMAND CURVE The demand curve for any good shows the quantity demanded at each price, holding constant all other determinants of demand. The DEPENDENT variable is the quantity demanded. The INDEPENDENT variable is the good’s own price.
- 8. Demand slide 8 THE LAW OF DEMAND A decrease in a good’s price will result in an increase in the amount demanded, holding constant all the other determinants of demand. The Law of Demand says that demand curves are negatively sloped.
- 9. Demand slide 9 A DEMAND CURVE A demand curve must look like this, i.e., be negatively sloped. own price quantity demanded demand Market for tacos
- 10. Demand slide 10 The demand curve means: You pick a price, such a p0, and the demand curve shows how much is demanded. own price quantity demanded demand p0 Q0 Market for tacos
- 11. Demand slide 11 What if the price of Pizza were less than p0? How do you show the effect on demand? Go to hidden slide
- 12. Demand slide 13 AN IMPORTANT POINT When drawing a demand curve notice that: - The axes are reversed from the usual convention of putting the dependent (y) variable on the vertical axis, - and the independent (x) variable on the horizontal axis.
- 13. Demand slide 14 Other factors affecting demand The question here is how to show the effects of changes in income, other goods’ prices, and tastes on demand.
- 14. Demand slide 15 Suppose people want to buy more of a good when incomes rise, holding constant all other factors affecting demand, including the good’s own price. own price quantity of Apple demand @ I = $1000 Market for apple How does this affect the demand curve? $1/can Go to hidden slide
- 15. Demand slide 17 Normal and inferior goods defined Normal good: When an increase in income causes an increase in demand. Inferior good: When an increase in income causes a decrease in demand.
- 16. Demand slide 18 Pizza is a normal good. own price quantity demand @ I = $1000 Market for pizza What’s the effect on the demand curve for pizza if income rises to $2,000? Go to hidden slide
- 17. Demand slide 20 Suppose instead that pizza was an inferior good. own price quantity demand @ I = $1000 Market for pizza What’s the effect on the demand curve for pizza if income rises to $2,000? Go to hidden slide
- 18. Demand slide 22 Substitutes defined Substitutes: Two goods are substitutes if an increase in the price of one of them causes an increase in the demand for the other. Thus, an increase in the price of pizza would increase the demand for spaghetti if the goods were substitutes.
- 19. Demand slide 23 The graph shows the demand curve for spaghetti when pizzas cost $10 each. own price quantity demand @ pizza price of $10 Market for spaghetti What’s the effect of an increase in the price of pizza to $15? Go to hidden slide
- 20. Demand slide 25 Complements defined Complements: Two goods are complements if an increase in the price of one of them causes a decrease in the demand for the other. Thus, an increase in the price of pizza would decrease the demand for Apple if the goods were complements.
- 21. Demand slide 26 The graph shows the demand curve for Apple when pizzas cost $10 each. price of Apple quantity demand @ pizza price of $10 Market for Apple What is the effect on the market for Apple of an increase in the price of pizza to $15? Go to hidden slide
- 22. Demand slide 28 The graph shows the demand curve for umbrellas on sunny days. price of umbrellas quantity demand on sunny days Market for umbrellas What’s the effect on demand of it being a rainy day? Go to hidden slide
- 23. Demand slide 30 DEMAND SUMMARY Demand is a function of own-price, income, prices of other goods, and tastes. The demand curve shows demand as a function of a good's own price, all else constant. Changes in own-price show up as movements along a demand curve. Changes in income, prices of substitutes and complements, and tastes show up as shifts in the demand curve.