Outlook for Week of March 26, 2018
•
0 gefällt mir•3,229 views

Free weekly newsletter with outlook and brief comments for world stock markets. Weekly reversal levels for stocks, gold and currencies. This method was designed to keep you on the right side of the market most of the time, letting the winners run while avoiding big losses on investments.

Empfohlen
Empfohlen
Weitere ähnliche Inhalte
Mehr von LunaticTrader
Mehr von LunaticTrader (17)
Kürzlich hochgeladen
Kürzlich hochgeladen (20)
Outlook for Week of March 26, 2018
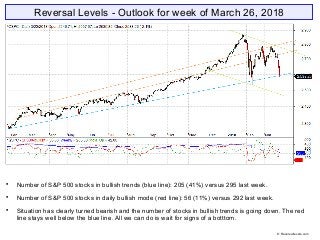
- 1. Reversal Levels - Outlook for week of March 26, 2018 Number of S&P 500 stocks in bullish trends (blue line): 205 (41%) versus 295 last week. Number of S&P 500 stocks in daily bullish mode (red line): 56 (11%) versus 292 last week. Situation has clearly turned bearish and the number of stocks in bullish trends is going down. The red line stays well below the blue line. All we can do is wait for signs of a botttom. © Reversallevels.com
- 2. ELC: down = bearish. BMO: down. The “blue snake” has also turned down This is a correction or early stage bear market. BMO is dropping to its lowest level since early 2016. If this indicator turns up it will be the first sign of a tradeable bottom. Be patient. © Reversallevels.com S&P 500 Weekly chart
- 3. S&P 500 and Australia AOI are giving sell signals, joining Nikkei, DAX and FTSE 100 in bearish trends. Brazil Bovespa remains weak bullish. Bonds TLT stay weak bearish. May tests their RevL at 122.23. Gold is weak bullish. If MoM turns up it would be a bullish continuation. EURUSD is weak bullish. 1.25 remains as strong overhead resistance. Oil sees MoM turn up, putting it back in fully bullish trend. Wheat is weak bullish. © Reversallevels.com Major indices
- 4. Sell signal for India Sensex, Israel TA100, Dow Industrials, Dow Transports and Russell 2000. Weekly MoM stays down for nearly all markets, so we can only repeat what we have been saying for weeks: stay patient. Stocks could stay in corrective patterns for several more months. We will get buy signals and bullish continuations when things turn back up again. When that will happen we don’t know. World markets © Reversallevels.com
- 5. Sell signals for AAPL, AXP, GS, HD, IBM, MMM and UTX. Speculative Buy signal for GE and PG. Partial profits signal for CSCO. A 32% gain in 29 weeks. 10 stocks bullish, down from 17 last week. Above 20 = bull market. See article: Keeping an eye on the Dow stocks Below 15 bullish stocks is longer term bearish. This is the lowest number since February 2016. And it could get worse before it gets better. Remember we got plenty of partial profits signals in January and February. If you used them to take some profits then you have cash ready to buy on the next Buy signals, which will come sooner or later. . 30 Dow Jones Industrials stocks © Reversallevels.com
- 6. Speculative Buy signal for $USDJPY. Note: Currencies tend to make long trending moves, so we don’t get weekly Buy or Sell signals very often. Keep trading in the direction of the weekly trend and you are likely to do well in the long run. Currencies © Reversallevels.com
- 7. On Twitter: http://twitter.com/lunatictrader1 On Facebook: https://wwww.facebook/Reversallevels/ On Stocktwits: http://stocktwits.com/LunaticTrader Website: Reversallevels.com For daily comments and questions you can find us here: © Reversallevels.com Disclaimer Investing in stocks, forex or commodities is risky. No guarantee can be given that the opinions or predictions given in this presentation will be correct. Reversallevels.com cannot in any way be responsible for eventual losses you may incur if you trade based on the given information. Simulated trading programs in general are subject to the fact that they are designed with the benefit of hindsight. No representation is being made that any account will or is likely to achieve profits or losses similar to those shown. Trade at your own risk and responsibility. Subscription service Daily reversal levels for over 2700 stocks and ETF are available by monthly subscription. For just $1 a day you can become a more efficient investor: click here Comes with full instructions and strategies for using the reversal levels and MoM indicator in your own trading. This is an honest method with limited risk, not a get rick quick formula. Give it a try.