Outlook for Week of June 22, 2020
•
0 gefällt mir•2,930 views

Free weekly newsletter with outlook and brief comments for world stock markets. Weekly reversal levels for stocks, gold and currencies. This method was designed to keep you on the right side of the market most of the time, letting the winners run while avoiding big losses.

Empfohlen
Empfohlen
Weitere ähnliche Inhalte
Mehr von LunaticTrader
Mehr von LunaticTrader (17)
Kürzlich hochgeladen
Kürzlich hochgeladen (20)
Outlook for Week of June 22, 2020
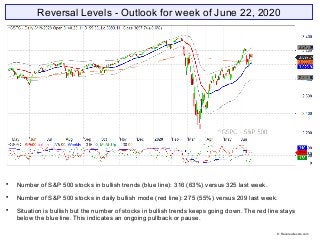
- 1. Reversal Levels - Outlook for week of June 22, 2020 Number of S&P 500 stocks in bullish trends (blue line): 316 (63%) versus 325 last week. Number of S&P 500 stocks in daily bullish mode (red line): 275 (55%) versus 209 last week. Situation is bullish but the number of stocks in bullish trends keeps going down. The red line stays below the blue line. This indicates an ongoing pullback or pause. © Reversallevels.com
- 2. ELC: up | BMO: down | Blue snake: up | Repellor: up. BMO keeps coming down from extreme peak levels. This is consistent with an ongoing pullback or pause. For how long we don’t know. In minor corrections BMO typically bottoms out near the zero line (see 2016-2017 for plenty examples). © Reversallevels.com S&P 500 Weekly chart
- 3. All major stocks indexes are in bullish trends with upward MoM. Bonds TLT are weak bullish and appear on their way to test the RevL, currently at 153.11. Gold is weak bullish. If it is an ongoing bull market then look for MoM to turn back up before the RevL gets tested. EURUSD is in a fresh bullish trend. Needs follow through. Oil is fully bullish. © Reversallevels.com Major indices
- 4. No major changes this week. The majority of markets is in bullish trends with upward MoM. But the move appears to be stalling. Egypt EGX30 is our current best performer. It is down 20.8% since its Sell signal 16 weeks ago. World markets © Reversallevels.com
- 5. Sell signal for XOM. Partial profits signal for AAPL. A 25% gain in 9 weeks. Partial profits signal for MSFT. A n18% gain in 10 weeks. 20 stocks bullish, down from 21 last week. Above 20 = bull market. See: Keeping an eye on the Dow stocks AAPL is our current best performer. A 25.8% gain since its Buy signal 9 weeks ago and the move is ongoing. . 30 Dow Jones Industrials stocks © Reversallevels.com
- 6. Weak Buy signal for USDBRL. Possible fake-out move. Sell signal for USDJPY. Bearish divergence for Bitcoin. Sputtering rally that may fail. For daytraders or swing traders: if you do your trading in the direction of the weekly trend you are likely to do well in the long run. So, try to buy the pullbacks in currencies pairs that are in bullish trends and sell the rallies during bearish trends. Forex & Crypto © Reversallevels.com
- 7. On Twitter: http://twitter.com/lunatictrader1 On Stocktwits: http://stocktwits.com/LunaticTrader Website: Reversallevels.com For daily comments and questions you can find us here: © Reversallevels.com Disclaimer Investing in stocks, forex or commodities is risky. No guarantee can be given that the opinions or predictions given in this presentation will be correct. Reversallevels.com cannot in any way be responsible for eventual losses you may incur if you trade based on the given information. Simulated trading programs in general are subject to the fact that they are designed with the benefit of hindsight. No representation is being made that any account will or is likely to achieve profits or losses similar to those shown. Trade at your own risk and responsibility. Subscription service Daily reversal levels for over 3000 stocks and ETF are available by monthly subscription. For less than $1 a day you can become a more efficient investor: 1 Month ($22) 6 Months ($110) 1 Year ($199) Comes with full instructions and strategies for using the reversal levels and MoM indicator in your own trading. This is an honest method with limited risk, not a get rick quick formula. Give it a try.