Outlook for Week of July 23, 2018
•
0 gefällt mir•2,696 views

Free weekly newsletter with outlook and brief comments for world stock markets. Weekly reversal levels for stocks, gold and currencies. This method was designed to keep you on the right side of the market most of the time, letting the winners run while avoiding big losses.

Empfohlen
Empfohlen
Weitere ähnliche Inhalte
Mehr von LunaticTrader
Mehr von LunaticTrader (17)
Kürzlich hochgeladen
Kürzlich hochgeladen (20)
Outlook for Week of July 23, 2018
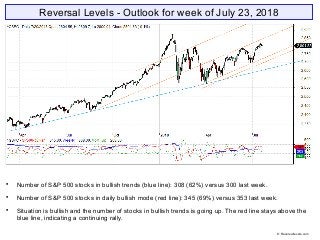
- 1. Reversal Levels - Outlook for week of July 23, 2018 Number of S&P 500 stocks in bullish trends (blue line): 308 (62%) versus 300 last week. Number of S&P 500 stocks in daily bullish mode (red line): 345 (69%) versus 353 last week. Situation is bullish and the number of stocks in bullish trends is going up. The red line stays above the blue line, indicating a continuing rally. © Reversallevels.com
- 2. ELC: flat and slightly upward. BMO: turning down. Blue snake: up. Positive but hesitating at overhead resistance. If the S&P 500 can push above the upper boundary of the snake @2829 then it will reconfirm the bullish picture. © Reversallevels.com S&P 500 Weekly chart
- 3. Most major stock indexes are in bullish trends. But follow through is needed to keep the momentum up. German DAX and Brazil Bovespa stay in bearish trends. Bonds TLT are in a young bullish trend. Follow through needed to avoid a failed rally. Gold stays fully bearish. EURUSD is weak bearish. May go for a test of its weekly RevL, currently at 1.1969. Oil changes to weak bullish because MoM turns down. Wheat is weak bullish and back above the 500 level. Hold. © Reversallevels.com Major indices
- 4. Buy signal for Switzerland SMI. The picture for world markets remains very mixed, but a few more markets are changing to upward MoM. That’s a positive but we need more buy signals to conclude that world markets have left the recent corrections behind them. World markets © Reversallevels.com
- 5. Buy signal for JPM. Partial profit signal for NKE. A 38% gain in 38 weeks. 21 stocks bullish, up from 20last week. Above 20 = bull market. See article: Keeping an eye on the Dow stocks So far so good. Looks like a continuing bull market until proven otherwise. . 30 Dow Jones Industrials stocks © Reversallevels.com
- 6. Bullish divergence for Bitcoin BTCUSD. Partial profits signal for USDBRL. A 14% gain in 23 weeks. Partial profits signal for USDINR. A 6% gain in 21 weeks. Currencies tend to make long trending moves, so we don’t get weekly Buy or Sell signals very often. For daytraders or swing traders: if you do your trading in the direction of the weekly trend you are likely to do well in the long run. So, try to buy the pullbacks in currencies pairs that are in weekly bullish trends and sell the rips during weekly bearish trends. Currencies © Reversallevels.com
- 7. On Twitter: http://twitter.com/lunatictrader1 On Facebook: https://wwww.facebook/Reversallevels/ On Stocktwits: http://stocktwits.com/LunaticTrader Website: Reversallevels.com For daily comments and questions you can find us here: © Reversallevels.com Disclaimer Investing in stocks, forex or commodities is risky. No guarantee can be given that the opinions or predictions given in this presentation will be correct. Reversallevels.com cannot in any way be responsible for eventual losses you may incur if you trade based on the given information. Simulated trading programs in general are subject to the fact that they are designed with the benefit of hindsight. No representation is being made that any account will or is likely to achieve profits or losses similar to those shown. Trade at your own risk and responsibility. Subscription service Daily reversal levels for over 3000 stocks and ETF are available by monthly subscription. For less than $1 a day you can become a more efficient investor: 1 Month ($22) 6 Months ($110) 1 Year ($199) Comes with full instructions and strategies for using the reversal levels and MoM indicator in your own trading. This is an honest method with limited risk, not a get rick quick formula. Give it a try.