Outlook for Week of December 21, 2020
•
0 gefällt mir•53 views

Outlook for Week of December 14, 2020

Empfohlen
Empfohlen
Weitere ähnliche Inhalte
Mehr von LunaticTrader
Mehr von LunaticTrader (17)
Kürzlich hochgeladen
Kürzlich hochgeladen (20)
Outlook for Week of December 21, 2020
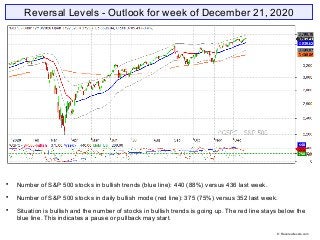
- 1. Reversal Levels - Outlook for week of December 21, 2020 Number of S&P 500 stocks in bullish trends (blue line): 440 (88%) versus 436 last week. Number of S&P 500 stocks in daily bullish mode (red line): 375 (75%) versus 352 last week. Situation is bullish and the number of stocks in bullish trends is going up. The red line stays below the blue line. This indicates a pause or pullback may start. © Reversallevels.com
- 2. ELC: up | BMO: up | Blue snake: up | Repellor: up. All indicators stay bullish. But BMO is flattening out in high + 2 territory and may turn down soon. The overhead long term trendline stays in place as major resistance. © Reversallevels.com S&P 500 Weekly chart
- 3. All major stock indexes are in bullish trends with upward MoM. Bonds TLT are back to fully bearish with downward MoM. Gold is in a bearish trend but testing its RevL. EURUSD stays fully bullish with upward MoM. Oil is in a bullish trend and adding to gains. © Reversallevels.com Major indices
- 4. Bearish divergence for Sweden OMX30 Partial profits signal for India Sensex. A 27% gain in 23 weeks. Most global markets are in bullish trends. Nigeria NGSE is our current best performer. It is up 46% since its Buy signal 30 weeks ago. World markets © Reversallevels.com
- 5. Sell signal for INTC. Partial profits for CAT. A 33% gain in 28 weeks. Partial profits for NKE. A 43% gain in 30 weeks. 25 stocks bullish, down from 26 last week. Above 20 = bull market. See: Keeping an eye on the Dow stocks AAPL remains our best performer in this group. A 82% gain since its Buy signal 35 weeks ago and the move is ongoing. . 30 Dow Jones Industrials stocks © Reversallevels.com
- 6. Speculative Buy signal for USDCNY. For daytraders or swing traders: if you do your trading in the direction of the weekly trend you are likely to do well in the long run. So, try to buy the pullbacks in currencies pairs that are in bullish trends and sell the rallies during bearish trends. Forex & Crypto © Reversallevels.com
- 7. On Twitter: http://twitter.com/lunatictrader1 On Stocktwits: http://stocktwits.com/LunaticTrader Website: Reversallevels.com For daily comments and questions you can find us here: © Reversallevels.com Disclaimer Investing in stocks, forex or commodities is risky. No guarantee can be given that the opinions or predictions given in this presentation will be correct. Reversallevels.com cannot in any way be responsible for eventual losses you may incur if you trade based on the given information. Simulated trading programs in general are subject to the fact that they are designed with the benefit of hindsight. No representation is being made that any account will or is likely to achieve profits or losses similar to those shown. Trade at your own risk and responsibility. Subscription service Daily reversal levels for over 3000 stocks and ETF are available by monthly subscription. For less than $1 a day you can become a more efficient investor: 1 Month ($22) 6 Months ($110) 1 Year ($199) Comes with full instructions and strategies for using the reversal levels and MoM indicator in your own trading. This is an honest method with limited risk, not a get rick quick formula. Give it a try.