Outlook for Week of April 9, 2018
•
0 gefällt mir•3,176 views

Free weekly newsletter with outlook and brief comments for world stock markets. Weekly reversal levels for stocks, gold and currencies. This method was designed to keep you on the right side of the market most of the time, letting the winners run while avoiding big losses on investments.

Empfohlen
Empfohlen
Weitere ähnliche Inhalte
Mehr von LunaticTrader
Mehr von LunaticTrader (17)
Kürzlich hochgeladen
Kürzlich hochgeladen (20)
Outlook for Week of April 9, 2018
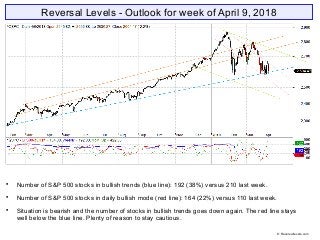
- 1. Reversal Levels - Outlook for week of April 9, 2018 Number of S&P 500 stocks in bullish trends (blue line): 192 (38%) versus 210 last week. Number of S&P 500 stocks in daily bullish mode (red line): 164 (22%) versus 110 last week. Situation is bearish and the number of stocks in bullish trends goes down again. The red line stays well below the blue line. Plenty of reason to stay cautious. © Reversallevels.com
- 2. ELC: down. BMO: down. Blue snake: down. Bearish until something turns back up. This is a correction or early stage bear market. BMO is at its lowest level since early 2016. If this indicator turns up it will be the first sign of a tradeable bottom. © Reversallevels.com S&P 500 Weekly chart
- 3. MoM turns up for Nikkei, FTSE 100 and DAX. Changes their status to weak bearish. Except for Brazil Bovespa all major markets stay in bearish trends. Bonds TLT are weak bearish and stalling just below their RevL. Gold is weak bullish and holding up well. Needs follow through. EURUSD is weak bullish. 1.25 remains strong overhead resistance. Oil is back to weak bullish. MoM is down and a test of RevL at 57.67 becomes more likely. Wheat stays weak bullish. If MoM can turn back up it will be a bullish continuation. © Reversallevels.com Major indices
- 4. Sell signal for Thailand SET. MoM turns up for a few more markets. That’s a slight plus, but there is still a lot of red in the table. Stocks could stay in corrective patterns for several more months. We will get buy signals and bullish continuations when things turn back up again. World markets © Reversallevels.com
- 5. Ongoing Speculative Buy signal for GE and PG. 10 stocks bullish, unchanged from 10 last week. Above 20 = bull market. See article: Keeping an eye on the Dow stocks Below 15 bullish stocks is longer term bearish. This is the lowest number since February 2016. In a prolonged bear market the number of bullish stocks can drop to zero. When it climbs back above 20 we will have a strong indication that the correction or bear market is over. . 30 Dow Jones Industrials stocks © Reversallevels.com
- 6. Buy signal for USDRUB. Currencies tend to make long trending moves, so we don’t get weekly Buy or Sell signals very often. For forex daytraders or swing traders: if you do your trading in the direction of the weekly trend you are likely to do well in the long run. So, try to buy the pullbacks in currencies pairs that are in weekly bullish trends and sell the rips during weekly bearish trends. Currencies © Reversallevels.com
- 7. On Twitter: http://twitter.com/lunatictrader1 On Facebook: https://wwww.facebook/Reversallevels/ On Stocktwits: http://stocktwits.com/LunaticTrader Website: Reversallevels.com For daily comments and questions you can find us here: © Reversallevels.com Disclaimer Investing in stocks, forex or commodities is risky. No guarantee can be given that the opinions or predictions given in this presentation will be correct. Reversallevels.com cannot in any way be responsible for eventual losses you may incur if you trade based on the given information. Simulated trading programs in general are subject to the fact that they are designed with the benefit of hindsight. No representation is being made that any account will or is likely to achieve profits or losses similar to those shown. Trade at your own risk and responsibility. Subscription service Daily reversal levels for over 2700 stocks and ETF are available by monthly subscription. For just $1 a day you can become a more efficient investor: click here Comes with full instructions and strategies for using the reversal levels and MoM indicator in your own trading. This is an honest method with limited risk, not a get rick quick formula. Give it a try.