
Empfohlen
Weitere ähnliche Inhalte
Was ist angesagt?
Was ist angesagt? (20)
Ähnlich wie Princeton Area Real Estate Stats October 25th
Ähnlich wie Princeton Area Real Estate Stats October 25th (12)
Mehr von Linda Twining
Mehr von Linda Twining (20)
Kürzlich hochgeladen
Kürzlich hochgeladen (20)
Princeton Area Real Estate Stats October 25th
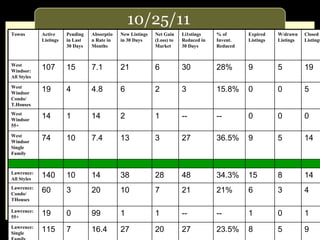
- 1. 10/25/11 Towns Active Listings Pending in Last 30 Days Absorption Rate in Months New Listings in 30 Days Net Gain (Loss) to Market Li1stings Reduced in 30 Days % of Invent. Reduced Expired Listings W/drawn Listings Closed Listings West Windsor: All Styles 107 15 7.1 21 6 30 28% 9 5 19 West Windsor Condo/ T.Houses 19 4 4.8 6 2 3 15.8% 0 0 5 West Windsor 55+ 14 1 14 2 1 -- -- 0 0 0 West Windsor Single Family 74 10 7.4 13 3 27 36.5% 9 5 14 Lawrence: All Styles 140 10 14 38 28 48 34.3% 15 8 14 Lawrence: Condo/ THouses 60 3 20 10 7 21 21% 6 3 4 Lawrence: 55+ 19 0 99 1 1 -- -- 1 0 1 Lawrence: Single Family 115 7 16.4 27 20 27 23.5% 8 5 9
- 2. 10/25/11 Towns Active Listings Pending in Last 30 Days Absorption Rate in Months New Listings in 30 Days Net Gain (Loss) to Market Listings Reduced in 30 Days % of Invent. Reduced Expired Listings W/drawn Listings Closed Listings PlainsboroAll Styles Plainsboro Condo/ THouses Plainsboro 55+ Plainsboro Single Family Cranbury: All Styles
- 3. 10/25/11 Towns Active Listings Pending in Last 30 Days Absorption Rate in Months New Listings in 30 Days Net Gain (Loss) to Market Listings Reduced in 30 Days % of Invent. Reduced Expired Listings W/drawn Listings Closed Listings Ewing: All Styles 288 17 16.9 38 21 64 22% 15 9 20 Ewing : Condo/ T.Houses 34 4 8.5 6 2 8 24% 5 2 6 Ewing 55+: 11 1 11 2 1 --- --- 0 0 1 Ewing: Single Family 243 12 20.3 30 18 56 23% 10 7 13 East Windsor: All Styles 231 5 46.2 31 26 39 18% 21 11 12 East Windsor: Condo/ Thouses 133 1 133 16 15 25 19% 15 6 5 East Windsor: 55+ 14 0 999 2 2 --- --- 0 0 0 East Windsor: Single Family 84 4 21 13 11 14 17% 6 5 7
- 4. 10/25/11 Towns Active Listings Pending in Last 30 Days Absorption Rate in Months New Listings in 30 Days Net Gain (Loss) to Market Listings Reduced in 30 Days % of Invent. Reduced Expired Listings W/drawn Listings Closed Listings Hopewell Twp. All Styles 169 5 34 24 19 38 22% 15 10 15 Hopewell Twp. Condo/ T.Houses 14 2 7 3 1 4 28.5% 8 0 4 Hopewell Twp.: 55+ 6 0 99 0 0 -- -- 1 1 1 Hopewell Twp Single Family 149 3 50 21 18 34 23% 6 9 9 Hamilton: All Styles 648 38 17 108 70 152 23% 42 22 66 Hamilton: Condo/ THouses 100 8 12.5 20 12 19 19% 11 5 6 Hamilton: 55+ 44 4 11 5 1 -- -- 3 2 4 Hamilton: Single Family 504 26 19 83 57 133 26% 28 15 56
- 5. 10/25/11 Towns Active Listings Pending in Last 30 Days Absorption Rate in Months New Listings in 30 Days Net Gain (Loss) to Market Listings Reduced in 30 Days % of Invent. Reduced Expired Listings W/drawn Listings Closed Listings Robbinsville All Styles 138 19 7 19 0 34 25% 9 7 16 Robbinsville Condo/ T.Houses 59 10 6 8 2 16 27% 4 5 8 Single Family 79 9 9 11 2 18 23% 5 2 8 Hightstown Boro: All Styles 66 4 16 8 4 14 21% 11 1 5 Pennington 21 2 10.5 4 2 6 29% 0 1 2 Hopewell Boro 12 2 6 2 0 3 25% 1 0 3
- 6. 10/25/11 Towns Active Listings Pending in Last 30 Days Absorption Rate in Months New Listings in 30 Days Net Gain (Loss) to Market Listings Reduced in 30 Days % of Invent. Reduced Expired Listings W/drawn Listings Closed Listings Princeton Boro: All Styles 43 9 4.8 8 -1 14 32.6% 0 2 3 Pton -Boro Condo/ Thouses 20 4 5 3 -1 7 35% 0 2 1 Pton-Boro Single Family 23 5 4.6 5 0 7 30.4% 0 0 2 Pton Twp: All Styles 152 8 19 15 7 26 17.1% 5 4 11 Pton Twp: Condo/ Thouses 23 1 23 4 3 4 17.4% 0 0 3 Pton Twp: Single Family 129 7 18.4 11 4 22 17.1% 5 4 8
- 7. 10/25/11 Towns Active Listings Pending in Last 30 Days Absorption Rate in Months New Listings in 30 Days Net Gain (Loss) to Market Listings Reduced in 30 Days % of Invent. Reduced Expired Listings W/drawn Listings Closed Listings South Brunswick All Styles 275 6 46 43 37 50 18 37 6 21 South BrunswickCondo/ T.Houses 84 5 17 13 8 21 25 13 1 3 South Brunswick 55+ 34 0 99 1 1 7 20 2 1 3 South Brunswick Single Family 157 1 157 29 28 22 14 22 4 15 Monroe: All Styles 521 14 37 98 84 80 15 50 9 51 Monroe: 55+ 323 7 46 72 65 55 17 27 3 43 Monroe: Single Family 198 7 28 26 19 25 13 23 6 9
- 8. 10/25/11 Towns Active Listings Pending in Last 30 Days Absorption Rate in Months New Listings in 30 Days Net Gain (Loss) to Market Listings Reduced in 30 Days % of Invent. Reduced Expired Listings W/drawn Listings Closed Listings Montgomery All Styles Montgomery Condo/Twnhms Single Family Hillsborough All Styles Hillsborough Condo/Twnhms Hillsborough Single Family
Hinweis der Redaktion
- Populate this table to show the local absorption rate in the various price ranges that are appropriate for your market area. Please add or delete rows as necessary to adequately reflect local conditions.
- Populate this table to show the local absorption rate in the various price ranges that are appropriate for your market area. Please add or delete rows as necessary to adequately reflect local conditions.
- Populate this table to show the local absorption rate in the various price ranges that are appropriate for your market area. Please add or delete rows as necessary to adequately reflect local conditions.
- Populate this table to show the local absorption rate in the various price ranges that are appropriate for your market area. Please add or delete rows as necessary to adequately reflect local conditions.
- Populate this table to show the local absorption rate in the various price ranges that are appropriate for your market area. Please add or delete rows as necessary to adequately reflect local conditions.
- Populate this table to show the local absorption rate in the various price ranges that are appropriate for your market area. Please add or delete rows as necessary to adequately reflect local conditions.
- Populate this table to show the local absorption rate in the various price ranges that are appropriate for your market area. Please add or delete rows as necessary to adequately reflect local conditions.
- Populate this table to show the local absorption rate in the various price ranges that are appropriate for your market area. Please add or delete rows as necessary to adequately reflect local conditions.