More than Just Lines on a Map: Best Practices for U.S Bike Routes
Poster_LW_AT_FINAL
1. • Aim 1: The association IBQ and BDI (centered at the baseline)
LMM models with random intercept and time effect, adjusted for all the
important confounders, time fixed effects; without FRS or DOL1/2 in the model.
• Aim2: The association between IBQ and FRS/DOL
Same settings as in Aim1, but with only FRS or DOL1/2 in the model;
1) DOL vs IBQ: DOL’s were centered at 4
2) FRS vs IBQ: FRS’s were centered at baseline (FRS37wk)
• Aim3: The association between FRS/DOL1/DOL2 and BDI
• Missing data
• Missing data:
Drop subjects with 0 observation of IBQ or FRS and DOL (143à101)
• Run and select for the linear mix models (LMM)
First select fixed effects based on likelihood ratio tests (LRT), then test
for the random effects. Fit the model under REML for estimation and
inference in the results section.
• Time profile model vs linear model
• Model the BDI baseline before month 3 after the birth.
IBQ positive model, the average of pre-BDI measures is sufficient to fit for all the
pre-measure information; while for IBQ negative model, we need the measure of
BDI in week37 in the model in addition to the average baseline.
• Reduce the 9 confounders
Mother and father’s education, mother’s age, smoking, gender of the infant,
income, medication, mother’s weight and GA_WKS*
• Test on the random time effect
IBQ positive model doesn’t need the random time effect (p-val: 0.50)
IBQ negative model needs the random time effect (p-val: 0.00)
Motivations and Study design
Motivations and backgrounds
• Research has shown that the maternal depression would affect the newborns
behaviors.
• Maternal depressive symptoms, even in the absence of major depressive
disorder, appeared to facilitate a different developmental pathway for the infant
LHPA* and early neurological development.
Questions
• What is the overtime association between infants behaviors (IBQ) and maternal
depression (BDI) ? Significant?
• Whether the association between IBQ and BDI is affected by the Division of
labors (DOL) or the family resources supply (FRS)?
Modeling
Summary and Conclusions
Depression Effects on Infant Outcomes
Lili Wang1, Ariana Tang1
1Department of Biostatistics, University of Michigan, Ann Arbor
Exploratory Analysis
• The spaghetti- and box-plots of time-dependent variables/outcomes
• The correlations between outcomes and variables
1) IBQ counts are positively correlated: baby with more positive behavior also has
more negative behavior
2) Moderate correlation between IBQ-neg and BDI
3) BDI at 2 weeks after birth appears to be most indicative of negative behavior for
3, 7 and 14 months
*LHPA: infant limbichypothalamic-pituitary-axis
Results
Outcome Model Df AIC BIC LRT pval
IBQ_pos
Profile (M1) 32 401.9 492.2 --
Linear time 28 413.5 497.3 0.00
IBQ_neg
Profile 32 371.5 461.8 --
Linear time (M2) 28 368.3 452.2 0.67
Outcome Model Df AIC BIC LRT pval
IBQ_pos
All 9 confounders 28 401.9 492.2 --
Only income, mother education, mother age 22 393.3 463.2 0.89
IBQ_neg
All 9 confounders 27 369.3 456.4 --
Only medication, Smoke, mother age 21 361.54 429.3 0.65
*GA_WKS: Gestational Age in Weeks
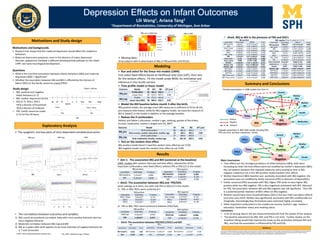
• Aim4: IBQ vs BDI in the presence of FRS and DOL’s
Study design
• IBQ: positive and negative
infant behaviors (1-7)
• BDI: mother depression (0-63)
• DOL(1-7): DOL1, DOL2
•DOL1:division of household
•DOL2:division of childcare
• FRS: Family resources scales
(1-5) for first 20 items
IBQ positive
covariates Estimates P-values
BDI baseline 1.21x10⁻² 0.402
BDI 0.35x10⁻² 0.838
IBQ negative
covariates Estimates P-values
BDI baseline 4.62x10⁻² 0.001
BDI wk37 -1.92x10⁻² 0.319
BDI -1.37x10⁻² 0.340
IBQ positive
covariates Estimates P-values
DOL1 32wk 3.85x10⁻² 0.751
DOL1 10.6x10⁻² 0.314
DOL2 3.01x10⁻² 0.674
IBQ negative
covariates Estimates P-values
DOL1 32wk -3.77x10⁻² 0.751
DOL1 -7.95x10⁻² 0.412
DOL2 -8.87x10⁻² 0.140
IBQ positive
covariates Estimates P-values
FRS37wk 9.36x10⁻⁴ 0.919
FRS 1.18x10⁻² 0.017
IBQ negative
covariates Estimates P-values
FRS37wk -1.60x10⁻² 0.068
FRS -0.56x10⁻² 0.159
FRS
covariates Estimates P-val
BDI baseline -0.822 0.00
BDI -0.307 0.04
DOL1
covariates Estimates P-val
BDI baseline 0.229x10⁻² 0.889
BDI 0.972x10⁻² 0.202
DOL2
covariates Estimates P-val
BDI baseline 1.32x10⁻² 0.509
BDI -1.11x10⁻² 0.279
IBQ positive
covariates Estimates 95%CI P-val
BDI baseline 1.96x10⁻² -0.79~4.74x10⁻² 0.192
BDI -1.01x10⁻² -5.56~3.48x10⁻² 0.674
DOL1_32wk -1.19x10⁻² -2.45~2.25x10⁻² 0.925
DOL1 -4.64x10⁻³ -2.24~2.06x10⁻² 0.968
DOL2 9.39x10⁻² -6.01~24.4x10⁻² 0.248
FRS_37wk -1.10x10⁻³ -1.73~1.96x10⁻² 0.912
FRS 1.47x10⁻² 0.47~2.49x10⁻² 0.006
Time_mo7 0.735 0.529~0.935 0.000
Time_mo14 0.990 0.770~1.208 0.000
Income -4.18x10⁻² -7.23~-1.16x10⁻² 0.012
Mother Edu -7.53x10⁻² -14.6~-0.488x10⁻² 0.051
Mother Age 4.56x10⁻² 1.03~8.10x10⁻² 0.019
BDI*DOL1 -2.22x10⁻² -5.58~1.16x10⁻² 0.218
BDI*DOL2 2.12x10⁻² -0.544~4.77x10⁻² 0.133
BDI*FRS -1.25x10⁻⁴ -0.167~0.19x10⁻² 0.896
BDI*Time_mo7 2.38x10⁻³ -2.95~7.65x10⁻² 0.396
BDI*Time_mo14 5.12x10⁻⁵ -4.74~4.75x10⁻² 0.998
IBQ negative (Time is coded as 0, 4,11)
covariates Estimates 95% CI P-val
BDI baseline 3.89x10⁻² 1.26~6.51x10⁻² 0.007
BDI wk37 -1.28x10⁻² -4.89~2.39x10⁻² 0.511
BDI -1.92x10⁻² -5.24~1.52x10⁻² 0.280
DOL1_32wk -5.33x10⁻² -0.263~0.151 0.630
DOL1 -0.116 -0.297~0.0723 0.235
DOL2 9.93x10⁻² -1.54~21.4x10⁻² 0.106
FRS_37wk -7.16x10⁻³ -2.38~0.969x10⁻² 0.429
FRS -6.50x10⁻² -1.45~0.125x10⁻² 0.120
Time (months) 8.31x10⁻² 0.065~0.101 0.000
Medication 0.233 -0.137~0.605 0.246
Smoke 0.847 0.062~1.645 0.048
Mother Age 2.69x10⁻² 0.165~5.16x10⁻² 0.047
BDI*DOL1 -1.76x10⁻² -4.445~0.837x10⁻² 0.200
BDI*DOL2 6.93x10⁻³ -1.487~2.802x10⁻² 0.536
BDI*FRS -6.31x10⁻⁴ -0.208~0.079x10⁻² 0.400
BDI*Time 1.05x10⁻³ -0.256~0.462x10⁻² 0.573
Main Conclusions
• Time effects are the strongest predictors of infant behaviors (IBQ); both were
increasing by time; the time effects were not modified by mother’s depression (BDI);
the correlations between the repeated measures were varying by time in IBQ
negative model but not in the IBD positive model (random time effect).
• Mother depression (BDI) baseline was positively associated with IBQ negative; the
association was not modified by family resources (FRS) or divisions of labors(DOL).
• Family resources (FRS) associates with IBQ; Higher FRS tends to have higher IBQ
positive while less IBQ negative. FRS is also negatively associated with BDI. Adjusted
for FRS, the association between BDI and IBQ negative was still significant. Thus FRS
is a potential partial mediator of BDI’s effect on IBQ negative.
• Mothers would have more household labors (DOL1) but less child care labors (DOL2)
over time since birth. Neither was significantly associated with IBQ conditionally nor
marginally. Interestingly they themselves were extremely highly correlated.
• Other important confounders in the models are income, mother’s age, mother’s
education, medication status and smoking status.
Limitations
• A lot of missing data in the last measurement(mo14) limit the power of the analysis.
• The baseline adjustment for BDI, DOL and FRS is not strict. Further studies on the
baselines fitting would help improve the study on the association between BDI and
IBQ, and how the association is influenced by FRS and DOL.
References
Vivette Glover, Maternal depression,anxiety and stress during pregnancy and child outcome;whatneeds to be done,Best Practice & Research Clinical Obstetrics & Gynaecology,2014
Sheila Marcus, Juan F. Lopez,Susan McDonough,Michael J.MacKenzie,Heather Flynn, Charles R. Neal Jr., Sheila Gahagan,Brenda Volling,Niko Kaciroti,Delia M. Vazquez,
Depressive symptoms during pregnancy:Impact on neuroendocrine and neonatal outcomes,InfantBehavior and Development,2011
Adjusted association in IBQ LMM models including BDI,
FRS and DOL and their interactions (Aim4)
FRS
BDI
IBQ
Positive
IBQ
Negative
Income
Mother
age
Mother
Edu
Time
Smoke
DOL1
DOL2
Positive
Negative
Marginal
IBQ pos vs IBQ neg IBQ vs IBD
DOL1 DOL2IBD
IBQ pos IBQ neg FRS
Pairwise associations in LMM models from Aim1-3
Smoke
FRS
DOL2
DOL1
BDI
IBQ
Positive
IBQ
Negative
Income
Mother
age
Mother
Edu
Time
Medication