The true source and cost of delaying savings

Most discussions of the cost of delaying the start of a savings program focus on the differences between dollar balances between delaying and starting sooner. However, what really is happening is the shift in time, which I illustrate below. Delaying 10 years now actually shifts what you would have had later by 10 years. Of course, those lost later 10 years may not be available for you to make them up, as explained below. So, the real cause of the shortfall is not having time at the end where the growth really occurs. It doesn’t matter what the ages are – what matters is the lost time due to delay. Even a little savings early is better than nothing so there is more time for those early savings to compound more. And there is a risk to delay because most people can't work as long as they believe they can. Links within file (please highlight, copy and paste into your browser): volatility drag https://cssanalytics.wordpress.com/2012/03/12/understanding-the-link-between-volatility-and-compound-returns/ stochastic https://en.wikipedia.org/wiki/Stochastic_investment_model deterministic https://en.wikipedia.org/wiki/Deterministic_system more than half ... EBRI Retirement Confidence Survey https://www.ebri.org/surveys/rcs/

Empfohlen
Empfohlen
Weitere ähnliche Inhalte
Mehr von Better Financial Education
Mehr von Better Financial Education (20)
Kürzlich hochgeladen
Kürzlich hochgeladen (20)
The true source and cost of delaying savings
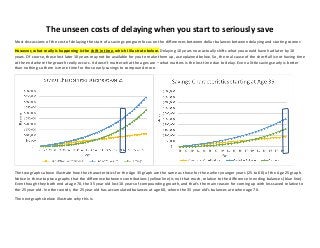
- 1. The unseen costs of delaying when you start to seriously save Most discussions of the cost of delaying the start of a savings program focus on the differences between dollar balances between delaying and starting sooner. However, what really is happening is the shift in time, which I illustrate below. Delaying 10 years now actually shifts what you would have had later by 10 years. Of course, those lost later 10 years may not be available for you to make them up, as explained below. So, the real cause of the shortfall is not having time at the end where the growth really occurs. It doesn’t matter what the ages are – what matters is the lost time due to delay. Even a little savings early is better than nothing so there is more time for those early savings to compound more. The two graphs above illustrate how the characteristics for the Age 35 graph are the same as those for the earlier younger years (25 to 60) of the Age 25 graph. Notice in these top two graphs that the difference between contributions (yellow line) is not that much, relative to the difference in ending balances (blue line). Even though they both end at age 70, the 35 year old lost 10 years of compounding growth, and that’s the main reason for coming up with less saved relative to the 25 year old. In other words, the 25 year old has accumulated balances at age 60, where the 35 year old’s balances are when age 70. The next graphs below illustrate why this is.
- 2. There is a hidden cost to delaying savings. It comes in the form of NOT setting aside money earlier (left graph), and subsequently NOT getting the growth at the END (right graph). These two graphs illustrate how the lack of savings in the first 10 years (not starting until age 35), actually results in losing the 10 years of exponential growth during the last 10 years … because the savings graph has shifted to the right by 10 years. Thus, delayed savings cuts off those 10 years of exponential growth, which comes at the end, not at the beginning! Inputs: Contribution rate of 5% on a salary of $50,000 per year. No increase in contribution rate (that will change on page 3 below). Rate of return 5% (steady rate; note: market rates are far from steady so expecting a rate of return without corresponding volatility is naïve. Here is the relationship expression between arithmetic returns and geometric returns, or volatility drag https://cssanalytics.wordpress.com/2012/03/12/understanding-the-link-between-volatility-and- compound-returns/ ). In other words, actual returns are stochastic and will not be smooth and there’s a needed adjustment to deterministic formulas. How does the 35 year old catch up to the 25 year old – who is 10 years ahead in their savings program? That’s below …
- 3. Compare the last graph “cumulative contributions” (blue line) above, to the first graph on page one. Instead of a constant 5% contribution rate used in the first two pages, I’ll still assume a steady $50,000 salary, (so only one variable is changed) and simply increase the contribution rate by 4% per year (thus, $2,500 contribution increases to $2,600 the following year, then to $2,704 the next year, etc. until reaching $9,862 at age 70 (yellow line). All other variables remained the same. Note too that the cumulative total contributions (yellow line) have doubled in this example (~$200,000 vs. ~$100,000; i.e., compare 2nd graph with 5th graph cumulative contributions), in order to make up for the lost compounded growth at the end. The moral of the story: It is cheaper and more effective to begin saving just a little at an earlier age (the earlier the better). Delaying requires even more of your money to catch up to where you would have been. Of course, a meaningful delay to pay for skill improvement, that leads to a better salary makes sense. However, there’s a point where spending a lot for skill improvement and not getting a great bump up in salary is counterproductive too, especially counterproductive if a great debt load was also added to the mix, which makes it hard to pay off the debt as well as save. Why save? So you don’t have to work your whole life! And most (more than half!) who expect to retire later, are actually forced to retire earlier than expected or planned. And that’s the hidden risk of delay. This means they planned on more time to save but, in reality, were cut short of those working years. They didn’t get those planned years on the right side of the graphs! This means for most people, they end up with less savings than they planned on having simply because they didn’t consider the effect of not being able to work those extra years as planned (plans are just that, plans; reality is a plan cut short). Moral of the moral of the story: You can’t get back years that have gone by. But, you can save more to make up for lost years. Planning on getting those lost years back later, by simply continuing to work, has been found to be fraught with the risk you won’t actually be able to work as long as you plan. $- $50,000 $100,000 $150,000 $200,000 $250,000 $300,000 $350,000 $400,000 $450,000 $500,000 35 37 39 41 43 45 47 49 51 53 55 57 59 61 63 65 67 69 Balance Age Savings Characteristics starting at Age 35 Cumulative Contributions End of Yr Balance Earnings