Southwick Real Estate Market Report January 2013
•
0 gefällt mir•211 views

Real Estate market report for Southwick, MA 01077 by Lesley Lambert of Park Square Realty.

Empfohlen
Weitere ähnliche Inhalte
Andere mochten auch
Andere mochten auch (7)
Ähnlich wie Southwick Real Estate Market Report January 2013
Ähnlich wie Southwick Real Estate Market Report January 2013 (20)
Mehr von Lesley Lambert
Mehr von Lesley Lambert (20)
Kürzlich hochgeladen
Kürzlich hochgeladen (20)
Southwick Real Estate Market Report January 2013
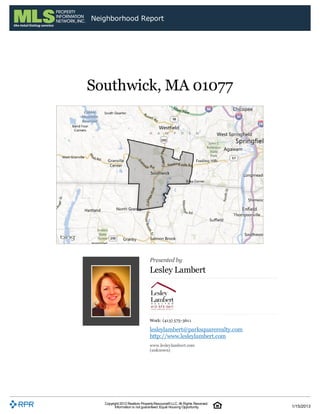
- 1. Neighborhood Report Southwick, MA 01077 Presented by Lesley Lambert Work: (413) 575-3611 lesleylambert@parksquarerealty.com http://www.lesleylambert.com www.lesleylambert.com (unknown) Copyright 2012 Realtors Property Resource® LLC. All Rights Reserved. Information is not guaranteed. Equal Housing Opportunity. 1/15/2013
- 2. Neighborhood Report Listings Neighborhood: Housing Stats and Charts 01077 Southwick Hampden County Massachusetts Median Estimated Home Value $259,000 $259,000 $170,000 $304,880 12-Month Change 5.17% 5.17% –1.16% 2.65% Median List Price 199,900 199,900 165,000 299,000 List Price 1-Month Change 2.64% 2.64% – – List Price 12-Month Change 2.13% 2.13% 3.19% 6.82% Median Home Age 43 43 59 60 Own 81.91% 63.04% 64.02% Rent 18.09% 36.96% 35.98% Vacancy 2.07% 2.86% Median Listing Price vs. Listing Volume This chart compares the listing price and listing volume for homes in an area. Listing prices often follow listing volume, with a time lag, because supply can drive price movements. Data Source: On- and off-market listings sources Update Frequency: Monthly Median List Price Listing Volume Copyright 2012 Realtors Property Resource® LLC. All Rights Reserved. Information is not guaranteed. Equal Housing Opportunity. 1/15/2013
- 3. Neighborhood Report Listings Neighborhood: People Stats and Charts 01077 Southwick Hampden County Massachusetts Population 9,378 – 462,270 6,477,096 Pop Density per Sq Mi 304.27 – 749.05 830.39 Pop Change since 2000 6.04% 1.32% 2.02% Median Age 41 – 38 39 Male / Female Ratio 47.36 / 52.64% –/ 48.03 / 51.97% 48.36 / 51.64% Some High School 4.04% 10.2% 6.45% Ninth Grade 1.57% 6.55% 4.86% High School Graduate 36.54% 32.83% 26.74% 2 Year Degree 27.96% 26.66% 23.65% 4 Year Degree 18.13% 14.93% 21.94% Post Graduate 11.76% 8.82% 16.35% Population of Children by Age Group This chart shows the distribution of the population of children by age range — from birth to 17 — in the area of your search. Data Source: U.S. Census Update Frequency: Annually 01077 Population of Adults by Age Group This chart shows the distribution of the population of adults by age range — from 18 to 75-plus — in the area of your search. Data Source: U.S. Census Update Frequency: Annually 01077 Households With Children This chart shows the distribution of households with children, categorized by marital status, in the area of your search. Data Source: U.S. Census Update Frequency: Annually 01077 Copyright 2012 Realtors Property Resource® LLC. All Rights Reserved. Information is not guaranteed. Equal Housing Opportunity. 1/15/2013
- 4. Neighborhood Report Listings Household Income Brackets This chart shows annual household income levels within an area. Data Source: U.S. Census Update Frequency: Annually 01077 Copyright 2012 Realtors Property Resource® LLC. All Rights Reserved. Information is not guaranteed. Equal Housing Opportunity. 1/15/2013
- 5. Neighborhood Report Listings Neighborhood: Economic Stats and Charts 01077 Southwick Hampden County Massachusetts Income per Capita $32,952 – $24,718 $33,966 Median Hosehold Income $70,905 – $47,724 $64,509 Unemployment Rate 7.7% 6.2% Total Building Permits – – 298 6,223 Building Permits Change –5.4% 15.11% Value of Building Permits – – 58,697,239 1,816,993,000 Value of Building Permits Change –8.44% 16.9% Unemployment Rate This chart shows the unemployment trend in the area of your search. The unemployment rate is an important driver behind the housing market. Data Source: Bureau of Labor Statistics Update Frequency: Monthly Hampden County Massachusetts Renter-Occupied vs. Owner Occupied Households This chart shows the number of rental vacancies in the area of your search. Data Source: USPS Vacancy Quarterly Update Frequency: Annually 01077 Copyright 2012 Realtors Property Resource® LLC. All Rights Reserved. Information is not guaranteed. Equal Housing Opportunity. 1/15/2013
- 6. Neighborhood Report Listings Occupational Categories This chart shows categories of employment within an area. Data Source: U.S. Census Update Frequency: Annually 01077 Copyright 2012 Realtors Property Resource® LLC. All Rights Reserved. Information is not guaranteed. Equal Housing Opportunity. 1/15/2013
- 7. Neighborhood Report Listings Neighborhood: Quality of Life Stats and Charts Quality of Life in 01077 01077 Southwick Hampden County Massachusetts Altitude 422 – 642 – Rainfall 45 – 47.57 45.68 Snowfall 47.67 – 55.02 49.95 Sunny Days 83 – 83 83 Average Travel Time to Work 31 – 22 27 Average Commute Time This chart shows average commute times to work, in minutes, by percentage of an area's population. Data Source: U.S. Census Update Frequency: Annually 01077 How People Get to Work This chart shows the types of transportation that residents of the area you searched use for their commute. Data Source: U.S. Census Update Frequency: Annually Average Monthly Temperature This chart shows average temperatures in the area you searched. Data Source: NOAA Update Frequency: Annually Copyright 2012 Realtors Property Resource® LLC. All Rights Reserved. Information is not guaranteed. Equal Housing Opportunity. 1/15/2013