Expression of cyanobacterial ictB data analysis
•
0 gefällt mir•3 views

1) The document presents data from experiments on transgenic plants expressing the cyanobacterial ictB protein that was omitted from the original published study. 2) Analysis of the full data set shows many transgenic plants performed worse than or similar to wild-type plants, rather than better as reported. 3) At normal atmospheric CO2 concentrations, wild-type plants showed significantly better photosynthesis than transgenic plants, suggesting no agricultural benefit.

Empfohlen
Weitere ähnliche Inhalte
Ähnlich wie Expression of cyanobacterial ictB data analysis
Ähnlich wie Expression of cyanobacterial ictB data analysis (20)
Mehr von Leonid Ledata
Mehr von Leonid Ledata (20)
Kürzlich hochgeladen
Kürzlich hochgeladen (20)
Expression of cyanobacterial ictB data analysis
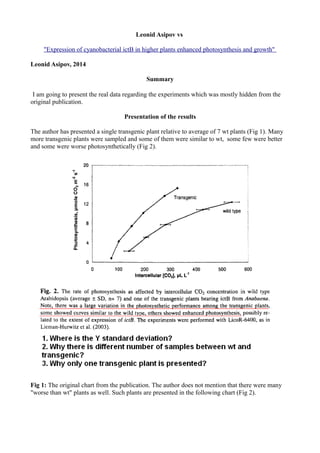
- 1. Leonid Asipov vs "Expression of cyanobacterial ictB in higher plants enhanced photosynthesis and growth" Leonid Asipov, 2014 Summary I am going to present the real data regarding the experiments which was mostly hidden from the original publication. Presentation of the results The author has presented a single transgenic plant relative to average of 7 wt plants (Fig 1). Many more transgenic plants were sampled and some of them were similar to wt, some few were better and some were worse photosynthetically (Fig 2). Fig 1: The original chart from the publication. The author does not mention that there were many "worse than wt" plants as well. Such plants are presented in the following chart (Fig 2).
- 2. Fig 2 : The full data. Ci / Photosynthesis. All the experiments presented. Note that there are many transgenic plants which are photosynthetically worse than wt. Fig 3 : Ci / Photosynthesis averages
- 3. The wt plants are better at all points except the first three (50, 100 and 200 ppm). At 200 ppm, there is no visible difference between wt and transgenic plants. In the first points the differences between wt and transgenic plants are significant but meaningless since the photosynthesis value is very close to or less than 0. In the article, the author has mentioned that transgenic plants were better photosynthetically at limiting but not at saturating CO2 concentration. Since Ci/Photo chart contains transpiration as well (part of the Ci), lets present the External CO2/ Photosynthesis chart, which contains photosynthesis only as function of CO2 concentration in the air. Fig 3 : External CO2 vs Photosynthesis chart. Green series with standard deviation bars is average of 7 wt plants. As we can see, at two first points (50 and 100 ppm) the transgenic plants are better photosynthetically but the photosynthesis value is around 0 or less at these points, suggesting there is no meaning to the results. At 200 ppm, wt and transgenic plants are alike and in the rest of the points, the wt plants are better then transgenic. Let's calculate T statistics test for each point seperately to see if there is statistical significance to the differences.
- 4. Fig 4 : External CO2 vs Photosynthesis at 50 ppm. The photosynthesis is negative, thus the results are meaningless. Fig 5 : External CO2 vs Photosynthesis at 100 ppm. The photosynthesis is nearly zero or less, thus the results are meaningless.
- 5. Fig 5 : External CO2 vs Photosynthesis at 100 ppm. The photosynthesis is nearly zero or less, thus the results are meaningless. Fig 6 : External CO2 vs Photosynthesis at 200 ppm. There is no significant difference between wt and the transgenic
- 6. Fig 7 : External CO2 vs Photosynthesis at 300 ppm. The wt plants are significanty better than transgenic. Fig 8 : External CO2 vs Photosynthesis at 400 ppm. The wt plants are significanty better than transgenic.
- 7. Fig 9 : External CO2 vs Photosynthesis at 600 ppm. The wt plants are significanty better than transgenic. Fig 10 : External CO2 vs Photosynthesis at 800 ppm. The wt plants are significanty better than transgenic. If statistics is applied, the transgenic plants are significantly better photosynthetically at 50 and 100 ppm CO2 only, where photosynthesis is very close or less than 0. In the rest of the points, wt plants are similar (200 ppm) or significantly better(rest of the points. Let's see what was written in the
- 8. original article (Fig 11). Fig 11: The results presnted in the article The maximum "significantly" higher photosynthesis rate of the transgenic plant was about 0.35 umol CO2 m-2 s-1 (Fig 5) which is very low photosynthesis at 100 ppm CO2. The significantly better photosynthesis of the transgenic plants at 50 and 100 ppm is neglectable since the photosynthesis rates are very close to or less than zero. At such photosynthesis levels the plants cannot actually grow. Fig 12 : Conclusion of the article Plants on earth grow at higher CO2 concentrations of around 400 ppm. As we see, at normal earth conditions, wt plants are significantly better than the transgenic (Fig 8) and therefore there is no practical usage of the ictB protein in agriculture. The plants growth experiments The autors results suggest that at lower humidity, transgenic plants grow better than wt. Such results are inconsistent with the gas exchange results, which report significantly better wt photosynthesis at 400 ppm CO2 (Fig 8), the concentration at which the all plants were grown. Since, the photosynthesis of wt plants is higher, the growth is supposed to be as well. All the experiments were conducted at RH of less than 22%, value which is considered according to the article "low humidity". According to the article, at such humidity the transgenic plants grow better. Such declaration is not observed in the gas-exchange experiments.
- 9. Fig 13: RH of the compartment during all the measurements II Generation of plants This part of the experiment was not published or mentioned in the original article. The best transgenic plants were cloned for another generation and sampled similarly to generation I. Following is External CO2 vs Photosynthesis chart of generation II plants. I present the external CO2 and not Ci since the discussion is on photosynthesis properties only. Fig 14 : The wt plants are same or better than the transgenic. Generation II plants.
- 10. The data of generation II was hidden by the author of the original article, Aaron Kaplan. The results suggest that there is no significant difference between the transgenic plants and wt. The wt plants are even slightly better photosynthetically at higher [CO2] points. Conclusions The transgenic protein does not give plants any advantages in normal earth air CO2 concentration (400 ppm, fig 8). The growth results are inconsistent with the gas exchange results, suggesting that the growth experiments are not true. The second generation of plants show no significant difference with wt (data not published in the original article). The author, Aaron Kaplan concluded false conclusions and hidden data. Therefore the original article is scientific fraud. Bibiliography "Expression of cyanobacterial ictB in higher plants enhanced photosynthesis and growth" J. Leiman-Hurwits et al, 2005 is regarded as "original article" Link to all the raw data (LI6400 files) : http://www.ldata.co.il/resources/proteingasexchange2.zip