SlideShare ist ein Scribd-Unternehmen logo
1 von 15
Downloaden Sie, um offline zu lesen
Investigation of Anomalous Thrust from a Partially Loaded
Resonant Cavity
Kurt Zeller*
and Brian Kraft*
California Polytechnic State University, San Luis Obispo, CA, 93408
Updated July 2016
Several experiments in the last decade have demonstrated an anomalous thrust from an
asymmetric electromagnetic resonant cavity. This experiment attempted to demonstrate the
"Electromagnetic (EM) Drive" effect by using a tunable, partially loaded, cylindrical cavity
powered by a microwave oven magnetron outputting 950 W RF. A peak return loss of -39
dB was measured using a vector network analyzer (VNA) connected to both a homemade
magnetron antenna as well as a professionally calibrated antenna. A low thrust
measurement technique was devised using a classical pendulum, laser, and position sensing
detector (PSD) which yielded an axial force resolution of ±5 mN. Full power testing revealed
pendulum deflections that were later proven to be caused purely by thermal effects, most
notably, the thermal expansion of the magnetron leads. Although this experiment did not
prove the validity of the EM Drive, it highlighted many key factors that must be considered
in order to successfully analyze this anomaly.
Nomenclature
EM = Electromagnetic
HDPE = High Density Polyethylene
JSC = Johnson Space Center
NSF = NASA Space Flight Forums
NWPU = Northwestern Polytechnic University
PSD = Position Sensing Device
QVP = Quantum Vacuum Plasma
VNA = Vector Network Analyzer
VSWR = Voltage Standing Wave Ratio
ZPF = Zero Point Field
I. Introduction
An anomaly has been demonstrated at several institutions which utilizes an electromagnetic resonance to achieve
a force without ejecting propellant. In 2014 NASA Johnson Space Center (JSC) Eagleworks demonstrated 0.02
N/kW using 2.6 W RF, however this experiment was performed at atmospheric pressure leading many to believe
convection currents could be responsible.1
Six months later, Paul March released new results indicating 50 μN were
observed at 50 W RF at pressures of 50 μTorr.2
The most recent results from Eagleworks are currently under peer
review and expected to be released in 2016. A 2014 experiment performed at Northwestern Polytechnic University
(NWPU) in Xi'an, Shaanxi, China yielded 1.03 N/kW at a power of 300 W RF, but was later proven to be caused
thermal expansion of the delivery waveguide.3
The 2016 publication by NWPU utilized a self contained test article
and power source resulting in a 3 mN force measured to within 14% accuracy.4
In 2014 an experiment by Guido
Fetta indicated 0.95 N/kW using 10.5 W RF in a pill-box shaped resonant cavity with internal ridges.5
In 2016
Cannae LLC performed further testing of Fetta's invention using a self contained, super cooled test article at vacuum
pressures and claimed successful results. Furthermore, many independent DIY efforts have been presented on the
*
Undergraduate, Aerospace Engineering Department, 1 Grand Ave, San Luis Obispo, CA, 93408
NASA Space Flight Forum (NSF) which have appeared to demonstrate the "EM Drive" effect, however none have
been officially verified. A further analysis of several EM Drive experiments can be found in Appendix A.
This apparent "propellantless" propulsion appears to violate Newton's third law and therefore has been widely
met with controversy and skepticism. Many theoretical explanations for this phenomenon have been put forth but
none have been agreed upon by mainstream physicists. Dr. Harold "Sonny" White from JSC Eagleworks has
postulated that this electromagnetic resonance pushes off quantum vacuum particles that spontaneously appear and
disappear within the resonant cavity, thus conserving momentum.6
This theory requires a mutable and degradable
"natural vacuum" which is not in accordance with current mainstream theories. Professor Mike McCulloch from
Plymouth University has postulated that the inertial mass of the photons inside the cavity caused by Unruh radiation
result in a momentum imbalance, which causes the cavity to move in order to maintain momentum conservation.7
Although the Unruh effect is generally accepted, the existence of Unruh radiation is not universally agreed upon.
Another theory devised by Todd Desiato attempts to describe gravitational fields by a variation in the relative
available "driving power" of the Electromagnetic Zero Point Field (ZPF).8
Using the polarizable vacuum model, Mr.
Desiato postulates that introducing real power in the form of electromagnetic energy can result in a reduced ground
state equilibrium energy density of ordinary matter. Although his theory suggests that the energies required to
accelerate an object are on the order of the mass energy of such an object, he indicates electromagnetic resonance
may provide the amplification necessary to achieving faster-than-light space travel.
II. Apparatus and Procedure
This paper describes an experimental campaign that attempted to examine the "EM Drive" phenomenon from a
new point of view. Instead of the commonly used frustum-shaped resonant cavity, a cylindrical cavity was chosen
and a dielectric insert was used to create an asymmetry. This cavity shape was chosen due to ease of manufacturing
and tunable range. The low-thrust measurement apparatus was designed to fit within an available vacuum chamber,
however later challenges prevented this test from being performed. It was decided that a microwave oven magnetron
would be an appropriate RF source due to their incredibly high power for little cost. Unfortunately the magnetron
drove many future design decisions and ultimately resulted in an inconclusive experiment.
I. Cylindrical Cavity
The first EM Drive patent application published by
Roger Shawyer in 1988 described a cylindrical cavity
partially filled by a cone-shaped dielectric as seen in
Fig. 1.9
Although this indicates that a gradient
asymmetry is required, the investigation of the Cannae
Drive by NASA JSC Eagleworks indicated an
anomalous force present from a symmetric pill-box
shaped resonant cavity with a dielectric PTFE slug.1
First, cylindrical resonant cavity dimensions for the
magnetrons operating frequency were analyzed which
can be found in Appendix B. A preliminary design was
created for the TE011 mode which is shown in
Appendix C. However, due to the volume and mass of
this cavity, a smaller cylinder operating at the TM012
mode was designed which can be seen in Fig. 2, 3 and
4. This design features a conducting rod which
controls an internal movable plate with a removable dielectric disc. The cylindrical cavity has two end adapters
welded around the outside circumference to allow plate attachments for the rod guide, suspension connection, and
magnetron mount. The drawings for all components can be found in Appendix D.
Figure 1. Roger Shawyer 1988 Patent Design. The
triangular region on the left side of the cavity is a two
dimensional representation of the conical dielectric insert.
Figure 2. First Cylindrical Prototype. The adjustment rod seen above is connected to
the movable plate and dielectric and acts as a plunger sliding down the axis of the
cylinder.
Figure 3. Expanded View of the Movable Plate for the Final Cylindrical Design. This
picture shows the interconnections between different components in the movable plate
system.
Figure 4. Expanded View of the Magnetron Input. This initial magnetron mount
was designed without any EM simulation and resulted in an unacceptable return loss.
Preliminary VNA sweeps were performed on the design
seen in Fig. 4 resulting in a minimum return loss of -10 dB.
In order to improve this, the waveguide from the
microwave oven was cut out and bolted to the end of the
cylinder as seen in Fig. 5. Note that this picture does not
include the blue grounding wire used for testing. The
addition of the waveguide dramatically improved the return
loss at the target frequency which will be discussed in
further detail.
Another major change that was made later in the
campaign was a press fit dielectric. Because the Nylon
screws were melting during testing and arcing was
occurring between the movable plate and inside of the
cylinder, a new plate was manufactured to solve both
problems. Seen in Fig. 6, this new movable plate features a
tapered lip that the HDPE could be pressed into. It also has
a copper mesh pinched between the plate mount and
dielectric mount which serves as an electrical connection
inside the cylinder. These design iterations were further
analyzed and discussed in Appendix E.
Figure 6. Final Movable Plate. This plate features a
press fit dielectric to remove the need for dielectric
screws and copper mesh gasket to provide electrical
connection between the plate and the inside of the
cylinder
The frame seen in Fig. 7 was designed to fit inside the Student Vacuum Chamber in the Spacecraft Environments
Laboratory at Cal Poly. Later considerations revealed complications with the magnetron inside the chamber due to
outgassing of steel components. Furthermore, the cavity would need to be tuned at vacuum pressures which was not
possible with the given chamber feed-throughs. L brackets (not pictured) were also used to secure each leg to the
vibrationally isolated optics table.
Figure 5. Final Magnetron Mount. This image
shows the final configuration of the magnetron. The
mica insert fixed in waveguide aperture was
removed to improve return loss.
Figure 7. Pendulum Design. This view shows how the cavity is suspended from the frame in
order to form a classical pendulum.
II. Final Testing Apparatus and Calibration
The final testing apparatus can be seen in Fig. 8. A PSM2-10 PSD was used to convert laser position to voltage
which was amplified by an OT-301 amplifier and displayed using a DSO-X 2002A oscilloscope. The PSD was kept
outside of the microwave absorbing sheet housing to eliminate RF interference. The power leads and grounding wire
were secured to the cylinder using a hose clamp which later became a major area of concern.
Figure 8. Final Experimental Apparatus. This final configuration includes a
grounding wire (blue) pinched between the magnetron housing and the waveguide.
A calibration pulley was used with a thread and weights to induce a known force in the cylinder's axial direction.
This calibration process was plagued by human errors such as air movement and small deviations in weight
dropping technique. Therefore, deflection outliers were removed leaving three calibration tests per weight as seen in
Fig. 9,10 and 11.
Figure 9. 4.9 mN Calibration. This calibration used a 500 mg weight resulting in an average deflection of
0.131 mm
Figure 10. 13.1 mN Calibration. This calibration used a 1.4 g weight resulting in an average deflection
of 0.476 mm
Figure 11. 30.8 mN Calibration. This calibration used a 3.14 g weight resulting in an average deflection
of 3.09 mm
A linear fit was applied to these calibration tests as seen in Fig. 12 to achieve a baseline deflection-to-force
equation. Although this equation could be improved by repeated calibrations it was deemed unnecessary due to the
magnitude of the thermal signature which will be discussed in further detail.
Figure 12. Final Deflection to Force Plot. This graph shows the final result of the
calibration which yielded the following linear fit equation: Deflection =
(.1029)*Force - .3483
III. Magnetron Antenna
In order to find positions of resonance, an antenna was created to mimic the output power distribution of the
magnetron. First, a sacrificial magnetron was torn open to discover the optimal method of connection to the center
tap wire as seen in Fig. 13. This wire connects the inner resonant cavity of the magnetron to the tip of the output
antenna. Next a Galanz M24FB-610A magnetron was carefully cut open so that the tap wire could be detached from
the internal spokes of the resonant cavity such that the length of wire remained the same. Note that this make and
model is identical to that of the testing magnetron. Finally an SMA panel mount was soldered to the tap wire so that
it could be used for VNA testing.
Figure 13. Deconstructed Magnetron Cavity. Here
the inner cavity of the magnetron can be seen, this
section is surrounded by aluminum heat sinks and
neodymium magnets in the intact magnetron (top).
The resulting magnetron antenna can be seen in Fig. 14. This
antenna proved to be cost effective solution for impedance matching a
magnetron with the cylindrical resonant cavity. However the stability
and accuracy were always in question and certain VNA sweeps
indicated that it was unreliable antenna. During several VNA sweeps
the resonance couldn't be found possibly because of a loose connection
within the antenna or a malfunction of the VNA. Luckily, an industry
professional was kind enough to lend us a professionally created and
calibrated antenna seen in Fig. 15. This new antenna reliably confirmed
original resonance locations found with the homemade antenna. One
important note is that this new antenna did not match the original
magnetron's size or shape yet still produced strikingly similar VNA
results as the homemade version. A more in-depth analysis of the
antenna creation process is available in Appendix F.
Figure 15. Magnetron Antennas. The
homemade antenna (above) is much
smaller and less robust than the
professionally calibrated antenna (below).
IV. VNA Testing
VNA sweeps were an integral part of this experiment and were performed before each set of test runs. During the
beginning of the campaign an Anritsu MS4622B network analyzer was used but was located in different building
Figure 14. Homemade Magnetron Antenna.
This antenna consists of the top ceiling of the
magnetron resonant cavity shown in Fig. 15. An
SMA connection was soldered to the central wire
of the magnetron for VNA testing.
than the testing apparatus. Because the test article's resonance was extremely sensitive an N9912A Field Fox RF
Handheld Analyzer was used to perform VNA sweeps while attached to the testing apparatus by the end of the
testing campaign. Further details regarding VNA sweep results for HDPE as well as other dielectrics can be found in
Appendix G.
As previously mentioned, initial resonance testing using the antenna mounted on a flat end plate revealed that a
waveguide delivery mechanism would be necessary. This was achieved by cutting out the delivery waveguide used
on the Hamilton Beach Microwave Oven which originally housed the Galanz magnetron. This resulted in a
dramatically improved return loss as can be seen in Fig. 16.
Figure 16. S11 Plot for a Partially Loaded Cylinder with 1 inch HDPE
Disc. The minimum return loss is less than 3 MHz away from the center output
frequency of the magnetron.
One of the biggest challenges in this experiment was creating a high quality resonant cavity that didn't reject all
energy back to the magnetron. Because microwave oven manufacturers are relatively unconcerned with the output
bandwidth, they typically create a magnetron to have a center frequency of 2.45 GHz and bandwidth of 60 MHz.
Fig. 17 from JSC Eagleworks shows how random the magnetron spectrum can appear.
Figure 17. Eagleworks Magnetron Spectrum. This image
and notes describe how the magnetron spectrum can
dramatically change from cycle to cycle.
A resonant cavity that accepts the entire bandwidth of the magnetron as done by Tajmar et al. will do little to
amplify the energy.10
This amplification factor is known as "quality" and is proportional to the energy stored per
cycle divided by the energy dissipated. Current super cooled resonant cavities used in particle accelerators have
reached qualities on the order of 1010
while room temperature aluminum cavities can sometimes approach 105
.
Nearly all EM Drive theories predict that the "thrust" will scale with quality factor, however a higher quality factor
means more energy will be rejected back to the source if improperly matched. Because of the uncontrollable nature
of a microwave oven magnetron this cavity was intended to have a relatively wide bandwidth to accept the majority
of the energy from the magnetron and prevent it from overheating. Unfortunately this choice may have prevented
this EM Drive from demonstrating any force. If this experiment were to be repeated, a wideband high power
circulator would be used such that all energy would either be delivered to the cavity or dumped into a matched load
as done by Yang et al.3
V. EM Pro Verification
One resonance using a 1 inch thick HDPE disc with Nylon screws was further analyzed in EM Pro to compare
the validity of computer simulations to actual experimental results. Fig. 19 shows the S11 output from EM Pro
which matches exceedingly well to the S11 plot obtained using the VNA seen in Fig. 18. The slight difference in
central frequency can be attributed to the differences in excitation. In order to model the system in EM Pro, a 1 W
modal power feed plane wave excitation was created at an input port identical to the opening of the microwave oven
waveguide as seen in Fig. 20.
Figure 18. S11 Plot for a Partially Loaded Resonator with HDPE. Point 1 denotes the central frequency of the
magnetron while point 2 and point 3 are the lower and upper limits of the bandwidth of the signal. Note that there is
a -3 dB offset of the plot.
Figure 19. Simulated S11 Chart for a Partially Loaded Resonator with HDPE. This plot can be compared to the
experimental results in Fig. 20.
Figure 20. Plane Wave Excitation used to Simulate the Magnetron Source. The color bar in this picture is used
to depict the strength of the electric field at the input to the cavity.
In Fig. 21 and 22 we can see the electric and magnetic field lines with their corresponding magnitudes and
directions. Notice that the strength of the electric field is about three orders of magnitude larger than the strength of
the magnetic field. This is partially due to an excitation of a transverse magnetic mode which orients the electric
field in the axial direction. Upon further inspection it can be seen that both fields are compressed within the
dielectric due to the high dielectric constant. This is a key feature of the asymmetric resonance that appears to be
paramount to the success of an EM Drive.
Figure 21. Simulated Electric Fields for a Partially Loaded Resonator with HDPE Inserts. The transparent red
sections display the outer walls of the cavity while the orange cylinders depict the screws used to fasten the
dielectric. Colored arrows are used to display the magnitude and direction of the electric fields, higher values
appear red or yellow while weaker values appear green or blue.
Figure 22. Simulated Magnetic Fields for a Partially Loaded Resonator with HDPE Inserts. The transparent
red sections display the outer walls of the cavity while the orange cylinders depict the screws used to fasten the
dielectric. Colored arrows are used to display the magnitude and direction of the Magnetic fields, higher values
appear red or yellow while weaker values appear green or blue.
VI. Results
Countless tests were performed which resulted in varying degrees of deflection. However, one trend that
persisted is that of the thermal signature. Seen here in Fig. 23, the deflection plot clearly has a sharp rise when the
magnetron was turned on and a slow decay after it turned off. Note that the major deflection occurs in the transverse
direction, meaning that the cylinder was spinning clockwise if looking from above. The axial deflection indicates
that the pendulum swung in the direction of the dielectric which is the direction predicted by other EM Drive
experiments.
After many tests it was determined that the power leads connecting the magnetron were the primary source of the
deflection. When the hose clamp securing the leads to the cylinder was removed, the deflections either ceased to
occur or were dramatically mitigated and sometimes reversed. It was concluded that the thermal expansion of the 16
gauge wires caused the pendulum to move when the magnetron was turned on and allowed it to slowly settle back to
equilibrium as they cooled down.
Figure 23. Final Results. These plots indicate that the cylinder rotated clockwise if looking from
above and moved slightly in the direction of the dielectric. It was later determined that all deflections
were caused by thermal expansion of the power leads.
VII. Conclusion
Although this experiment did not succeed in proving the existence of an anomalous force from an asymmetric
resonant cavity, it did highlight several important aspects one must consider when performing such an experiment.
While no theory has shown that a cylindrical EM Drive would be unable to produce thrust, it is entirely possible that
the effect could have been reduced due to the size of the asymmetry used. Near the end of the campaign a spherical
ended frustum was designed and analyzed in EM Pro which is further discussed in Appendix I. The use of the
microwave oven magnetron was a key area of concern because of its naturally noisy signal. While some have argued
that phase and amplitude modulation may be the key to the anomalous force, the magnetron's wide bandwidth is not
well suited to a high quality resonant cavity. The main issue with this experiment and possibly other EM Drive
experiments is that the power source was not isolated on board the low-thrust measurement apparatus. In order to
prove the validity of the EM Drive one must isolate the entire system to ensure that the act of delivering power does
not cause a thrust signature.
Appendix
A. Investigation and Analysis of Anomalous Thrust Experiments
B. Cylindrical Resonant Solutions vs Magnetron Frequency
C. Preliminary Prototype Design
D. First Prototype Engineering Drawings, Pictures, and Improvements
E. Flaws in the Resonant Cylinder and the Associated Design Iterations
F. Magnetron Deconstruction and Antenna Adaptation
G. Vector Network Analyzer Testing
H. Frustum Design Campaign
I. Engineering Drawings of Spherical Ended Frustum
J. Future of the EM Drive at Cal Poly
Acknowledgements
We would like to thank our advisor, Dr. Robert Echols, for his unyielding support and guidance throughout this
entire campaign. We would also like to thank Mr. John Gerling from Gerling Applied Engineering Inc. who lent his
magnetron antenna and wisdom from decades of RF engineering experience. Finally I would like to thank all of the
participants on the NASA Space Forum for their advice and their contributions to the EM Drive effort.
Refrences
1
Brady, D. A, White H. G, March P., Lawrence J.T., and Davies F. J., "Anomalous Thrust Production from an
RF Test Device Measured on a Low-Thrust Torsion Pendulum", NASA Lyndon B. Johnson Space Center, Houston,
Texas 77058, July 2014.
2
Wang, Brian (6 February 2015). "Update on EMDrive work at NASA Eagleworks". NextBigFuture.
3
Juan Y., Yu-Quan W., Yan-Jie M., Peng-Fei L., Le Y., Yang W., and Guo-Qiang H., "Prediction and
Experimental Measurement of the Electromagnetic Thrust Generated by a Microwave Thruster System", College of
Astronautics, Northwestern Polytechnic University, Xi’an 710072, China, Dec 2012.
4
Yang, Juan; Liu, Xian-chuang; Wang, Yu-quan; Tang, Ming-jie; Luo, Li-tao; Jin, Yi-zhou; Ning, Zhong-xi
(February 2016). "Thrust Measurement of an Independent Microwave Thruster Propulsion Device with Three-Wire
Torsion Pendulum Thrust Measurement System". Journal of Propulsion Technology (in Chinese) 37 (2): 362–371.
5
Fetta G., "Numerical and Experimental Results for a Novel Propulsion Technology Requiring no On-Board
Propellant", Cannae LLC., Doylestown PA, 18901, July 2014.
6
Harold "Sonny" White (2013). "Eagleworks Laboratories WARP FIELD PHYSICS" (PDF). NASA Technical
Reports Server (NTRS). NASA.
7
M.E. McCulloch (2015), "Testing quantised inertia on the emdrive" (PDF), EPL111 (6), arXiv:1604.03449,
Bibcode:2015EL....11160005M, doi:10.1209/0295-5075/111/60005
8
Desiato, Todd J. "THE ELECTROMAGNETIC QUANTUM VACUUM WARP DRIVE."JBIS 68 (2015): 347-
53.
9
Shawyer, Roger. 'Electrical Propulsion Unit For Spacecraft'. 1988
10
Tajmar, M., Fiedler, G., "Direct Thrust Measurements of an EM Drive and an Evaluation of Possible Side-
Effects", Institute of Aerospace Engineering, Technische Universität Dresden, 01062 Dresden, Germany.

Weitere ähnliche Inhalte

Was ist angesagt?

Statistical Quality Control, Lower Tier Suppliers, Automotive Components
Statistical Quality Control, Lower Tier Suppliers, Automotive ComponentsStatistical Quality Control, Lower Tier Suppliers, Automotive Components
Statistical Quality Control, Lower Tier Suppliers, Automotive ComponentsAM Publications
 
Presentation on energy iter2017 january
Presentation on energy iter2017 januaryPresentation on energy iter2017 january
Presentation on energy iter2017 januaryCooper Lackay
 
F. Magnetron Deconstruction and Antenna Adaptation
F. Magnetron Deconstruction and Antenna AdaptationF. Magnetron Deconstruction and Antenna Adaptation
F. Magnetron Deconstruction and Antenna AdaptationKurt Zeller
 
Горбунов Н.А.
Горбунов Н.А.Горбунов Н.А.
Горбунов Н.А.ThinTech
 
Fusion Energy: When might it become economically feasible?
Fusion Energy: When might it become economically feasible?Fusion Energy: When might it become economically feasible?
Fusion Energy: When might it become economically feasible?Jeffrey Funk
 
auger electron spectroscopy (AES)
auger electron spectroscopy  (AES)auger electron spectroscopy  (AES)
auger electron spectroscopy (AES)Kamal Asadi Pakdel
 
A study of transient characteristics of an actual wind turbine grounding syst...
A study of transient characteristics of an actual wind turbine grounding syst...A study of transient characteristics of an actual wind turbine grounding syst...
A study of transient characteristics of an actual wind turbine grounding syst...duncans50
 
Advanced solarandlaserconcepts
Advanced solarandlaserconceptsAdvanced solarandlaserconcepts
Advanced solarandlaserconceptsClifford Stone
 
Giant magnetoresistance and their applications
Giant magnetoresistance and their applicationsGiant magnetoresistance and their applications
Giant magnetoresistance and their applicationsPremashis Kumar
 
Quick DFT tour of Electron Energy Loss Spectrum (EELS)
Quick DFT tour of Electron Energy Loss  Spectrum (EELS)Quick DFT tour of Electron Energy Loss  Spectrum (EELS)
Quick DFT tour of Electron Energy Loss Spectrum (EELS)Shruba Gangopadhyay Ph.D.
 
Application of electroceramics
Application of electroceramicsApplication of electroceramics
Application of electroceramicsSudhir Kumar
 
Argon and He-Cd Laser
Argon and He-Cd Laser Argon and He-Cd Laser
Argon and He-Cd Laser ayesha zaheer
 
SRIM Calculations Applied to Ionization Chambers Tyler Bailey
SRIM Calculations Applied to Ionization Chambers Tyler BaileySRIM Calculations Applied to Ionization Chambers Tyler Bailey
SRIM Calculations Applied to Ionization Chambers Tyler BaileyTyler Bailey
 
Electron energy loss spectroscopy
Electron energy loss spectroscopyElectron energy loss spectroscopy
Electron energy loss spectroscopyGulfam Hussain
 
Energy loss and energy straggling a presentation by Younes Sina
Energy loss and energy straggling a presentation by Younes SinaEnergy loss and energy straggling a presentation by Younes Sina
Energy loss and energy straggling a presentation by Younes SinaYounes Sina
 
Wireless electricity transmission
Wireless electricity transmissionWireless electricity transmission
Wireless electricity transmissionGOURAV KUMAR
 

Was ist angesagt? (20)

Statistical Quality Control, Lower Tier Suppliers, Automotive Components
Statistical Quality Control, Lower Tier Suppliers, Automotive ComponentsStatistical Quality Control, Lower Tier Suppliers, Automotive Components
Statistical Quality Control, Lower Tier Suppliers, Automotive Components
 
Implantation srim trim
Implantation  srim trimImplantation  srim trim
Implantation srim trim
 
Presentation on energy iter2017 january
Presentation on energy iter2017 januaryPresentation on energy iter2017 january
Presentation on energy iter2017 january
 
F. Magnetron Deconstruction and Antenna Adaptation
F. Magnetron Deconstruction and Antenna AdaptationF. Magnetron Deconstruction and Antenna Adaptation
F. Magnetron Deconstruction and Antenna Adaptation
 
Горбунов Н.А.
Горбунов Н.А.Горбунов Н.А.
Горбунов Н.А.
 
Fusion Energy: When might it become economically feasible?
Fusion Energy: When might it become economically feasible?Fusion Energy: When might it become economically feasible?
Fusion Energy: When might it become economically feasible?
 
Giant magnetoresistance
Giant magnetoresistanceGiant magnetoresistance
Giant magnetoresistance
 
auger electron spectroscopy (AES)
auger electron spectroscopy  (AES)auger electron spectroscopy  (AES)
auger electron spectroscopy (AES)
 
A study of transient characteristics of an actual wind turbine grounding syst...
A study of transient characteristics of an actual wind turbine grounding syst...A study of transient characteristics of an actual wind turbine grounding syst...
A study of transient characteristics of an actual wind turbine grounding syst...
 
Advanced solarandlaserconcepts
Advanced solarandlaserconceptsAdvanced solarandlaserconcepts
Advanced solarandlaserconcepts
 
Giant magnetoresistance and their applications
Giant magnetoresistance and their applicationsGiant magnetoresistance and their applications
Giant magnetoresistance and their applications
 
Quick DFT tour of Electron Energy Loss Spectrum (EELS)
Quick DFT tour of Electron Energy Loss  Spectrum (EELS)Quick DFT tour of Electron Energy Loss  Spectrum (EELS)
Quick DFT tour of Electron Energy Loss Spectrum (EELS)
 
Witricity
WitricityWitricity
Witricity
 
Application of electroceramics
Application of electroceramicsApplication of electroceramics
Application of electroceramics
 
Argon and He-Cd Laser
Argon and He-Cd Laser Argon and He-Cd Laser
Argon and He-Cd Laser
 
SRIM Calculations Applied to Ionization Chambers Tyler Bailey
SRIM Calculations Applied to Ionization Chambers Tyler BaileySRIM Calculations Applied to Ionization Chambers Tyler Bailey
SRIM Calculations Applied to Ionization Chambers Tyler Bailey
 
Electron energy loss spectroscopy
Electron energy loss spectroscopyElectron energy loss spectroscopy
Electron energy loss spectroscopy
 
Energy loss and energy straggling a presentation by Younes Sina
Energy loss and energy straggling a presentation by Younes SinaEnergy loss and energy straggling a presentation by Younes Sina
Energy loss and energy straggling a presentation by Younes Sina
 
CEMS and Mössbauer Sprectroscopy
CEMS and Mössbauer SprectroscopyCEMS and Mössbauer Sprectroscopy
CEMS and Mössbauer Sprectroscopy
 
Wireless electricity transmission
Wireless electricity transmissionWireless electricity transmission
Wireless electricity transmission
 

Ähnlich wie Investigation of a Partially Loaded Resonant Cavity_Zeller_Kraft

Topic Achievement Final Report - Revised
Topic Achievement Final Report - RevisedTopic Achievement Final Report - Revised
Topic Achievement Final Report - RevisedCody Peng
 
Report_Paulo_Melo_LabI
Report_Paulo_Melo_LabIReport_Paulo_Melo_LabI
Report_Paulo_Melo_LabIPaulo Melo
 
Nuclear micro battery
Nuclear micro batteryNuclear micro battery
Nuclear micro batteryVishnu M T
 
Design, Construction and Implementation of a Bradbury-Nielsen Gate for Time-o...
Design, Construction and Implementation of a Bradbury-Nielsen Gate for Time-o...Design, Construction and Implementation of a Bradbury-Nielsen Gate for Time-o...
Design, Construction and Implementation of a Bradbury-Nielsen Gate for Time-o...David Torre
 
AE 499 Special Topics_Jared_Cokley
AE 499 Special Topics_Jared_CokleyAE 499 Special Topics_Jared_Cokley
AE 499 Special Topics_Jared_CokleyJared Cokley
 
COUPLED FIELD ANALYSIS OF PIEZOELECTRIC CANTILEVER BEAM
COUPLED FIELD ANALYSIS OF PIEZOELECTRIC CANTILEVER BEAMCOUPLED FIELD ANALYSIS OF PIEZOELECTRIC CANTILEVER BEAM
COUPLED FIELD ANALYSIS OF PIEZOELECTRIC CANTILEVER BEAMijiert bestjournal
 
A Study on Liquid Dielectric Breakdown in Micro-EDM Discharge - Cognitio paper
A Study on Liquid Dielectric Breakdown in  Micro-EDM Discharge - Cognitio paperA Study on Liquid Dielectric Breakdown in  Micro-EDM Discharge - Cognitio paper
A Study on Liquid Dielectric Breakdown in Micro-EDM Discharge - Cognitio paperSantosh Verma
 
The Effects of Nano Fillers on Space Charge Distribution in Cross-Linked Poly...
The Effects of Nano Fillers on Space Charge Distribution in Cross-Linked Poly...The Effects of Nano Fillers on Space Charge Distribution in Cross-Linked Poly...
The Effects of Nano Fillers on Space Charge Distribution in Cross-Linked Poly...IJECEIAES
 
SIMULATION OF THE SOLAR CELLS WITH PC1D, APPLICATION TO CELLS BASED ON SILICON
SIMULATION OF THE SOLAR CELLS WITH PC1D, APPLICATION TO CELLS BASED ON SILICONSIMULATION OF THE SOLAR CELLS WITH PC1D, APPLICATION TO CELLS BASED ON SILICON
SIMULATION OF THE SOLAR CELLS WITH PC1D, APPLICATION TO CELLS BASED ON SILICONAEIJjournal2
 
A circuit for measurement of high voltage corona
A circuit for measurement of high voltage coronaA circuit for measurement of high voltage corona
A circuit for measurement of high voltage coronaaswanthmrajeev112
 
Partially filled electrode for DMF devices
Partially filled electrode for DMF devicesPartially filled electrode for DMF devices
Partially filled electrode for DMF devicesWaleed Salman
 
Design Optimization of Linear Generator for a Hydrokinetic Energy Converter
Design Optimization of Linear Generator for a Hydrokinetic Energy ConverterDesign Optimization of Linear Generator for a Hydrokinetic Energy Converter
Design Optimization of Linear Generator for a Hydrokinetic Energy ConverterIOSR Journals
 
4.2.cappelli 06(3)
4.2.cappelli 06(3)4.2.cappelli 06(3)
4.2.cappelli 06(3)ELIMENG
 
4.2.cappelli 06(2)
4.2.cappelli 06(2)4.2.cappelli 06(2)
4.2.cappelli 06(2)ELIMENG
 
4.2.cappelli 06(1)
4.2.cappelli 06(1)4.2.cappelli 06(1)
4.2.cappelli 06(1)ELIMENG
 
4.2.cappelli 06
4.2.cappelli 064.2.cappelli 06
4.2.cappelli 06ELIMENG
 
Piezoelectric Photothermal Spectroscopy (PPT)_V4
Piezoelectric Photothermal Spectroscopy (PPT)_V4Piezoelectric Photothermal Spectroscopy (PPT)_V4
Piezoelectric Photothermal Spectroscopy (PPT)_V4Nadal Sarkytbayev
 

Ähnlich wie Investigation of a Partially Loaded Resonant Cavity_Zeller_Kraft (20)

Topic Achievement Final Report - Revised
Topic Achievement Final Report - RevisedTopic Achievement Final Report - Revised
Topic Achievement Final Report - Revised
 
Report_Paulo_Melo_LabI
Report_Paulo_Melo_LabIReport_Paulo_Melo_LabI
Report_Paulo_Melo_LabI
 
Nuclear micro battery
Nuclear micro batteryNuclear micro battery
Nuclear micro battery
 
Design, Construction and Implementation of a Bradbury-Nielsen Gate for Time-o...
Design, Construction and Implementation of a Bradbury-Nielsen Gate for Time-o...Design, Construction and Implementation of a Bradbury-Nielsen Gate for Time-o...
Design, Construction and Implementation of a Bradbury-Nielsen Gate for Time-o...
 
AE 499 Special Topics_Jared_Cokley
AE 499 Special Topics_Jared_CokleyAE 499 Special Topics_Jared_Cokley
AE 499 Special Topics_Jared_Cokley
 
COUPLED FIELD ANALYSIS OF PIEZOELECTRIC CANTILEVER BEAM
COUPLED FIELD ANALYSIS OF PIEZOELECTRIC CANTILEVER BEAMCOUPLED FIELD ANALYSIS OF PIEZOELECTRIC CANTILEVER BEAM
COUPLED FIELD ANALYSIS OF PIEZOELECTRIC CANTILEVER BEAM
 
A Study on Liquid Dielectric Breakdown in Micro-EDM Discharge - Cognitio paper
A Study on Liquid Dielectric Breakdown in  Micro-EDM Discharge - Cognitio paperA Study on Liquid Dielectric Breakdown in  Micro-EDM Discharge - Cognitio paper
A Study on Liquid Dielectric Breakdown in Micro-EDM Discharge - Cognitio paper
 
Thesis
ThesisThesis
Thesis
 
The Effects of Nano Fillers on Space Charge Distribution in Cross-Linked Poly...
The Effects of Nano Fillers on Space Charge Distribution in Cross-Linked Poly...The Effects of Nano Fillers on Space Charge Distribution in Cross-Linked Poly...
The Effects of Nano Fillers on Space Charge Distribution in Cross-Linked Poly...
 
SIMULATION OF THE SOLAR CELLS WITH PC1D, APPLICATION TO CELLS BASED ON SILICON
SIMULATION OF THE SOLAR CELLS WITH PC1D, APPLICATION TO CELLS BASED ON SILICONSIMULATION OF THE SOLAR CELLS WITH PC1D, APPLICATION TO CELLS BASED ON SILICON
SIMULATION OF THE SOLAR CELLS WITH PC1D, APPLICATION TO CELLS BASED ON SILICON
 
Kaytlin Brinker Presentation
Kaytlin Brinker PresentationKaytlin Brinker Presentation
Kaytlin Brinker Presentation
 
A circuit for measurement of high voltage corona
A circuit for measurement of high voltage coronaA circuit for measurement of high voltage corona
A circuit for measurement of high voltage corona
 
Partially filled electrode for DMF devices
Partially filled electrode for DMF devicesPartially filled electrode for DMF devices
Partially filled electrode for DMF devices
 
Comsol2009 Paper
Comsol2009 PaperComsol2009 Paper
Comsol2009 Paper
 
Design Optimization of Linear Generator for a Hydrokinetic Energy Converter
Design Optimization of Linear Generator for a Hydrokinetic Energy ConverterDesign Optimization of Linear Generator for a Hydrokinetic Energy Converter
Design Optimization of Linear Generator for a Hydrokinetic Energy Converter
 
4.2.cappelli 06(3)
4.2.cappelli 06(3)4.2.cappelli 06(3)
4.2.cappelli 06(3)
 
4.2.cappelli 06(2)
4.2.cappelli 06(2)4.2.cappelli 06(2)
4.2.cappelli 06(2)
 
4.2.cappelli 06(1)
4.2.cappelli 06(1)4.2.cappelli 06(1)
4.2.cappelli 06(1)
 
4.2.cappelli 06
4.2.cappelli 064.2.cappelli 06
4.2.cappelli 06
 
Piezoelectric Photothermal Spectroscopy (PPT)_V4
Piezoelectric Photothermal Spectroscopy (PPT)_V4Piezoelectric Photothermal Spectroscopy (PPT)_V4
Piezoelectric Photothermal Spectroscopy (PPT)_V4
 

Mehr von Kurt Zeller

Zeller_resume_7_10
Zeller_resume_7_10Zeller_resume_7_10
Zeller_resume_7_10Kurt Zeller
 
ANGELS Communications by Kurt Zeller
ANGELS Communications by Kurt ZellerANGELS Communications by Kurt Zeller
ANGELS Communications by Kurt ZellerKurt Zeller
 
J. Future of the EM Drive at Cal Poly
J. Future of the EM Drive at Cal PolyJ. Future of the EM Drive at Cal Poly
J. Future of the EM Drive at Cal PolyKurt Zeller
 
I. Engineering Drawings of Spherical Ended Frustum.PDF
I. Engineering Drawings of Spherical Ended Frustum.PDFI. Engineering Drawings of Spherical Ended Frustum.PDF
I. Engineering Drawings of Spherical Ended Frustum.PDFKurt Zeller
 
G. Vector Network Analyzer Testing
G. Vector Network Analyzer TestingG. Vector Network Analyzer Testing
G. Vector Network Analyzer TestingKurt Zeller
 
E. Flaws in the Resonant Cylinder and the Associated Design Iterations
E. Flaws in the Resonant Cylinder and the Associated Design IterationsE. Flaws in the Resonant Cylinder and the Associated Design Iterations
E. Flaws in the Resonant Cylinder and the Associated Design IterationsKurt Zeller
 
D. First Prototype Engineering Drawings, Pictures, and Improvements
D. First Prototype Engineering Drawings, Pictures, and ImprovementsD. First Prototype Engineering Drawings, Pictures, and Improvements
D. First Prototype Engineering Drawings, Pictures, and ImprovementsKurt Zeller
 
C. Preliminary Prototype Design
C. Preliminary Prototype DesignC. Preliminary Prototype Design
C. Preliminary Prototype DesignKurt Zeller
 
B. Cylindrical Resonant Solutions vs Magnetron Frequency
B. Cylindrical Resonant Solutions vs Magnetron FrequencyB. Cylindrical Resonant Solutions vs Magnetron Frequency
B. Cylindrical Resonant Solutions vs Magnetron FrequencyKurt Zeller
 

Mehr von Kurt Zeller (9)

Zeller_resume_7_10
Zeller_resume_7_10Zeller_resume_7_10
Zeller_resume_7_10
 
ANGELS Communications by Kurt Zeller
ANGELS Communications by Kurt ZellerANGELS Communications by Kurt Zeller
ANGELS Communications by Kurt Zeller
 
J. Future of the EM Drive at Cal Poly
J. Future of the EM Drive at Cal PolyJ. Future of the EM Drive at Cal Poly
J. Future of the EM Drive at Cal Poly
 
I. Engineering Drawings of Spherical Ended Frustum.PDF
I. Engineering Drawings of Spherical Ended Frustum.PDFI. Engineering Drawings of Spherical Ended Frustum.PDF
I. Engineering Drawings of Spherical Ended Frustum.PDF
 
G. Vector Network Analyzer Testing
G. Vector Network Analyzer TestingG. Vector Network Analyzer Testing
G. Vector Network Analyzer Testing
 
E. Flaws in the Resonant Cylinder and the Associated Design Iterations
E. Flaws in the Resonant Cylinder and the Associated Design IterationsE. Flaws in the Resonant Cylinder and the Associated Design Iterations
E. Flaws in the Resonant Cylinder and the Associated Design Iterations
 
D. First Prototype Engineering Drawings, Pictures, and Improvements
D. First Prototype Engineering Drawings, Pictures, and ImprovementsD. First Prototype Engineering Drawings, Pictures, and Improvements
D. First Prototype Engineering Drawings, Pictures, and Improvements
 
C. Preliminary Prototype Design
C. Preliminary Prototype DesignC. Preliminary Prototype Design
C. Preliminary Prototype Design
 
B. Cylindrical Resonant Solutions vs Magnetron Frequency
B. Cylindrical Resonant Solutions vs Magnetron FrequencyB. Cylindrical Resonant Solutions vs Magnetron Frequency
B. Cylindrical Resonant Solutions vs Magnetron Frequency
 

Investigation of a Partially Loaded Resonant Cavity_Zeller_Kraft

  • 1. Investigation of Anomalous Thrust from a Partially Loaded Resonant Cavity Kurt Zeller* and Brian Kraft* California Polytechnic State University, San Luis Obispo, CA, 93408 Updated July 2016 Several experiments in the last decade have demonstrated an anomalous thrust from an asymmetric electromagnetic resonant cavity. This experiment attempted to demonstrate the "Electromagnetic (EM) Drive" effect by using a tunable, partially loaded, cylindrical cavity powered by a microwave oven magnetron outputting 950 W RF. A peak return loss of -39 dB was measured using a vector network analyzer (VNA) connected to both a homemade magnetron antenna as well as a professionally calibrated antenna. A low thrust measurement technique was devised using a classical pendulum, laser, and position sensing detector (PSD) which yielded an axial force resolution of ±5 mN. Full power testing revealed pendulum deflections that were later proven to be caused purely by thermal effects, most notably, the thermal expansion of the magnetron leads. Although this experiment did not prove the validity of the EM Drive, it highlighted many key factors that must be considered in order to successfully analyze this anomaly. Nomenclature EM = Electromagnetic HDPE = High Density Polyethylene JSC = Johnson Space Center NSF = NASA Space Flight Forums NWPU = Northwestern Polytechnic University PSD = Position Sensing Device QVP = Quantum Vacuum Plasma VNA = Vector Network Analyzer VSWR = Voltage Standing Wave Ratio ZPF = Zero Point Field I. Introduction An anomaly has been demonstrated at several institutions which utilizes an electromagnetic resonance to achieve a force without ejecting propellant. In 2014 NASA Johnson Space Center (JSC) Eagleworks demonstrated 0.02 N/kW using 2.6 W RF, however this experiment was performed at atmospheric pressure leading many to believe convection currents could be responsible.1 Six months later, Paul March released new results indicating 50 μN were observed at 50 W RF at pressures of 50 μTorr.2 The most recent results from Eagleworks are currently under peer review and expected to be released in 2016. A 2014 experiment performed at Northwestern Polytechnic University (NWPU) in Xi'an, Shaanxi, China yielded 1.03 N/kW at a power of 300 W RF, but was later proven to be caused thermal expansion of the delivery waveguide.3 The 2016 publication by NWPU utilized a self contained test article and power source resulting in a 3 mN force measured to within 14% accuracy.4 In 2014 an experiment by Guido Fetta indicated 0.95 N/kW using 10.5 W RF in a pill-box shaped resonant cavity with internal ridges.5 In 2016 Cannae LLC performed further testing of Fetta's invention using a self contained, super cooled test article at vacuum pressures and claimed successful results. Furthermore, many independent DIY efforts have been presented on the * Undergraduate, Aerospace Engineering Department, 1 Grand Ave, San Luis Obispo, CA, 93408
  • 2. NASA Space Flight Forum (NSF) which have appeared to demonstrate the "EM Drive" effect, however none have been officially verified. A further analysis of several EM Drive experiments can be found in Appendix A. This apparent "propellantless" propulsion appears to violate Newton's third law and therefore has been widely met with controversy and skepticism. Many theoretical explanations for this phenomenon have been put forth but none have been agreed upon by mainstream physicists. Dr. Harold "Sonny" White from JSC Eagleworks has postulated that this electromagnetic resonance pushes off quantum vacuum particles that spontaneously appear and disappear within the resonant cavity, thus conserving momentum.6 This theory requires a mutable and degradable "natural vacuum" which is not in accordance with current mainstream theories. Professor Mike McCulloch from Plymouth University has postulated that the inertial mass of the photons inside the cavity caused by Unruh radiation result in a momentum imbalance, which causes the cavity to move in order to maintain momentum conservation.7 Although the Unruh effect is generally accepted, the existence of Unruh radiation is not universally agreed upon. Another theory devised by Todd Desiato attempts to describe gravitational fields by a variation in the relative available "driving power" of the Electromagnetic Zero Point Field (ZPF).8 Using the polarizable vacuum model, Mr. Desiato postulates that introducing real power in the form of electromagnetic energy can result in a reduced ground state equilibrium energy density of ordinary matter. Although his theory suggests that the energies required to accelerate an object are on the order of the mass energy of such an object, he indicates electromagnetic resonance may provide the amplification necessary to achieving faster-than-light space travel. II. Apparatus and Procedure This paper describes an experimental campaign that attempted to examine the "EM Drive" phenomenon from a new point of view. Instead of the commonly used frustum-shaped resonant cavity, a cylindrical cavity was chosen and a dielectric insert was used to create an asymmetry. This cavity shape was chosen due to ease of manufacturing and tunable range. The low-thrust measurement apparatus was designed to fit within an available vacuum chamber, however later challenges prevented this test from being performed. It was decided that a microwave oven magnetron would be an appropriate RF source due to their incredibly high power for little cost. Unfortunately the magnetron drove many future design decisions and ultimately resulted in an inconclusive experiment. I. Cylindrical Cavity The first EM Drive patent application published by Roger Shawyer in 1988 described a cylindrical cavity partially filled by a cone-shaped dielectric as seen in Fig. 1.9 Although this indicates that a gradient asymmetry is required, the investigation of the Cannae Drive by NASA JSC Eagleworks indicated an anomalous force present from a symmetric pill-box shaped resonant cavity with a dielectric PTFE slug.1 First, cylindrical resonant cavity dimensions for the magnetrons operating frequency were analyzed which can be found in Appendix B. A preliminary design was created for the TE011 mode which is shown in Appendix C. However, due to the volume and mass of this cavity, a smaller cylinder operating at the TM012 mode was designed which can be seen in Fig. 2, 3 and 4. This design features a conducting rod which controls an internal movable plate with a removable dielectric disc. The cylindrical cavity has two end adapters welded around the outside circumference to allow plate attachments for the rod guide, suspension connection, and magnetron mount. The drawings for all components can be found in Appendix D. Figure 1. Roger Shawyer 1988 Patent Design. The triangular region on the left side of the cavity is a two dimensional representation of the conical dielectric insert.
  • 3. Figure 2. First Cylindrical Prototype. The adjustment rod seen above is connected to the movable plate and dielectric and acts as a plunger sliding down the axis of the cylinder. Figure 3. Expanded View of the Movable Plate for the Final Cylindrical Design. This picture shows the interconnections between different components in the movable plate system. Figure 4. Expanded View of the Magnetron Input. This initial magnetron mount was designed without any EM simulation and resulted in an unacceptable return loss.
  • 4. Preliminary VNA sweeps were performed on the design seen in Fig. 4 resulting in a minimum return loss of -10 dB. In order to improve this, the waveguide from the microwave oven was cut out and bolted to the end of the cylinder as seen in Fig. 5. Note that this picture does not include the blue grounding wire used for testing. The addition of the waveguide dramatically improved the return loss at the target frequency which will be discussed in further detail. Another major change that was made later in the campaign was a press fit dielectric. Because the Nylon screws were melting during testing and arcing was occurring between the movable plate and inside of the cylinder, a new plate was manufactured to solve both problems. Seen in Fig. 6, this new movable plate features a tapered lip that the HDPE could be pressed into. It also has a copper mesh pinched between the plate mount and dielectric mount which serves as an electrical connection inside the cylinder. These design iterations were further analyzed and discussed in Appendix E. Figure 6. Final Movable Plate. This plate features a press fit dielectric to remove the need for dielectric screws and copper mesh gasket to provide electrical connection between the plate and the inside of the cylinder The frame seen in Fig. 7 was designed to fit inside the Student Vacuum Chamber in the Spacecraft Environments Laboratory at Cal Poly. Later considerations revealed complications with the magnetron inside the chamber due to outgassing of steel components. Furthermore, the cavity would need to be tuned at vacuum pressures which was not possible with the given chamber feed-throughs. L brackets (not pictured) were also used to secure each leg to the vibrationally isolated optics table. Figure 5. Final Magnetron Mount. This image shows the final configuration of the magnetron. The mica insert fixed in waveguide aperture was removed to improve return loss.
  • 5. Figure 7. Pendulum Design. This view shows how the cavity is suspended from the frame in order to form a classical pendulum. II. Final Testing Apparatus and Calibration The final testing apparatus can be seen in Fig. 8. A PSM2-10 PSD was used to convert laser position to voltage which was amplified by an OT-301 amplifier and displayed using a DSO-X 2002A oscilloscope. The PSD was kept outside of the microwave absorbing sheet housing to eliminate RF interference. The power leads and grounding wire were secured to the cylinder using a hose clamp which later became a major area of concern. Figure 8. Final Experimental Apparatus. This final configuration includes a grounding wire (blue) pinched between the magnetron housing and the waveguide. A calibration pulley was used with a thread and weights to induce a known force in the cylinder's axial direction. This calibration process was plagued by human errors such as air movement and small deviations in weight dropping technique. Therefore, deflection outliers were removed leaving three calibration tests per weight as seen in Fig. 9,10 and 11.
  • 6. Figure 9. 4.9 mN Calibration. This calibration used a 500 mg weight resulting in an average deflection of 0.131 mm Figure 10. 13.1 mN Calibration. This calibration used a 1.4 g weight resulting in an average deflection of 0.476 mm
  • 7. Figure 11. 30.8 mN Calibration. This calibration used a 3.14 g weight resulting in an average deflection of 3.09 mm A linear fit was applied to these calibration tests as seen in Fig. 12 to achieve a baseline deflection-to-force equation. Although this equation could be improved by repeated calibrations it was deemed unnecessary due to the magnitude of the thermal signature which will be discussed in further detail. Figure 12. Final Deflection to Force Plot. This graph shows the final result of the calibration which yielded the following linear fit equation: Deflection = (.1029)*Force - .3483 III. Magnetron Antenna In order to find positions of resonance, an antenna was created to mimic the output power distribution of the magnetron. First, a sacrificial magnetron was torn open to discover the optimal method of connection to the center
  • 8. tap wire as seen in Fig. 13. This wire connects the inner resonant cavity of the magnetron to the tip of the output antenna. Next a Galanz M24FB-610A magnetron was carefully cut open so that the tap wire could be detached from the internal spokes of the resonant cavity such that the length of wire remained the same. Note that this make and model is identical to that of the testing magnetron. Finally an SMA panel mount was soldered to the tap wire so that it could be used for VNA testing. Figure 13. Deconstructed Magnetron Cavity. Here the inner cavity of the magnetron can be seen, this section is surrounded by aluminum heat sinks and neodymium magnets in the intact magnetron (top). The resulting magnetron antenna can be seen in Fig. 14. This antenna proved to be cost effective solution for impedance matching a magnetron with the cylindrical resonant cavity. However the stability and accuracy were always in question and certain VNA sweeps indicated that it was unreliable antenna. During several VNA sweeps the resonance couldn't be found possibly because of a loose connection within the antenna or a malfunction of the VNA. Luckily, an industry professional was kind enough to lend us a professionally created and calibrated antenna seen in Fig. 15. This new antenna reliably confirmed original resonance locations found with the homemade antenna. One important note is that this new antenna did not match the original magnetron's size or shape yet still produced strikingly similar VNA results as the homemade version. A more in-depth analysis of the antenna creation process is available in Appendix F. Figure 15. Magnetron Antennas. The homemade antenna (above) is much smaller and less robust than the professionally calibrated antenna (below). IV. VNA Testing VNA sweeps were an integral part of this experiment and were performed before each set of test runs. During the beginning of the campaign an Anritsu MS4622B network analyzer was used but was located in different building Figure 14. Homemade Magnetron Antenna. This antenna consists of the top ceiling of the magnetron resonant cavity shown in Fig. 15. An SMA connection was soldered to the central wire of the magnetron for VNA testing.
  • 9. than the testing apparatus. Because the test article's resonance was extremely sensitive an N9912A Field Fox RF Handheld Analyzer was used to perform VNA sweeps while attached to the testing apparatus by the end of the testing campaign. Further details regarding VNA sweep results for HDPE as well as other dielectrics can be found in Appendix G. As previously mentioned, initial resonance testing using the antenna mounted on a flat end plate revealed that a waveguide delivery mechanism would be necessary. This was achieved by cutting out the delivery waveguide used on the Hamilton Beach Microwave Oven which originally housed the Galanz magnetron. This resulted in a dramatically improved return loss as can be seen in Fig. 16. Figure 16. S11 Plot for a Partially Loaded Cylinder with 1 inch HDPE Disc. The minimum return loss is less than 3 MHz away from the center output frequency of the magnetron. One of the biggest challenges in this experiment was creating a high quality resonant cavity that didn't reject all energy back to the magnetron. Because microwave oven manufacturers are relatively unconcerned with the output bandwidth, they typically create a magnetron to have a center frequency of 2.45 GHz and bandwidth of 60 MHz. Fig. 17 from JSC Eagleworks shows how random the magnetron spectrum can appear.
  • 10. Figure 17. Eagleworks Magnetron Spectrum. This image and notes describe how the magnetron spectrum can dramatically change from cycle to cycle. A resonant cavity that accepts the entire bandwidth of the magnetron as done by Tajmar et al. will do little to amplify the energy.10 This amplification factor is known as "quality" and is proportional to the energy stored per cycle divided by the energy dissipated. Current super cooled resonant cavities used in particle accelerators have reached qualities on the order of 1010 while room temperature aluminum cavities can sometimes approach 105 . Nearly all EM Drive theories predict that the "thrust" will scale with quality factor, however a higher quality factor means more energy will be rejected back to the source if improperly matched. Because of the uncontrollable nature of a microwave oven magnetron this cavity was intended to have a relatively wide bandwidth to accept the majority of the energy from the magnetron and prevent it from overheating. Unfortunately this choice may have prevented this EM Drive from demonstrating any force. If this experiment were to be repeated, a wideband high power circulator would be used such that all energy would either be delivered to the cavity or dumped into a matched load as done by Yang et al.3 V. EM Pro Verification One resonance using a 1 inch thick HDPE disc with Nylon screws was further analyzed in EM Pro to compare the validity of computer simulations to actual experimental results. Fig. 19 shows the S11 output from EM Pro which matches exceedingly well to the S11 plot obtained using the VNA seen in Fig. 18. The slight difference in central frequency can be attributed to the differences in excitation. In order to model the system in EM Pro, a 1 W modal power feed plane wave excitation was created at an input port identical to the opening of the microwave oven waveguide as seen in Fig. 20.
  • 11. Figure 18. S11 Plot for a Partially Loaded Resonator with HDPE. Point 1 denotes the central frequency of the magnetron while point 2 and point 3 are the lower and upper limits of the bandwidth of the signal. Note that there is a -3 dB offset of the plot. Figure 19. Simulated S11 Chart for a Partially Loaded Resonator with HDPE. This plot can be compared to the experimental results in Fig. 20.
  • 12. Figure 20. Plane Wave Excitation used to Simulate the Magnetron Source. The color bar in this picture is used to depict the strength of the electric field at the input to the cavity. In Fig. 21 and 22 we can see the electric and magnetic field lines with their corresponding magnitudes and directions. Notice that the strength of the electric field is about three orders of magnitude larger than the strength of the magnetic field. This is partially due to an excitation of a transverse magnetic mode which orients the electric field in the axial direction. Upon further inspection it can be seen that both fields are compressed within the dielectric due to the high dielectric constant. This is a key feature of the asymmetric resonance that appears to be paramount to the success of an EM Drive. Figure 21. Simulated Electric Fields for a Partially Loaded Resonator with HDPE Inserts. The transparent red sections display the outer walls of the cavity while the orange cylinders depict the screws used to fasten the dielectric. Colored arrows are used to display the magnitude and direction of the electric fields, higher values appear red or yellow while weaker values appear green or blue.
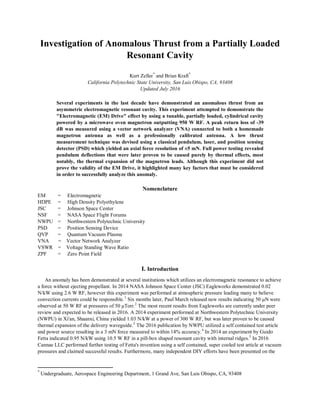
  • 13. Figure 22. Simulated Magnetic Fields for a Partially Loaded Resonator with HDPE Inserts. The transparent red sections display the outer walls of the cavity while the orange cylinders depict the screws used to fasten the dielectric. Colored arrows are used to display the magnitude and direction of the Magnetic fields, higher values appear red or yellow while weaker values appear green or blue. VI. Results Countless tests were performed which resulted in varying degrees of deflection. However, one trend that persisted is that of the thermal signature. Seen here in Fig. 23, the deflection plot clearly has a sharp rise when the magnetron was turned on and a slow decay after it turned off. Note that the major deflection occurs in the transverse direction, meaning that the cylinder was spinning clockwise if looking from above. The axial deflection indicates that the pendulum swung in the direction of the dielectric which is the direction predicted by other EM Drive experiments. After many tests it was determined that the power leads connecting the magnetron were the primary source of the deflection. When the hose clamp securing the leads to the cylinder was removed, the deflections either ceased to occur or were dramatically mitigated and sometimes reversed. It was concluded that the thermal expansion of the 16 gauge wires caused the pendulum to move when the magnetron was turned on and allowed it to slowly settle back to equilibrium as they cooled down.
  • 14. Figure 23. Final Results. These plots indicate that the cylinder rotated clockwise if looking from above and moved slightly in the direction of the dielectric. It was later determined that all deflections were caused by thermal expansion of the power leads. VII. Conclusion Although this experiment did not succeed in proving the existence of an anomalous force from an asymmetric resonant cavity, it did highlight several important aspects one must consider when performing such an experiment. While no theory has shown that a cylindrical EM Drive would be unable to produce thrust, it is entirely possible that the effect could have been reduced due to the size of the asymmetry used. Near the end of the campaign a spherical ended frustum was designed and analyzed in EM Pro which is further discussed in Appendix I. The use of the microwave oven magnetron was a key area of concern because of its naturally noisy signal. While some have argued that phase and amplitude modulation may be the key to the anomalous force, the magnetron's wide bandwidth is not well suited to a high quality resonant cavity. The main issue with this experiment and possibly other EM Drive experiments is that the power source was not isolated on board the low-thrust measurement apparatus. In order to prove the validity of the EM Drive one must isolate the entire system to ensure that the act of delivering power does not cause a thrust signature. Appendix A. Investigation and Analysis of Anomalous Thrust Experiments B. Cylindrical Resonant Solutions vs Magnetron Frequency C. Preliminary Prototype Design D. First Prototype Engineering Drawings, Pictures, and Improvements E. Flaws in the Resonant Cylinder and the Associated Design Iterations F. Magnetron Deconstruction and Antenna Adaptation G. Vector Network Analyzer Testing H. Frustum Design Campaign
  • 15. I. Engineering Drawings of Spherical Ended Frustum J. Future of the EM Drive at Cal Poly Acknowledgements We would like to thank our advisor, Dr. Robert Echols, for his unyielding support and guidance throughout this entire campaign. We would also like to thank Mr. John Gerling from Gerling Applied Engineering Inc. who lent his magnetron antenna and wisdom from decades of RF engineering experience. Finally I would like to thank all of the participants on the NASA Space Forum for their advice and their contributions to the EM Drive effort. Refrences 1 Brady, D. A, White H. G, March P., Lawrence J.T., and Davies F. J., "Anomalous Thrust Production from an RF Test Device Measured on a Low-Thrust Torsion Pendulum", NASA Lyndon B. Johnson Space Center, Houston, Texas 77058, July 2014. 2 Wang, Brian (6 February 2015). "Update on EMDrive work at NASA Eagleworks". NextBigFuture. 3 Juan Y., Yu-Quan W., Yan-Jie M., Peng-Fei L., Le Y., Yang W., and Guo-Qiang H., "Prediction and Experimental Measurement of the Electromagnetic Thrust Generated by a Microwave Thruster System", College of Astronautics, Northwestern Polytechnic University, Xi’an 710072, China, Dec 2012. 4 Yang, Juan; Liu, Xian-chuang; Wang, Yu-quan; Tang, Ming-jie; Luo, Li-tao; Jin, Yi-zhou; Ning, Zhong-xi (February 2016). "Thrust Measurement of an Independent Microwave Thruster Propulsion Device with Three-Wire Torsion Pendulum Thrust Measurement System". Journal of Propulsion Technology (in Chinese) 37 (2): 362–371. 5 Fetta G., "Numerical and Experimental Results for a Novel Propulsion Technology Requiring no On-Board Propellant", Cannae LLC., Doylestown PA, 18901, July 2014. 6 Harold "Sonny" White (2013). "Eagleworks Laboratories WARP FIELD PHYSICS" (PDF). NASA Technical Reports Server (NTRS). NASA. 7 M.E. McCulloch (2015), "Testing quantised inertia on the emdrive" (PDF), EPL111 (6), arXiv:1604.03449, Bibcode:2015EL....11160005M, doi:10.1209/0295-5075/111/60005 8 Desiato, Todd J. "THE ELECTROMAGNETIC QUANTUM VACUUM WARP DRIVE."JBIS 68 (2015): 347- 53. 9 Shawyer, Roger. 'Electrical Propulsion Unit For Spacecraft'. 1988 10 Tajmar, M., Fiedler, G., "Direct Thrust Measurements of an EM Drive and an Evaluation of Possible Side- Effects", Institute of Aerospace Engineering, Technische Universität Dresden, 01062 Dresden, Germany.