SlideShare ist ein Scribd-Unternehmen logo
1 von 1
Nutrient Profiles, Palatability, and Intake of Various Blood Sources Fed toNutrient Profiles, Palatability, and Intake of Various Blood Sources Fed to
Vampire BatsVampire Bats
Kiley M. AlgyaKiley M. Algya11
, Sarah L. Burke, Sarah L. Burke22
, Cheryl L. Morris, Cheryl L. Morris22
11
Papillion – LaVista High School, Papillion, Nebraska, USA,Papillion – LaVista High School, Papillion, Nebraska, USA, 22
Henry Doorly Zoo, Omaha Nebraska, USAHenry Doorly Zoo, Omaha Nebraska, USA
IntroductionIntroduction
Vampire Bats have been stereotyped centuries ago. People have been scared and frightened about these
misunderstood creatures, especially when it came to their diet. The Common Vampire Bat’s, Desmodus rotundus, diet is
blood taken from other mammals. Vampire Bats, in the wild, usually inject their two incisors into a larger animal and
consume that animal’s blood by lapping rather than sucking. They have an anticoagulant in their saliva that prevents blood
clots while feeding. Vampire Bats will drink about 40 millimeters (8 teaspoons) of blood a night, which corresponds to about
132% of its body weight (Richarz, 1993). However, captive vampire bats, like the ones at the Henry Doorly Zoo, digest blood
that came from local meat packing facilities. When blood is processed, the amount of dangerous bacteria is may be high as
a result of mishandling. Chaverri (2006) identified thirty different bacteria species in the stomach and intestines of wild
vampire bats. In theory, this may affect the young juvenile vampire bat’s life span. Unfortunately, there isn’t much existing
data regarding to the microbial profiles, preferences, and the nutrition of blood to captive vampire bats.
In order to determine if the captive bats would consume blood processed differently, we fed twelve common vampire
bats blood that was either Freeze-Dried, after being collected from live cattle, frozen after being collected from live cattle or
blood that was collected from slaughtered cattle from local meat packing facility. These blood treatments were all compared
and contrasted between nutrient profiles, palatability, and their intake among the vampire bats. All three blood treatments
were analyzed on dry matter, organic matter, protein and energy at Henry Doorly Zoo nutrition lab. The microbial plates
and minerals were all analyzed from the local Midwest Laboratory.
ObjectivesObjectives
• Determine the nutrient profiles
of the blood treatments
•Determine the Palatability and
intake of the blood treatments
•Determine the bacteria amount
of the blood treatments
Methods and MaterialsMethods and Materials
This study was done at the Henry Doorly Zoo in the nutrition laboratory analyzing data for three different blood treatments. The Vampire Bats were cared for, monitored and
fed by the Henry Doorly Zoo Jungle keeper staff with the supervision of the principal investigator.
• The study was a complete block design consisting of a six 5-day blocks for a total of 30 days
• Two diets were fed out randomly among four ice trays. (One type of blood treatment was in two ice trays, while the other blood treatment was in the other two ice trays)
• The amount of blood fed daily, was split into half. Half of the blood would be fed in the morning, and the other half would be fed in the afternoon.
• The ice trays were rotated and randomized so that the diets weren’t fed in the same location
• There was an evaporation tray that determined any evaporative loss based on light, temperature, and humidity of the exhibit.
Intake of blood from each tray was determined and recorded by accurate weighing of blood offered and refused daily
• The Dry Matter percentage for all of the blood treatments were achieved by the Freeze-Dried percentage 19.4%
• Crucible contained wet samples that were placed into the muffle furnace at 500°C for 24 hours. The organic matter was combusted so that the ash could be weighed back.
• Organic Material’s percentage in the sample could be calculated after the ashing procedure.
• The LECO FP-528 was a machine that determined the percentage of nitrogen in a sample.
• The percentage of protein was calculated by multiplying the percentage of nitrogen by a factor of 6.25.
• Data was entered in a statistical software program called SAS (SAS Institute) in which the data was analyzed using the GLM (General Linear Models) procedure of SAS (SAS
Institute).
• Microbial plating and minerals were all analyzed at the Midwest laboratory located in Omaha, NE.
Table 1. Nutrient Profile and Mineral AnalysisTable 1. Nutrient Profile and Mineral Analysis
ConsumptionConsumption StdStd P-valueP-value
A.MA.M 21.3 16.3 < .0001
P.MP.M 36.1 14.8 < .0001
Time ConsumptionTime Consumption
PeriodPeriod
11
PeriodPeriod
22
PeriodPeriod
33
PeriodPeriod
44
PeriodPeriod
55
PeriodPeriod
66
Avg.Avg.
P-valueP-value
Min.Min.
P-valueP-value
MaxMax
P-valueP-value
230.00 238.40 223.20 214.00 210.40 171.20 0.83988 0.1204
2 v. 6
1.0000
4 v. 5
Total Mean (g) ConsumptionTotal Mean (g) Consumption
per Periodper Period
Table 2. Microbial Plating AnalysisTable 2. Microbial Plating Analysis
This data table shows the average blood
consumed per period, the average p-value, the
minimum p-value, and the maximum p-value
when comparing all possible period combinations.
The average p-value was 0.8399. the minimum
p-value was 0.01204, which was associated with
the period 2 vs. 6 combination. Although
numerically the consumption was lower during
period 6 compared with period 2, this difference
did not reach statistical significance of having a p-
value less than 0.05. Based on the statistics,
I conclude that the bats did consume similar
amounts of blood during each of the treatments
regardless of the blood offered to them.
Future ResearchFuture Research
Since Trial 1 and Trial 2 on microbial plating was preformed, there will be future monitoring onSince Trial 1 and Trial 2 on microbial plating was preformed, there will be future monitoring on
the microbial plating. The future analyzing of the microbial plating will be similar with the processthe microbial plating. The future analyzing of the microbial plating will be similar with the process
of Trial 2. Another future research area would be looking at the digestibility of the bloods. In aof Trial 2. Another future research area would be looking at the digestibility of the bloods. In a
digestibility the study one would analyze the nutrients in the feces and compare them to thedigestibility the study one would analyze the nutrients in the feces and compare them to the
nutrients in the diets. The difference between the fecal amounts and diet amounts would be thenutrients in the diets. The difference between the fecal amounts and diet amounts would be the
digestibility amounts and would determine the amount of proteins and other minerals that thedigestibility amounts and would determine the amount of proteins and other minerals that the
vampire bats absorbed in their body. Each blood treatment would be fed out individually insteadvampire bats absorbed in their body. Each blood treatment would be fed out individually instead
of two blood treatments at a time. Hopefully these studies will help us reach our goal of finding aof two blood treatments at a time. Hopefully these studies will help us reach our goal of finding a
diet that promotes longevity.diet that promotes longevity.
ConclusionConclusion
Based on my results, the bats consumed significantly more blood in the afternoonBased on my results, the bats consumed significantly more blood in the afternoon
compared to the morning. There was no preference among the three blood treatments.compared to the morning. There was no preference among the three blood treatments.
Additionally, the blood treatment nutrient profiles appeared similar to one another. Prior toAdditionally, the blood treatment nutrient profiles appeared similar to one another. Prior to
the start of the study, a sample of the blood offered had very high microbial plate counts.the start of the study, a sample of the blood offered had very high microbial plate counts.
However, that batch was ignored because the blood was considered bad. There was aHowever, that batch was ignored because the blood was considered bad. There was a
new analysis on the new blood obtained the day the cattle were slaughtered, and thenew analysis on the new blood obtained the day the cattle were slaughtered, and the
microbial plate counts were lower and within health ranges. Although the blood ismicrobial plate counts were lower and within health ranges. Although the blood is
refrigerated, it is typically stored from 7 – 10 days. It is believed that the longer the bloodrefrigerated, it is typically stored from 7 – 10 days. It is believed that the longer the blood
is stored, the more microbes would be produced, resulting in the higher plate countsis stored, the more microbes would be produced, resulting in the higher plate counts
observed originally. In the month of March, there was a microbial plating trial analysisobserved originally. In the month of March, there was a microbial plating trial analysis
preformed. In this trial the results concluded that every three days, the microbial countpreformed. In this trial the results concluded that every three days, the microbial count
had increased drastically. The microbial counting will monitored for further results.had increased drastically. The microbial counting will monitored for further results.
Table 1 presents nutrient profiles and the mineral concentrations of theTable 1 presents nutrient profiles and the mineral concentrations of the
three blood treatments. There was six different current blood samples, twothree blood treatments. There was six different current blood samples, two
fresh blood samples, and two freeze – dried samples during this study. Thefresh blood samples, and two freeze – dried samples during this study. The
nutrient profiles that were analyzed were dry matter, organic matter,nutrient profiles that were analyzed were dry matter, organic matter,
proteins, and energies. Numerically my results conclude that the nutrientproteins, and energies. Numerically my results conclude that the nutrient
profiles were similar between the blood treatments. The minerals that wereprofiles were similar between the blood treatments. The minerals that were
analyzed in this study were: Sulfur, Phosphorus, Potassium, Magnesium,analyzed in this study were: Sulfur, Phosphorus, Potassium, Magnesium,
Calcium, Sodium, Iron, Manganese, Copper, and Zinc. Numerically, allCalcium, Sodium, Iron, Manganese, Copper, and Zinc. Numerically, all
these minerals are similar throughout the samples.these minerals are similar throughout the samples.
Table 2 shows the microbial plating analysis for the blood treatmentTable 2 shows the microbial plating analysis for the blood treatment
samples. There was, again, six samples of current blood, two samples ofsamples. There was, again, six samples of current blood, two samples of
fresh blood, and two samples of freeze-dried blood. Table 2 shows the firstfresh blood, and two samples of freeze-dried blood. Table 2 shows the first
trial of microbial plating done on the blood treatments. The bacteria thattrial of microbial plating done on the blood treatments. The bacteria that
was analyzed in this study were: Aerobic plate count, E. coli, Mold Count,was analyzed in this study were: Aerobic plate count, E. coli, Mold Count,
Salmonella, Staphylococcus, Total Coli Forms, and Yeast. The AerobicSalmonella, Staphylococcus, Total Coli Forms, and Yeast. The Aerobic
Plate count is different numerically, however, the other five bacteria's werePlate count is different numerically, however, the other five bacteria's were
similar between the blood treatments.similar between the blood treatments.
This table presents that there was aThis table presents that there was a
difference between the morningdifference between the morning
consumption and afternoon consumptionconsumption and afternoon consumption
of blood treatments among the vampireof blood treatments among the vampire
bats. Obviously, the afternoon had morebats. Obviously, the afternoon had more
consumption then the morning likely forconsumption then the morning likely for
two reasons. The afternoon ice trays weretwo reasons. The afternoon ice trays were
left out longer than the morning ice trays.left out longer than the morning ice trays.
In other words, the afternoon ice traysIn other words, the afternoon ice trays
were left out from the afternoon until thewere left out from the afternoon until the
next morning. Another reason why thenext morning. Another reason why the
afternoon consumption number wasafternoon consumption number was
greater than the morning was likelygreater than the morning was likely
because vampire bats are nocturnal;because vampire bats are nocturnal;
therefore they were more active during thetherefore they were more active during the
night.night.
Based upon the p-values, we areBased upon the p-values, we are
99.99% confident that there is a difference99.99% confident that there is a difference
in intake due to time.in intake due to time.
Before my study, there wasn’t much knowledge or research
about the nutritional value of blood fed to Desmodus rotundus and
microbial profiles. My results have shown that captive vampire bats do
not have a preference between the blood treatments: Current Blood,
Frozen Blood, and Freeze – Dried Blood. This is beneficial because zoos
all over the world can now have the chance to house vampire bats in their
domain. There aren’t many zoos that can house vampire bats because
theythey don’t have a meat packing facility near them. Frozen Blood and
Freeze – Dried Blood are more beneficial then the Current Blood for a
variety of reasons. Freeze Dried and Frozen Blood both have the same
nutritional value as the Current Blood.
ImpactImpact
ResultsResults
SampleSample CB 1CB 1
(Block 1(Block 1
& 2)& 2)
CB 2CB 2
(Block 1(Block 1
& 2)& 2)
CB 3CB 3
(Block 3(Block 3
& 4)& 4)
CB 4CB 4
(Block 3(Block 3
& 4)& 4)
CB 5CB 5
(Block 5(Block 5
& 6)& 6)
CB 6CB 6
(Block 3(Block 3
& 6)& 6)
FB 1FB 1 FB 2FB 2 FDB 1FDB 1 FDB 2FDB 2
% DM (105° C)% DM (105° C) 19.84 19.75 19.15 19.04 20.02 20.08 22.58 18.28 19.4 19.4
% OM (DMB)% OM (DMB) 94.54 94.62 93.74 93.98
% CP (DMB)% CP (DMB) 79.95 89.15 92.65 93.11 90.39 94.73 93.35 92.49 93.35 95.21
Gross EnergyGross Energy
(cal/g) (DMB)(cal/g) (DMB)
6,045.88 5,868.38 5,772.58 5,223.07 6,257.24 6,264.33 5,560.9 5,522.68 5,556.29 5,456.53
Sulfur (%)Sulfur (%)
(DMB)(DMB)
0.77 0.77 0.62 0.72 0.72 0.72 0.72 0.72 0.71 0.76
PhosphorusPhosphorus
(%) (DMB)(%) (DMB)
0.1 0.1 0.05 0.1 0.1 0.1 0.1 0.1 0.11 0.11
Potassium (%)Potassium (%)
(DMB)(DMB)
0.31 0.25 0.31 0.31 0.21 0.21 0.31 0.31 0.3 0.27
Magnesium (%)Magnesium (%)
(DMB)(DMB)
<1 <0.01 <0.01 <0.01 <0.01 <0.01 <0.01 <0.01 0.013 0.027
Calcium (%)Calcium (%)
(DMB)(DMB)
0.26 0.05 <0.01 <0.01 <0.01 <0.01 0.05 <0.01 0.04 0.07
Sodium (%)Sodium (%)
(DMB)(DMB)
1.8 1.75 1.75 1.86 1.6 1.65 1.8 1.65 1.42 1.41
Iron (ppm)Iron (ppm)
(DMB(DMB
2,423 2,392 2,046 2,155 2,474 2,562 2,495 2,170 2,388 2101
ManganeseManganese
(ppm) (DMB)(ppm) (DMB)
<10 <1 <1 <1 <1 <1 5 <1 <1 7
Copper (ppm)Copper (ppm)
(DMB)(DMB)
5 5 5 5 5 5 10 10 5 13
Zinc (ppm)Zinc (ppm)
(DMB)(DMB)
15 10 10 15 15 15 21 15 18 20
SampleSample FreshFresh
BloodBlood
Day 1Day 1
FeederFeeder
BloodBlood
Day 3Day 3
FeederFeeder
BloodBlood
Day 6Day 6
FeederFeeder
BloodBlood
Day 9Day 9
FeederFeeder
BloodBlood
Day 12Day 12
Not FedNot Fed
BloodBlood
Day 3Day 3
Not FedNot Fed
BloodBlood
Day 6Day 6
Not FedNot Fed
BloodBlood
Day 9Day 9
Not FedNot Fed
BloodBlood
Day 12Day 12
Aerobic plateAerobic plate
count (cfu/g)count (cfu/g)
(DMB)(DMB)
1,340 2,423 1,288,660 1,030,928 4,278,351 773 618,557 139,175,258 515,464
SalmonellaSalmonella
(org/25g) (DMB)(org/25g) (DMB)
negative negative negative negative negative negative negative negative negative
StaphylococcusStaphylococcus
aureus (cfu/g)aureus (cfu/g)
(DMB)(DMB)
<10 <10 <10 <10 <10 <10 <10 <10 <10
Total coliformsTotal coliforms
(cfu/g) (DMB)(cfu/g) (DMB)
<10 <10 <10 <10 <10 <10 <10 <10 <10
SampleSample CB 1CB 1
(Block(Block
1 & 2)1 & 2)
CB 2CB 2
(Block(Block
1 & 2)1 & 2)
CB 3CB 3
(Block(Block
4 & 5)4 & 5)
CB 4CB 4
(Block(Block
4 & 5)4 & 5)
CB 5CB 5
(Block(Block
7 & 8)7 & 8)
CB 6CB 6
(Block(Block
7& 8)7& 8)
FB 1FB 1 FB 2FB 2 FDB 1FDB 1 FDB 2FDB 2
Aerobic plateAerobic plate
count (cfu/g)count (cfu/g)
(DMB)(DMB)
463.9 360.8 103.1 <10 619 928 928 206 180 3,000
E. coli (cfu/g)E. coli (cfu/g)
(DMB)(DMB)
<10 <10 <10 <10 <10 <10 <10 <10 <10 <10
Mold CountMold Count
(cfu/g) (DMB)(cfu/g) (DMB)
<10 <10 <10 <10 <10 <10 <10 <10 190 6,800
SalmonellaSalmonella
(org/25g) (DMB)(org/25g) (DMB)
negative negative negative negative negative negative negative negative negative negative
StaphylococcusStaphylococcus
aureus (cfu/g)aureus (cfu/g)
(DMB)(DMB)
<10 <10 <10 <10 <10 <10 <10 <10 <10 420
Total coliformsTotal coliforms
(cfu/g) (DMB)(cfu/g) (DMB)
<10 <10 <10 <10 <10 <10 <10 <10 <10 <10
Yeast (cfu/g)Yeast (cfu/g)
(DMB)(DMB)
<10 <10 <10 <10 <10 <10 <10 <10 <10 <10
Table 3. Microbial Plating Trial AnalysisTable 3. Microbial Plating Trial Analysis
Table 3 shows the results of Trial 2 on microbial plating. Since the highTable 3 shows the results of Trial 2 on microbial plating. Since the high
microbial plating was an issue with the original blood sample (Trial 1), amicrobial plating was an issue with the original blood sample (Trial 1), a
second study was conducted to monitor the bacteria counts over time (Trialsecond study was conducted to monitor the bacteria counts over time (Trial
2). One jug was fed to the vampire bats (Feeder Blood), while another jug2). One jug was fed to the vampire bats (Feeder Blood), while another jug
was never opened (Not Fed Blood). Microbial plating was analyzed on bothwas never opened (Not Fed Blood). Microbial plating was analyzed on both
blood jugs every third day while it was stored. In the Aerobic Plate Countblood jugs every third day while it was stored. In the Aerobic Plate Count
there is a 68.1% difference between the Feeder Blood and the Not Fedthere is a 68.1% difference between the Feeder Blood and the Not Fed
Blood on Day 3. Between the Feeder Blood, and Not Fed Blood on Day 6,Blood on Day 3. Between the Feeder Blood, and Not Fed Blood on Day 6,
there is a 95.2% difference. On Day 9 the difference between the blood isthere is a 95.2% difference. On Day 9 the difference between the blood is
99.3% and on Day 12 the difference between the blood is 88.1%. The99.3% and on Day 12 the difference between the blood is 88.1%. The
bacteria, Salmonella, was negative throughout the days of the trial.bacteria, Salmonella, was negative throughout the days of the trial.
Staphylococcus aureus and the total coliforms were all less then 10 throughStaphylococcus aureus and the total coliforms were all less then 10 through
the days also.the days also.

Weitere ähnliche Inhalte

Was ist angesagt?

Using Supercomputers and Data Analytics to Discover the Differences in Health...
Using Supercomputers and Data Analytics to Discover the Differences in Health...Using Supercomputers and Data Analytics to Discover the Differences in Health...
Using Supercomputers and Data Analytics to Discover the Differences in Health...Larry Smarr
 
Quantifying The Dynamics of Your Superorganism Body Using Big Data Supercompu...
Quantifying The Dynamics of Your Superorganism Body Using Big Data Supercompu...Quantifying The Dynamics of Your Superorganism Body Using Big Data Supercompu...
Quantifying The Dynamics of Your Superorganism Body Using Big Data Supercompu...Larry Smarr
 
Linking Phenotype Changes to Internal/External Longitudinal Time Series in a ...
Linking Phenotype Changes to Internal/External Longitudinal Time Series in a ...Linking Phenotype Changes to Internal/External Longitudinal Time Series in a ...
Linking Phenotype Changes to Internal/External Longitudinal Time Series in a ...Larry Smarr
 
Large Memory High Performance Computing Enables Comparison Across Human Gut M...
Large Memory High Performance ComputingEnables Comparison Across Human Gut M...Large Memory High Performance ComputingEnables Comparison Across Human Gut M...
Large Memory High Performance Computing Enables Comparison Across Human Gut M...Larry Smarr
 
Using Supercomputers and Data Science to Reveal Your Inner Microbiome
Using Supercomputers and Data Science to Reveal Your Inner MicrobiomeUsing Supercomputers and Data Science to Reveal Your Inner Microbiome
Using Supercomputers and Data Science to Reveal Your Inner MicrobiomeLarry Smarr
 
Potentals of human amniotic fluid stem cells
Potentals of human amniotic fluid stem cellsPotentals of human amniotic fluid stem cells
Potentals of human amniotic fluid stem cellsPeyman Ghoraishizadeh
 
Using Data Analytics to Discover the 100 Trillion Bacteria Living Within Each...
Using Data Analytics to Discover the 100 Trillion Bacteria Living Within Each...Using Data Analytics to Discover the 100 Trillion Bacteria Living Within Each...
Using Data Analytics to Discover the 100 Trillion Bacteria Living Within Each...Larry Smarr
 
Stability in Health vs. Abrupt Changes in Disease in the Human Gut Microbiome...
Stability in Health vs. Abrupt Changes in Disease in the Human Gut Microbiome...Stability in Health vs. Abrupt Changes in Disease in the Human Gut Microbiome...
Stability in Health vs. Abrupt Changes in Disease in the Human Gut Microbiome...Larry Smarr
 
Discovering the Other 90% of our Human Superorganism
Discovering the Other 90% of our Human SuperorganismDiscovering the Other 90% of our Human Superorganism
Discovering the Other 90% of our Human SuperorganismLarry Smarr
 
antibody engineering and xenotransplantation
antibody engineering and xenotransplantation antibody engineering and xenotransplantation
antibody engineering and xenotransplantation Karla Mae Manalo
 
Discovering the 100 Trillion Bacteria Living Within Each of Us
Discovering the 100 Trillion Bacteria Living Within Each of UsDiscovering the 100 Trillion Bacteria Living Within Each of Us
Discovering the 100 Trillion Bacteria Living Within Each of UsLarry Smarr
 
Big Data and Superorganism Genomics: Microbial Metagenomics Meets Human Genomics
Big Data and Superorganism Genomics: Microbial Metagenomics Meets Human GenomicsBig Data and Superorganism Genomics: Microbial Metagenomics Meets Human Genomics
Big Data and Superorganism Genomics: Microbial Metagenomics Meets Human GenomicsLarry Smarr
 
The Human Microbiome and the Revolution in Digital Health
The Human Microbiome and the Revolution in Digital HealthThe Human Microbiome and the Revolution in Digital Health
The Human Microbiome and the Revolution in Digital HealthLarry Smarr
 
Current Applications of Quasi Vivo
Current Applications of Quasi VivoCurrent Applications of Quasi Vivo
Current Applications of Quasi VivoSCIMS4
 
Interlaboratory comparison of results of an anthrax lethal toxin neutralizati...
Interlaboratory comparison of results of an anthrax lethal toxin neutralizati...Interlaboratory comparison of results of an anthrax lethal toxin neutralizati...
Interlaboratory comparison of results of an anthrax lethal toxin neutralizati...National Institute of Biologics
 
Using Supercomputing & Advanced Analytic Software to Discover Radical Changes...
Using Supercomputing & Advanced Analytic Software to Discover Radical Changes...Using Supercomputing & Advanced Analytic Software to Discover Radical Changes...
Using Supercomputing & Advanced Analytic Software to Discover Radical Changes...Larry Smarr
 
Machine Learning Opportunities in the Explosion of Personalized Precision Med...
Machine Learning Opportunities in the Explosion of Personalized Precision Med...Machine Learning Opportunities in the Explosion of Personalized Precision Med...
Machine Learning Opportunities in the Explosion of Personalized Precision Med...Larry Smarr
 

Was ist angesagt? (20)

Using Supercomputers and Data Analytics to Discover the Differences in Health...
Using Supercomputers and Data Analytics to Discover the Differences in Health...Using Supercomputers and Data Analytics to Discover the Differences in Health...
Using Supercomputers and Data Analytics to Discover the Differences in Health...
 
Monocyte recruitment into atherosclerotic plaques
Monocyte recruitment into atherosclerotic plaquesMonocyte recruitment into atherosclerotic plaques
Monocyte recruitment into atherosclerotic plaques
 
079 monocyte recruitment into atherosclerotic plaques
079 monocyte recruitment into atherosclerotic plaques079 monocyte recruitment into atherosclerotic plaques
079 monocyte recruitment into atherosclerotic plaques
 
Quantifying The Dynamics of Your Superorganism Body Using Big Data Supercompu...
Quantifying The Dynamics of Your Superorganism Body Using Big Data Supercompu...Quantifying The Dynamics of Your Superorganism Body Using Big Data Supercompu...
Quantifying The Dynamics of Your Superorganism Body Using Big Data Supercompu...
 
Linking Phenotype Changes to Internal/External Longitudinal Time Series in a ...
Linking Phenotype Changes to Internal/External Longitudinal Time Series in a ...Linking Phenotype Changes to Internal/External Longitudinal Time Series in a ...
Linking Phenotype Changes to Internal/External Longitudinal Time Series in a ...
 
Large Memory High Performance Computing Enables Comparison Across Human Gut M...
Large Memory High Performance ComputingEnables Comparison Across Human Gut M...Large Memory High Performance ComputingEnables Comparison Across Human Gut M...
Large Memory High Performance Computing Enables Comparison Across Human Gut M...
 
journal.pone.0055095
journal.pone.0055095journal.pone.0055095
journal.pone.0055095
 
Using Supercomputers and Data Science to Reveal Your Inner Microbiome
Using Supercomputers and Data Science to Reveal Your Inner MicrobiomeUsing Supercomputers and Data Science to Reveal Your Inner Microbiome
Using Supercomputers and Data Science to Reveal Your Inner Microbiome
 
Potentals of human amniotic fluid stem cells
Potentals of human amniotic fluid stem cellsPotentals of human amniotic fluid stem cells
Potentals of human amniotic fluid stem cells
 
Using Data Analytics to Discover the 100 Trillion Bacteria Living Within Each...
Using Data Analytics to Discover the 100 Trillion Bacteria Living Within Each...Using Data Analytics to Discover the 100 Trillion Bacteria Living Within Each...
Using Data Analytics to Discover the 100 Trillion Bacteria Living Within Each...
 
Stability in Health vs. Abrupt Changes in Disease in the Human Gut Microbiome...
Stability in Health vs. Abrupt Changes in Disease in the Human Gut Microbiome...Stability in Health vs. Abrupt Changes in Disease in the Human Gut Microbiome...
Stability in Health vs. Abrupt Changes in Disease in the Human Gut Microbiome...
 
Discovering the Other 90% of our Human Superorganism
Discovering the Other 90% of our Human SuperorganismDiscovering the Other 90% of our Human Superorganism
Discovering the Other 90% of our Human Superorganism
 
antibody engineering and xenotransplantation
antibody engineering and xenotransplantation antibody engineering and xenotransplantation
antibody engineering and xenotransplantation
 
Discovering the 100 Trillion Bacteria Living Within Each of Us
Discovering the 100 Trillion Bacteria Living Within Each of UsDiscovering the 100 Trillion Bacteria Living Within Each of Us
Discovering the 100 Trillion Bacteria Living Within Each of Us
 
Big Data and Superorganism Genomics: Microbial Metagenomics Meets Human Genomics
Big Data and Superorganism Genomics: Microbial Metagenomics Meets Human GenomicsBig Data and Superorganism Genomics: Microbial Metagenomics Meets Human Genomics
Big Data and Superorganism Genomics: Microbial Metagenomics Meets Human Genomics
 
The Human Microbiome and the Revolution in Digital Health
The Human Microbiome and the Revolution in Digital HealthThe Human Microbiome and the Revolution in Digital Health
The Human Microbiome and the Revolution in Digital Health
 
Current Applications of Quasi Vivo
Current Applications of Quasi VivoCurrent Applications of Quasi Vivo
Current Applications of Quasi Vivo
 
Interlaboratory comparison of results of an anthrax lethal toxin neutralizati...
Interlaboratory comparison of results of an anthrax lethal toxin neutralizati...Interlaboratory comparison of results of an anthrax lethal toxin neutralizati...
Interlaboratory comparison of results of an anthrax lethal toxin neutralizati...
 
Using Supercomputing & Advanced Analytic Software to Discover Radical Changes...
Using Supercomputing & Advanced Analytic Software to Discover Radical Changes...Using Supercomputing & Advanced Analytic Software to Discover Radical Changes...
Using Supercomputing & Advanced Analytic Software to Discover Radical Changes...
 
Machine Learning Opportunities in the Explosion of Personalized Precision Med...
Machine Learning Opportunities in the Explosion of Personalized Precision Med...Machine Learning Opportunities in the Explosion of Personalized Precision Med...
Machine Learning Opportunities in the Explosion of Personalized Precision Med...
 

Ähnlich wie Got Blood

Comparative analysis between monophasic and biphasic methods of blood culture
Comparative analysis between monophasic and biphasic methods of blood cultureComparative analysis between monophasic and biphasic methods of blood culture
Comparative analysis between monophasic and biphasic methods of blood cultureAlexander Decker
 
Relationship_between_plasma_iron_concent
Relationship_between_plasma_iron_concentRelationship_between_plasma_iron_concent
Relationship_between_plasma_iron_concentTim Hoffland
 
PancreaticLipaseResearchPaper
PancreaticLipaseResearchPaperPancreaticLipaseResearchPaper
PancreaticLipaseResearchPaperFiona Rambo
 
Neuroprotective Roles of Oleic Acid: An Antioxidant Status and Cerebellar Cha...
Neuroprotective Roles of Oleic Acid: An Antioxidant Status and Cerebellar Cha...Neuroprotective Roles of Oleic Acid: An Antioxidant Status and Cerebellar Cha...
Neuroprotective Roles of Oleic Acid: An Antioxidant Status and Cerebellar Cha...semualkaira
 
nasa.extremophile.poster.
nasa.extremophile.poster.nasa.extremophile.poster.
nasa.extremophile.poster.Sara Gowin
 
Studies On The Effectiveness of Mixed Diet of Garden Egg, Groundnut And Garli...
Studies On The Effectiveness of Mixed Diet of Garden Egg, Groundnut And Garli...Studies On The Effectiveness of Mixed Diet of Garden Egg, Groundnut And Garli...
Studies On The Effectiveness of Mixed Diet of Garden Egg, Groundnut And Garli...IOSR Journals
 
The Emerging Personalized Medicine Paradigm of Time-Series Tracking of Mind, ...
The Emerging Personalized Medicine Paradigm of Time-Series Tracking of Mind, ...The Emerging Personalized Medicine Paradigm of Time-Series Tracking of Mind, ...
The Emerging Personalized Medicine Paradigm of Time-Series Tracking of Mind, ...Larry Smarr
 
How Studying Astrophysics and Coral Reefs Enabled Me to Become an Empowered,...
How Studying Astrophysics and Coral Reefs Enabled Me to Become an Empowered,...How Studying Astrophysics and Coral Reefs Enabled Me to Become an Empowered,...
How Studying Astrophysics and Coral Reefs Enabled Me to Become an Empowered,...Larry Smarr
 
Quantifying your Superorganism: Your Gut Microbiome and its Interactions with...
Quantifying your Superorganism: Your Gut Microbiome and its Interactions with...Quantifying your Superorganism: Your Gut Microbiome and its Interactions with...
Quantifying your Superorganism: Your Gut Microbiome and its Interactions with...Larry Smarr
 
Alkaline hydrolysis-of-prion-positive-materials-r-murphy
Alkaline hydrolysis-of-prion-positive-materials-r-murphyAlkaline hydrolysis-of-prion-positive-materials-r-murphy
Alkaline hydrolysis-of-prion-positive-materials-r-murphyIIAD
 
Alkaline hydrolysis-of-prion-positive-materials-r-murphy
Alkaline hydrolysis-of-prion-positive-materials-r-murphyAlkaline hydrolysis-of-prion-positive-materials-r-murphy
Alkaline hydrolysis-of-prion-positive-materials-r-murphyIIAD
 
THE EFFECT OF PR.docx
THE EFFECT OF PR.docxTHE EFFECT OF PR.docx
THE EFFECT OF PR.docxmehek4
 
TEDMED 2013 Talk
TEDMED 2013 TalkTEDMED 2013 Talk
TEDMED 2013 TalkLarry Smarr
 
Toxicology of genetically modified sheep meat
Toxicology of genetically modified sheep meatToxicology of genetically modified sheep meat
Toxicology of genetically modified sheep meatAsma Bano
 

Ähnlich wie Got Blood (20)

Comparative analysis between monophasic and biphasic methods of blood culture
Comparative analysis between monophasic and biphasic methods of blood cultureComparative analysis between monophasic and biphasic methods of blood culture
Comparative analysis between monophasic and biphasic methods of blood culture
 
Liver Enzymes Assay and Haematological Parameters of Bacteria Infected Guinea...
Liver Enzymes Assay and Haematological Parameters of Bacteria Infected Guinea...Liver Enzymes Assay and Haematological Parameters of Bacteria Infected Guinea...
Liver Enzymes Assay and Haematological Parameters of Bacteria Infected Guinea...
 
Relationship_between_plasma_iron_concent
Relationship_between_plasma_iron_concentRelationship_between_plasma_iron_concent
Relationship_between_plasma_iron_concent
 
PancreaticLipaseResearchPaper
PancreaticLipaseResearchPaperPancreaticLipaseResearchPaper
PancreaticLipaseResearchPaper
 
Science investigatory project...
Science investigatory project...Science investigatory project...
Science investigatory project...
 
Neuroprotective Roles of Oleic Acid: An Antioxidant Status and Cerebellar Cha...
Neuroprotective Roles of Oleic Acid: An Antioxidant Status and Cerebellar Cha...Neuroprotective Roles of Oleic Acid: An Antioxidant Status and Cerebellar Cha...
Neuroprotective Roles of Oleic Acid: An Antioxidant Status and Cerebellar Cha...
 
Neuroprotective Roles of Oleic Acid: An Antioxidant Status and Cerebellar Cha...
Neuroprotective Roles of Oleic Acid: An Antioxidant Status and Cerebellar Cha...Neuroprotective Roles of Oleic Acid: An Antioxidant Status and Cerebellar Cha...
Neuroprotective Roles of Oleic Acid: An Antioxidant Status and Cerebellar Cha...
 
nasa.extremophile.poster.
nasa.extremophile.poster.nasa.extremophile.poster.
nasa.extremophile.poster.
 
Studies On The Effectiveness of Mixed Diet of Garden Egg, Groundnut And Garli...
Studies On The Effectiveness of Mixed Diet of Garden Egg, Groundnut And Garli...Studies On The Effectiveness of Mixed Diet of Garden Egg, Groundnut And Garli...
Studies On The Effectiveness of Mixed Diet of Garden Egg, Groundnut And Garli...
 
Invivo pharmacology
Invivo pharmacologyInvivo pharmacology
Invivo pharmacology
 
The Emerging Personalized Medicine Paradigm of Time-Series Tracking of Mind, ...
The Emerging Personalized Medicine Paradigm of Time-Series Tracking of Mind, ...The Emerging Personalized Medicine Paradigm of Time-Series Tracking of Mind, ...
The Emerging Personalized Medicine Paradigm of Time-Series Tracking of Mind, ...
 
How Studying Astrophysics and Coral Reefs Enabled Me to Become an Empowered,...
How Studying Astrophysics and Coral Reefs Enabled Me to Become an Empowered,...How Studying Astrophysics and Coral Reefs Enabled Me to Become an Empowered,...
How Studying Astrophysics and Coral Reefs Enabled Me to Become an Empowered,...
 
Quantifying your Superorganism: Your Gut Microbiome and its Interactions with...
Quantifying your Superorganism: Your Gut Microbiome and its Interactions with...Quantifying your Superorganism: Your Gut Microbiome and its Interactions with...
Quantifying your Superorganism: Your Gut Microbiome and its Interactions with...
 
Alkaline hydrolysis-of-prion-positive-materials-r-murphy
Alkaline hydrolysis-of-prion-positive-materials-r-murphyAlkaline hydrolysis-of-prion-positive-materials-r-murphy
Alkaline hydrolysis-of-prion-positive-materials-r-murphy
 
Alkaline hydrolysis-of-prion-positive-materials-r-murphy
Alkaline hydrolysis-of-prion-positive-materials-r-murphyAlkaline hydrolysis-of-prion-positive-materials-r-murphy
Alkaline hydrolysis-of-prion-positive-materials-r-murphy
 
THE EFFECT OF PR.docx
THE EFFECT OF PR.docxTHE EFFECT OF PR.docx
THE EFFECT OF PR.docx
 
TEDMED 2013 Talk
TEDMED 2013 TalkTEDMED 2013 Talk
TEDMED 2013 Talk
 
Toxicology of genetically modified sheep meat
Toxicology of genetically modified sheep meatToxicology of genetically modified sheep meat
Toxicology of genetically modified sheep meat
 
Research paper
Research paperResearch paper
Research paper
 

Got Blood

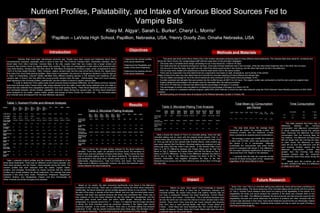
  • 1. Nutrient Profiles, Palatability, and Intake of Various Blood Sources Fed toNutrient Profiles, Palatability, and Intake of Various Blood Sources Fed to Vampire BatsVampire Bats Kiley M. AlgyaKiley M. Algya11 , Sarah L. Burke, Sarah L. Burke22 , Cheryl L. Morris, Cheryl L. Morris22 11 Papillion – LaVista High School, Papillion, Nebraska, USA,Papillion – LaVista High School, Papillion, Nebraska, USA, 22 Henry Doorly Zoo, Omaha Nebraska, USAHenry Doorly Zoo, Omaha Nebraska, USA IntroductionIntroduction Vampire Bats have been stereotyped centuries ago. People have been scared and frightened about these misunderstood creatures, especially when it came to their diet. The Common Vampire Bat’s, Desmodus rotundus, diet is blood taken from other mammals. Vampire Bats, in the wild, usually inject their two incisors into a larger animal and consume that animal’s blood by lapping rather than sucking. They have an anticoagulant in their saliva that prevents blood clots while feeding. Vampire Bats will drink about 40 millimeters (8 teaspoons) of blood a night, which corresponds to about 132% of its body weight (Richarz, 1993). However, captive vampire bats, like the ones at the Henry Doorly Zoo, digest blood that came from local meat packing facilities. When blood is processed, the amount of dangerous bacteria is may be high as a result of mishandling. Chaverri (2006) identified thirty different bacteria species in the stomach and intestines of wild vampire bats. In theory, this may affect the young juvenile vampire bat’s life span. Unfortunately, there isn’t much existing data regarding to the microbial profiles, preferences, and the nutrition of blood to captive vampire bats. In order to determine if the captive bats would consume blood processed differently, we fed twelve common vampire bats blood that was either Freeze-Dried, after being collected from live cattle, frozen after being collected from live cattle or blood that was collected from slaughtered cattle from local meat packing facility. These blood treatments were all compared and contrasted between nutrient profiles, palatability, and their intake among the vampire bats. All three blood treatments were analyzed on dry matter, organic matter, protein and energy at Henry Doorly Zoo nutrition lab. The microbial plates and minerals were all analyzed from the local Midwest Laboratory. ObjectivesObjectives • Determine the nutrient profiles of the blood treatments •Determine the Palatability and intake of the blood treatments •Determine the bacteria amount of the blood treatments Methods and MaterialsMethods and Materials This study was done at the Henry Doorly Zoo in the nutrition laboratory analyzing data for three different blood treatments. The Vampire Bats were cared for, monitored and fed by the Henry Doorly Zoo Jungle keeper staff with the supervision of the principal investigator. • The study was a complete block design consisting of a six 5-day blocks for a total of 30 days • Two diets were fed out randomly among four ice trays. (One type of blood treatment was in two ice trays, while the other blood treatment was in the other two ice trays) • The amount of blood fed daily, was split into half. Half of the blood would be fed in the morning, and the other half would be fed in the afternoon. • The ice trays were rotated and randomized so that the diets weren’t fed in the same location • There was an evaporation tray that determined any evaporative loss based on light, temperature, and humidity of the exhibit. Intake of blood from each tray was determined and recorded by accurate weighing of blood offered and refused daily • The Dry Matter percentage for all of the blood treatments were achieved by the Freeze-Dried percentage 19.4% • Crucible contained wet samples that were placed into the muffle furnace at 500°C for 24 hours. The organic matter was combusted so that the ash could be weighed back. • Organic Material’s percentage in the sample could be calculated after the ashing procedure. • The LECO FP-528 was a machine that determined the percentage of nitrogen in a sample. • The percentage of protein was calculated by multiplying the percentage of nitrogen by a factor of 6.25. • Data was entered in a statistical software program called SAS (SAS Institute) in which the data was analyzed using the GLM (General Linear Models) procedure of SAS (SAS Institute). • Microbial plating and minerals were all analyzed at the Midwest laboratory located in Omaha, NE. Table 1. Nutrient Profile and Mineral AnalysisTable 1. Nutrient Profile and Mineral Analysis ConsumptionConsumption StdStd P-valueP-value A.MA.M 21.3 16.3 < .0001 P.MP.M 36.1 14.8 < .0001 Time ConsumptionTime Consumption PeriodPeriod 11 PeriodPeriod 22 PeriodPeriod 33 PeriodPeriod 44 PeriodPeriod 55 PeriodPeriod 66 Avg.Avg. P-valueP-value Min.Min. P-valueP-value MaxMax P-valueP-value 230.00 238.40 223.20 214.00 210.40 171.20 0.83988 0.1204 2 v. 6 1.0000 4 v. 5 Total Mean (g) ConsumptionTotal Mean (g) Consumption per Periodper Period Table 2. Microbial Plating AnalysisTable 2. Microbial Plating Analysis This data table shows the average blood consumed per period, the average p-value, the minimum p-value, and the maximum p-value when comparing all possible period combinations. The average p-value was 0.8399. the minimum p-value was 0.01204, which was associated with the period 2 vs. 6 combination. Although numerically the consumption was lower during period 6 compared with period 2, this difference did not reach statistical significance of having a p- value less than 0.05. Based on the statistics, I conclude that the bats did consume similar amounts of blood during each of the treatments regardless of the blood offered to them. Future ResearchFuture Research Since Trial 1 and Trial 2 on microbial plating was preformed, there will be future monitoring onSince Trial 1 and Trial 2 on microbial plating was preformed, there will be future monitoring on the microbial plating. The future analyzing of the microbial plating will be similar with the processthe microbial plating. The future analyzing of the microbial plating will be similar with the process of Trial 2. Another future research area would be looking at the digestibility of the bloods. In aof Trial 2. Another future research area would be looking at the digestibility of the bloods. In a digestibility the study one would analyze the nutrients in the feces and compare them to thedigestibility the study one would analyze the nutrients in the feces and compare them to the nutrients in the diets. The difference between the fecal amounts and diet amounts would be thenutrients in the diets. The difference between the fecal amounts and diet amounts would be the digestibility amounts and would determine the amount of proteins and other minerals that thedigestibility amounts and would determine the amount of proteins and other minerals that the vampire bats absorbed in their body. Each blood treatment would be fed out individually insteadvampire bats absorbed in their body. Each blood treatment would be fed out individually instead of two blood treatments at a time. Hopefully these studies will help us reach our goal of finding aof two blood treatments at a time. Hopefully these studies will help us reach our goal of finding a diet that promotes longevity.diet that promotes longevity. ConclusionConclusion Based on my results, the bats consumed significantly more blood in the afternoonBased on my results, the bats consumed significantly more blood in the afternoon compared to the morning. There was no preference among the three blood treatments.compared to the morning. There was no preference among the three blood treatments. Additionally, the blood treatment nutrient profiles appeared similar to one another. Prior toAdditionally, the blood treatment nutrient profiles appeared similar to one another. Prior to the start of the study, a sample of the blood offered had very high microbial plate counts.the start of the study, a sample of the blood offered had very high microbial plate counts. However, that batch was ignored because the blood was considered bad. There was aHowever, that batch was ignored because the blood was considered bad. There was a new analysis on the new blood obtained the day the cattle were slaughtered, and thenew analysis on the new blood obtained the day the cattle were slaughtered, and the microbial plate counts were lower and within health ranges. Although the blood ismicrobial plate counts were lower and within health ranges. Although the blood is refrigerated, it is typically stored from 7 – 10 days. It is believed that the longer the bloodrefrigerated, it is typically stored from 7 – 10 days. It is believed that the longer the blood is stored, the more microbes would be produced, resulting in the higher plate countsis stored, the more microbes would be produced, resulting in the higher plate counts observed originally. In the month of March, there was a microbial plating trial analysisobserved originally. In the month of March, there was a microbial plating trial analysis preformed. In this trial the results concluded that every three days, the microbial countpreformed. In this trial the results concluded that every three days, the microbial count had increased drastically. The microbial counting will monitored for further results.had increased drastically. The microbial counting will monitored for further results. Table 1 presents nutrient profiles and the mineral concentrations of theTable 1 presents nutrient profiles and the mineral concentrations of the three blood treatments. There was six different current blood samples, twothree blood treatments. There was six different current blood samples, two fresh blood samples, and two freeze – dried samples during this study. Thefresh blood samples, and two freeze – dried samples during this study. The nutrient profiles that were analyzed were dry matter, organic matter,nutrient profiles that were analyzed were dry matter, organic matter, proteins, and energies. Numerically my results conclude that the nutrientproteins, and energies. Numerically my results conclude that the nutrient profiles were similar between the blood treatments. The minerals that wereprofiles were similar between the blood treatments. The minerals that were analyzed in this study were: Sulfur, Phosphorus, Potassium, Magnesium,analyzed in this study were: Sulfur, Phosphorus, Potassium, Magnesium, Calcium, Sodium, Iron, Manganese, Copper, and Zinc. Numerically, allCalcium, Sodium, Iron, Manganese, Copper, and Zinc. Numerically, all these minerals are similar throughout the samples.these minerals are similar throughout the samples. Table 2 shows the microbial plating analysis for the blood treatmentTable 2 shows the microbial plating analysis for the blood treatment samples. There was, again, six samples of current blood, two samples ofsamples. There was, again, six samples of current blood, two samples of fresh blood, and two samples of freeze-dried blood. Table 2 shows the firstfresh blood, and two samples of freeze-dried blood. Table 2 shows the first trial of microbial plating done on the blood treatments. The bacteria thattrial of microbial plating done on the blood treatments. The bacteria that was analyzed in this study were: Aerobic plate count, E. coli, Mold Count,was analyzed in this study were: Aerobic plate count, E. coli, Mold Count, Salmonella, Staphylococcus, Total Coli Forms, and Yeast. The AerobicSalmonella, Staphylococcus, Total Coli Forms, and Yeast. The Aerobic Plate count is different numerically, however, the other five bacteria's werePlate count is different numerically, however, the other five bacteria's were similar between the blood treatments.similar between the blood treatments. This table presents that there was aThis table presents that there was a difference between the morningdifference between the morning consumption and afternoon consumptionconsumption and afternoon consumption of blood treatments among the vampireof blood treatments among the vampire bats. Obviously, the afternoon had morebats. Obviously, the afternoon had more consumption then the morning likely forconsumption then the morning likely for two reasons. The afternoon ice trays weretwo reasons. The afternoon ice trays were left out longer than the morning ice trays.left out longer than the morning ice trays. In other words, the afternoon ice traysIn other words, the afternoon ice trays were left out from the afternoon until thewere left out from the afternoon until the next morning. Another reason why thenext morning. Another reason why the afternoon consumption number wasafternoon consumption number was greater than the morning was likelygreater than the morning was likely because vampire bats are nocturnal;because vampire bats are nocturnal; therefore they were more active during thetherefore they were more active during the night.night. Based upon the p-values, we areBased upon the p-values, we are 99.99% confident that there is a difference99.99% confident that there is a difference in intake due to time.in intake due to time. Before my study, there wasn’t much knowledge or research about the nutritional value of blood fed to Desmodus rotundus and microbial profiles. My results have shown that captive vampire bats do not have a preference between the blood treatments: Current Blood, Frozen Blood, and Freeze – Dried Blood. This is beneficial because zoos all over the world can now have the chance to house vampire bats in their domain. There aren’t many zoos that can house vampire bats because theythey don’t have a meat packing facility near them. Frozen Blood and Freeze – Dried Blood are more beneficial then the Current Blood for a variety of reasons. Freeze Dried and Frozen Blood both have the same nutritional value as the Current Blood. ImpactImpact ResultsResults SampleSample CB 1CB 1 (Block 1(Block 1 & 2)& 2) CB 2CB 2 (Block 1(Block 1 & 2)& 2) CB 3CB 3 (Block 3(Block 3 & 4)& 4) CB 4CB 4 (Block 3(Block 3 & 4)& 4) CB 5CB 5 (Block 5(Block 5 & 6)& 6) CB 6CB 6 (Block 3(Block 3 & 6)& 6) FB 1FB 1 FB 2FB 2 FDB 1FDB 1 FDB 2FDB 2 % DM (105° C)% DM (105° C) 19.84 19.75 19.15 19.04 20.02 20.08 22.58 18.28 19.4 19.4 % OM (DMB)% OM (DMB) 94.54 94.62 93.74 93.98 % CP (DMB)% CP (DMB) 79.95 89.15 92.65 93.11 90.39 94.73 93.35 92.49 93.35 95.21 Gross EnergyGross Energy (cal/g) (DMB)(cal/g) (DMB) 6,045.88 5,868.38 5,772.58 5,223.07 6,257.24 6,264.33 5,560.9 5,522.68 5,556.29 5,456.53 Sulfur (%)Sulfur (%) (DMB)(DMB) 0.77 0.77 0.62 0.72 0.72 0.72 0.72 0.72 0.71 0.76 PhosphorusPhosphorus (%) (DMB)(%) (DMB) 0.1 0.1 0.05 0.1 0.1 0.1 0.1 0.1 0.11 0.11 Potassium (%)Potassium (%) (DMB)(DMB) 0.31 0.25 0.31 0.31 0.21 0.21 0.31 0.31 0.3 0.27 Magnesium (%)Magnesium (%) (DMB)(DMB) <1 <0.01 <0.01 <0.01 <0.01 <0.01 <0.01 <0.01 0.013 0.027 Calcium (%)Calcium (%) (DMB)(DMB) 0.26 0.05 <0.01 <0.01 <0.01 <0.01 0.05 <0.01 0.04 0.07 Sodium (%)Sodium (%) (DMB)(DMB) 1.8 1.75 1.75 1.86 1.6 1.65 1.8 1.65 1.42 1.41 Iron (ppm)Iron (ppm) (DMB(DMB 2,423 2,392 2,046 2,155 2,474 2,562 2,495 2,170 2,388 2101 ManganeseManganese (ppm) (DMB)(ppm) (DMB) <10 <1 <1 <1 <1 <1 5 <1 <1 7 Copper (ppm)Copper (ppm) (DMB)(DMB) 5 5 5 5 5 5 10 10 5 13 Zinc (ppm)Zinc (ppm) (DMB)(DMB) 15 10 10 15 15 15 21 15 18 20 SampleSample FreshFresh BloodBlood Day 1Day 1 FeederFeeder BloodBlood Day 3Day 3 FeederFeeder BloodBlood Day 6Day 6 FeederFeeder BloodBlood Day 9Day 9 FeederFeeder BloodBlood Day 12Day 12 Not FedNot Fed BloodBlood Day 3Day 3 Not FedNot Fed BloodBlood Day 6Day 6 Not FedNot Fed BloodBlood Day 9Day 9 Not FedNot Fed BloodBlood Day 12Day 12 Aerobic plateAerobic plate count (cfu/g)count (cfu/g) (DMB)(DMB) 1,340 2,423 1,288,660 1,030,928 4,278,351 773 618,557 139,175,258 515,464 SalmonellaSalmonella (org/25g) (DMB)(org/25g) (DMB) negative negative negative negative negative negative negative negative negative StaphylococcusStaphylococcus aureus (cfu/g)aureus (cfu/g) (DMB)(DMB) <10 <10 <10 <10 <10 <10 <10 <10 <10 Total coliformsTotal coliforms (cfu/g) (DMB)(cfu/g) (DMB) <10 <10 <10 <10 <10 <10 <10 <10 <10 SampleSample CB 1CB 1 (Block(Block 1 & 2)1 & 2) CB 2CB 2 (Block(Block 1 & 2)1 & 2) CB 3CB 3 (Block(Block 4 & 5)4 & 5) CB 4CB 4 (Block(Block 4 & 5)4 & 5) CB 5CB 5 (Block(Block 7 & 8)7 & 8) CB 6CB 6 (Block(Block 7& 8)7& 8) FB 1FB 1 FB 2FB 2 FDB 1FDB 1 FDB 2FDB 2 Aerobic plateAerobic plate count (cfu/g)count (cfu/g) (DMB)(DMB) 463.9 360.8 103.1 <10 619 928 928 206 180 3,000 E. coli (cfu/g)E. coli (cfu/g) (DMB)(DMB) <10 <10 <10 <10 <10 <10 <10 <10 <10 <10 Mold CountMold Count (cfu/g) (DMB)(cfu/g) (DMB) <10 <10 <10 <10 <10 <10 <10 <10 190 6,800 SalmonellaSalmonella (org/25g) (DMB)(org/25g) (DMB) negative negative negative negative negative negative negative negative negative negative StaphylococcusStaphylococcus aureus (cfu/g)aureus (cfu/g) (DMB)(DMB) <10 <10 <10 <10 <10 <10 <10 <10 <10 420 Total coliformsTotal coliforms (cfu/g) (DMB)(cfu/g) (DMB) <10 <10 <10 <10 <10 <10 <10 <10 <10 <10 Yeast (cfu/g)Yeast (cfu/g) (DMB)(DMB) <10 <10 <10 <10 <10 <10 <10 <10 <10 <10 Table 3. Microbial Plating Trial AnalysisTable 3. Microbial Plating Trial Analysis Table 3 shows the results of Trial 2 on microbial plating. Since the highTable 3 shows the results of Trial 2 on microbial plating. Since the high microbial plating was an issue with the original blood sample (Trial 1), amicrobial plating was an issue with the original blood sample (Trial 1), a second study was conducted to monitor the bacteria counts over time (Trialsecond study was conducted to monitor the bacteria counts over time (Trial 2). One jug was fed to the vampire bats (Feeder Blood), while another jug2). One jug was fed to the vampire bats (Feeder Blood), while another jug was never opened (Not Fed Blood). Microbial plating was analyzed on bothwas never opened (Not Fed Blood). Microbial plating was analyzed on both blood jugs every third day while it was stored. In the Aerobic Plate Countblood jugs every third day while it was stored. In the Aerobic Plate Count there is a 68.1% difference between the Feeder Blood and the Not Fedthere is a 68.1% difference between the Feeder Blood and the Not Fed Blood on Day 3. Between the Feeder Blood, and Not Fed Blood on Day 6,Blood on Day 3. Between the Feeder Blood, and Not Fed Blood on Day 6, there is a 95.2% difference. On Day 9 the difference between the blood isthere is a 95.2% difference. On Day 9 the difference between the blood is 99.3% and on Day 12 the difference between the blood is 88.1%. The99.3% and on Day 12 the difference between the blood is 88.1%. The bacteria, Salmonella, was negative throughout the days of the trial.bacteria, Salmonella, was negative throughout the days of the trial. Staphylococcus aureus and the total coliforms were all less then 10 throughStaphylococcus aureus and the total coliforms were all less then 10 through the days also.the days also.