Keynote technicals intraday future levels for 261112
•
0 gefällt mir•163 views

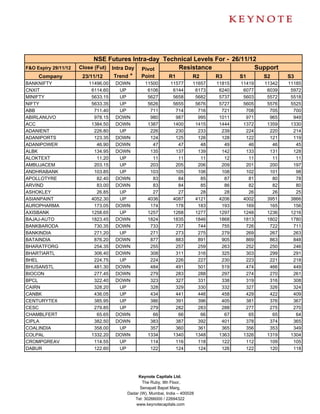
The document provides the intra-day technical levels for various companies trading on the NSE for November 26, 2012. It includes the previous day's closing price, identified trend (up/down), pivot point, and resistance and support levels for each stock. The levels are intended to help analyze the stock's potential price movements during the trading day.

Empfohlen
Empfohlen
Weitere ähnliche Inhalte
Was ist angesagt?
Was ist angesagt? (20)
Andere mochten auch
Andere mochten auch (20)
Ähnlich wie Keynote technicals intraday future levels for 261112
Ähnlich wie Keynote technicals intraday future levels for 261112 (13)
Mehr von Keynote Capitals Ltd.
Mehr von Keynote Capitals Ltd. (20)
Keynote technicals intraday future levels for 261112
- 1. NSE Futures Intra-day Technical Levels For - 26/11/12 F&O Expiry 29/11/12 Close (Fut) Intra Day Pivot Resistance Support Company 23/11/12 Trend * Point R1 R2 R3 S1 S2 S3 BANKNIFTY 11496.00 DOWN 11500 11577 11657 11815 11419 11342 11185 CNXIT 6114.60 UP 6106 6144 6173 6240 6077 6039 5972 MINIFTY 5633.15 UP 5627 5658 5682 5737 5603 5572 5518 NIFTY 5633.35 UP 5626 5655 5676 5727 5605 5576 5525 ABB 711.40 UP 711 714 716 721 708 705 700 ABIRLANUVO 978.15 DOWN 980 987 995 1011 971 965 949 ACC 1384.50 DOWN 1387 1400 1415 1444 1372 1359 1330 ADANIENT 226.80 UP 226 230 233 239 224 220 214 ADANIPORTS 123.35 DOWN 124 125 126 128 122 121 119 ADANIPOWER 46.90 DOWN 47 47 48 49 46 46 45 ALBK 134.95 DOWN 135 137 139 142 133 131 128 ALOKTEXT 11.20 UP 11 11 11 12 11 11 11 AMBUJACEM 203.15 UP 203 205 206 209 201 200 197 ANDHRABANK 103.85 UP 103 105 106 108 102 101 98 APOLLOTYRE 82.40 DOWN 83 84 85 87 81 80 78 ARVIND 83.00 DOWN 83 84 85 86 82 82 80 ASHOKLEY 26.85 UP 27 27 28 28 26 26 25 ASIANPAINT 4052.30 UP 4036 4087 4121 4206 4002 3951 3866 AUROPHARMA 173.05 DOWN 174 178 183 193 169 165 156 AXISBANK 1258.65 UP 1257 1268 1277 1297 1248 1236 1216 BAJAJ-AUTO 1823.45 DOWN 1824 1835 1846 1868 1813 1802 1780 BANKBARODA 730.35 DOWN 733 737 744 755 726 722 711 BANKINDIA 271.20 UP 271 273 275 279 269 267 263 BATAINDIA 876.20 DOWN 877 883 891 905 869 863 848 BHARATFORG 254.35 DOWN 255 257 259 263 252 250 246 BHARTIARTL 306.40 DOWN 308 311 316 325 303 299 291 BHEL 224.75 UP 224 226 227 230 223 221 218 BHUSANSTL 481.30 DOWN 484 491 501 519 474 466 449 BIOCON 277.45 DOWN 279 283 288 297 274 270 261 BPCL 322.40 DOWN 323 327 331 338 319 316 308 CAIRN 328.20 UP 328 329 330 332 327 326 324 CANBK 436.05 UP 434 441 446 458 429 422 409 CENTURYTEX 385.95 UP 386 391 396 405 381 376 367 CESC 279.85 UP 279 282 283 288 277 275 270 CHAMBLFERT 65.65 DOWN 66 66 66 67 65 65 64 CIPLA 382.50 DOWN 383 387 392 401 378 374 365 COALINDIA 358.00 UP 357 360 361 365 356 353 349 COLPAL 1332.20 DOWN 1334 1340 1348 1363 1326 1319 1304 CROMPGREAV 114.55 UP 114 116 118 122 112 109 105 DABUR 122.60 UP 122 124 124 126 122 120 118 Keynote Capitals Ltd. The Ruby, 9th Floor, Senapati Bapat Marg, Dadar (W), Mumbai, India – 400028 Tel: 30266000 / 22694322 www.keynotecapitals.com
- 2. NSE Futures Intra-day Technical Levels For - 26/11/12 F&O Expiry 29/11/12 Close (Fut) Intra Day Pivot Resistance Support Company 23/11/12 Trend * Point R1 R2 R3 S1 S2 S3 DENABANK 104.80 DOWN 105 106 107 109 104 103 100 DISHTV 73.65 UP 74 74 75 76 73 72 71 DIVISLAB 1174.30 DOWN 1179 1187 1200 1220 1167 1159 1139 DLF 201.00 UP 201 203 205 210 198 196 191 DRREDDY 1742.75 UP 1737 1756 1770 1803 1724 1704 1672 EXIDEIND 139.65 DOWN 140 141 142 144 139 138 136 FEDERALBNK 463.80 UP 464 465 467 469 462 461 458 FINANTECH 1115.75 DOWN 1121 1142 1167 1213 1096 1075 1029 GAIL 340.70 DOWN 343 347 353 362 337 334 325 GMRINFRA 17.90 DOWN 18 18 19 19 18 17 17 GODREJIND 288.55 DOWN 289 293 297 305 285 281 273 GRASIM 3183.65 DOWN 3205 3234 3285 3365 3154 3124 3044 GSPL 72.25 DOWN 72 73 74 76 72 71 69 GUJFLUORO 310.55 DOWN 311 314 318 326 307 303 295 GVKPIL 12.15 DOWN 12 12 12 13 12 12 12 HAVELLS 586.60 DOWN 589 597 607 624 579 572 554 HCLTECH 636.80 UP 635 641 644 654 631 626 617 HDFC 779.95 UP 779 783 786 794 775 771 763 HDFCBANK 669.80 UP 668 674 678 689 663 657 646 HDIL 104.15 UP 104 106 107 110 103 101 98 HEROMOTOCO 1830.80 UP 1824 1845 1859 1893 1810 1790 1755 HEXAWARE 101.75 DOWN 102 103 105 108 101 100 97 HINDALCO 108.15 UP 108 109 110 111 107 106 105 HINDPETRO 280.55 DOWN 282 283 286 290 279 277 273 HINDUNILVR 530.75 UP 530 534 537 544 527 522 515 HINDZINC 131.75 DOWN 132 134 135 138 131 129 127 IBREALEST 64.15 DOWN 64 65 66 68 63 62 60 ICICIBANK 1028.20 DOWN 1031 1039 1050 1069 1020 1012 993 IDBI 102.70 UP 102 104 105 108 101 100 97 IDEA 93.00 UP 93 94 96 99 91 90 87 IDFC 158.10 UP 157 160 161 165 156 153 149 IFCI 28.30 DOWN 28 29 29 30 28 28 27 IGL 259.30 UP 259 261 262 265 258 256 254 INDHOTEL 61.10 UP 60 63 64 69 58 55 51 INDIACEM 83.20 DOWN 83 84 85 87 82 81 79 INDUSINDBK 375.55 DOWN 376 379 382 388 373 370 364 INFY 2377.55 DOWN 2379 2401 2424 2468 2356 2334 2289 IOB 75.25 UP 75 76 77 78 74 73 72 IOC 258.80 UP 258 260 261 263 257 256 253 IRB 122.90 UP 123 124 125 128 122 120 118 Keynote Capitals Ltd. The Ruby, 9th Floor, Senapati Bapat Marg, Dadar (W), Mumbai, India – 400028 Tel: 30266000 / 22694322 www.keynotecapitals.com
- 3. NSE Futures Intra-day Technical Levels For - 26/11/12 F&O Expiry 29/11/12 Close (Fut) Intra Day Pivot Resistance Support Company 23/11/12 Trend * Point R1 R2 R3 S1 S2 S3 ITC 286.80 UP 286 289 292 297 284 281 276 IVRCLINFRA 39.30 DOWN 39 40 41 42 39 38 37 JINDALSTEL 375.90 UP 376 379 382 388 373 369 363 JISLJALEQS 63.55 DOWN 64 65 66 68 63 62 60 JPASSOCIAT 89.45 UP 89 91 92 96 88 86 83 JPPOWER 36.65 UP 37 37 38 39 36 36 35 JSWENERGY 61.05 UP 61 62 62 63 60 60 58 JSWSTEEL 718.05 UP 715 723 728 741 710 702 689 JUBLFOOD 1262.50 DOWN 1269 1282 1302 1334 1249 1236 1203 KOTAKBANK 626.20 DOWN 627 632 637 647 622 618 608 KTKBANK 152.90 UP 149 159 164 179 144 135 120 LICHSGFIN 245.70 DOWN 246 248 250 254 244 242 238 LT 1588.50 UP 1588 1602 1616 1644 1574 1560 1532 LUPIN 562.00 DOWN 563 566 571 579 559 556 548 M&M 955.15 UP 954 959 963 973 950 944 935 MARUTI 1496.60 UP 1496 1506 1516 1536 1486 1476 1456 MCDOWELL-N 1884.85 UP 1869 1917 1950 2030 1836 1788 1707 MCLEODRUSS 333.85 UP 331 338 342 352 327 321 311 MPHASIS 396.20 UP 396 398 400 403 394 393 389 MRF 10012.80 DOWN 10036 10073 10132 10228 9977 9940 9844 NHPC 23.15 UP 23 23 24 24 23 23 22 NMDC 167.30 DOWN 168 170 172 175 166 164 161 NTPC 159.95 DOWN 162 165 170 177 157 154 146 OFSS 2840.50 UP 2838 2858 2875 2911 2821 2801 2764 ONGC 251.75 UP 251 253 255 258 250 248 245 OPTOCIRCUI 100.50 DOWN 101 103 105 109 99 97 93 ORIENTBANK 316.15 DOWN 318 323 330 342 311 305 293 PANTALOONR 183.00 UP 182 187 191 200 178 172 163 PEL 490.20 UP 487 494 498 508 483 477 466 PETRONET 155.60 DOWN 156 157 159 162 155 154 151 PFC 183.10 UP 183 185 186 189 182 180 177 PNB 736.60 UP 736 741 746 756 731 726 716 POWERGRID 119.65 DOWN 120 121 121 123 119 118 116 PTC 70.70 UP 71 71 72 73 70 69 68 PUNJLLOYD 49.50 DOWN 50 50 51 52 49 48 47 RANBAXY 497.70 DOWN 502 511 525 548 488 478 455 RAYMOND 397.75 DOWN 399 402 407 414 395 392 384 RCOM 63.60 UP 63 65 66 68 62 61 58 RECLTD 221.60 DOWN 222 224 227 232 219 217 212 RELCAPITAL 384.00 DOWN 384 388 393 401 380 376 367 Keynote Capitals Ltd. The Ruby, 9th Floor, Senapati Bapat Marg, Dadar (W), Mumbai, India – 400028 Tel: 30266000 / 22694322 www.keynotecapitals.com
- 4. NSE Futures Intra-day Technical Levels For - 26/11/12 F&O Expiry 29/11/12 Close (Fut) Intra Day Pivot Resistance Support Company 23/11/12 Trend * Point R1 R2 R3 S1 S2 S3 RELIANCE 774.05 UP 773 778 782 792 769 763 754 RELINFRA 457.45 DOWN 458 463 469 481 452 446 435 RENUKA 29.35 DOWN 30 30 30 31 29 29 28 RPOWER 90.40 UP 90 92 94 97 89 87 84 SAIL 78.20 UP 78 79 79 80 78 77 77 SBIN 2096.20 DOWN 2096 2114 2132 2168 2078 2061 2025 SESAGOA 166.30 DOWN 166 168 170 174 164 162 159 SIEMENS 658.65 UP 658 669 679 699 648 638 618 SINTEX 58.40 DOWN 59 59 60 62 58 57 55 SRTRANSFIN 632.70 UP 631 636 639 648 627 622 614 STER 96.50 DOWN 97 98 99 101 95 94 92 SUNPHARMA 705.70 UP 702 712 717 733 696 687 671 SUNTV 385.15 UP 382 392 400 418 374 364 346 SUZLON 14.95 DOWN 15 15 16 16 15 15 14 SYNDIBANK 119.85 UP 119 121 122 125 118 116 113 TATACHEM 313.85 UP 314 315 316 319 313 311 309 TATACOMM 231.65 UP 231 234 236 241 229 226 221 TATAGLOBAL 163.95 UP 163 166 167 172 161 159 155 TATAMOTORS 261.60 UP 260 264 267 274 257 253 247 TATAMTRDVR 158.75 UP 158 160 162 165 157 155 152 TATAPOWER 102.15 UP 102 103 104 106 101 99 97 TATASTEEL 365.30 DOWN 365 369 373 380 362 358 351 TCS 1289.75 UP 1286 1297 1303 1321 1279 1268 1251 TECHM 907.60 DOWN 910 918 928 946 900 892 874 TITAN 296.85 DOWN 297 299 302 306 295 292 288 UCOBANK 71.35 UP 71 72 72 73 71 70 69 ULTRACEMCO 1896.85 UP 1897 1908 1919 1941 1886 1875 1853 UNIONBANK 227.55 DOWN 229 232 236 244 224 221 214 UNIPHOS 111.15 UP 111 112 113 114 110 110 108 UNITECH 26.55 UP 27 27 28 29 26 25 24 VIJAYABANK 54.85 UP 55 55 56 57 54 54 53 VOLTAS 102.50 DOWN 103 104 106 108 101 100 98 WELCORP 103.10 DOWN 103 104 106 108 102 101 99 WIPRO 368.25 DOWN 370 375 381 391 364 360 349 Keynote Capitals Ltd. The Ruby, 9th Floor, Senapati Bapat Marg, Dadar (W), Mumbai, India – 400028 Tel: 30266000 / 22694322 www.keynotecapitals.com
- 5. NSE Futures Intra-day Technical Levels For - 26/11/12 F&O Expiry 29/11/12 Close (Fut) Intra Day Pivot Resistance Support Company 23/11/12 Trend * Point R1 R2 R3 S1 S2 S3 YESBANK 421.00 UP 420 423 426 431 418 415 409 ZEEL 204.70 UP 202 209 213 223 198 192 181 Sanjay Bhatia (AVP – Technical Research), Email Id sanjay@keynotecapitals.net Pivot Point: Intra- Day Trading Tool. - The key to the use of this tool is the use of Stop Loss Intra Day Trend: It is valid only till the point where Price trades above Pivot Point. For Eg. “UP” would be valid till Price remains above Pivot Point. It would become “DOWN” in event Price trades below Pivot Point. Pivot Point (PP): This is a trigger point for Intra Day Buy / Sell based on the price range of the previous day. R1: Resistance 1: 1st Resistance level over Pivot Point, R2: Resistance 2: Next Resistance level after R1. R3: Resistance 3: Next Resistance level after R2. S1: Support 1: 1st Support level after Pivot Point, S2: Support 2: Next Support level after S1. S3: Support 3: Next Support level after S2. Note: As per this tool, the trader should take BUY position just above the Pivot Point and keep the Pivot Point level as stop loss and the first target would be R1 level (Resistance 1). If R1 is crossed then R2 (Resistance 2) becomes the next target with the stop loss placed at R1 level. If R2 is crossed then R3 (Resistance 3) becomes the next target with the stop loss placed at R2 level. Similarly if price goes below the Pivot Point the trader should take a SELL position and keep the Pivot Point level as the stop loss and the first target would be S1 level (Support 1). If S1 level is breached then S2 level (Support 2) becomes the next target with the stop loss placed at S1 level. If S2 level is breached then S3 level (Support 3) becomes the next target with the stop loss placed at S2 level. Disclaimer: This document is not for public distribution and has been furnished to you solely for your information and must not be reproduced or redistributed to any other person. Persons into whose possession this document may come are required to observe these restrictions. This material is for the personal information of the authorized recipient, and we are not soliciting any action based upon it. This report is not to be construed as an offer to sell or the solicitation of an offer to buy any security in any jurisdiction where such an offer or solicitation would be illegal. It is for the general information of clients of Keynote Capitals Ltd. It does not constitute a personal recommendation or take into account the particular investment objectives, financial situations, or needs of individual clients. We have reviewed the report and in so far as it includes current or historical information, it is believed to be reliable though its accuracy or completeness cannot be guaranteed. Neither Keynote Capitals Ltd., nor any person connected with it, accepts any liability arising from the use of this document. The recipients of this material should rely on their own investigations and take their own professional advice. Price and value of the investments referred to in this material may go up or down. Past performance is not a guide for future performance. Certain transactions including those involving futures, options and other derivatives as well as non-investment grade securities involve substantial risk and are not suitable for all investors. Reports based on technical analysis centers on studying charts of a stock’s price movement and trading volume, as opposed to focusing on a company’s fundamentals and as such, may not match with a report on a company’s fundamentals. Opinions expressed are our current opinions as of the date appearing on this material only. While we endeavor to update on a reasonable basis the information discussed in this material, there may be regulatory, compliance or other reasons that prevent us from doing so. Prospective investors and others are cautioned that any forward looking statements are not predictions and may be subject to change without notice. Our proprietary trading and investment businesses may make investment decisions that are inconsistent with the recommendations expressed herein. We and our affiliates, officers, directors, and employees world wide may: (a) from time to time have long or short positions in and buy or sell the securities thereof of company (ies) mentioned herein or (b) be engaged in any other transaction involving such securities and earn brokerage or other compensation or act as a market maker in the financial instruments of the company (ies) discussed herein or act as advisor or lender/ borrower to such company (ies) or have other potential conflict of interest with respect to any recommendation and related information and opinions. The analyst for this report certifies that all of the views expressed in this report accurately reflect his or her personal views about the subject company or companies and its or their securities, and no part of his or her compensation was, is or will be, directly or indirectly related to specific recommendations or views expressed in this report. No part of this material may be duplicated in any form and/or redistributed without Keynote Capitals Ltd’s., prior written consent. Keynote Capitals Ltd. The Ruby, 9th Floor, Senapati Bapat Marg, Dadar (W), Mumbai, India – 400028 Tel: 30266000 / 22694322 www.keynotecapitals.com