Keynote technicals commodity intraday levels for 041012
•
0 gefällt mir•138 views


Empfohlen
Empfohlen
Weitere ähnliche Inhalte
Was ist angesagt?
Was ist angesagt? (20)
Andere mochten auch
Andere mochten auch (17)
Ähnlich wie Keynote technicals commodity intraday levels for 041012
Ähnlich wie Keynote technicals commodity intraday levels for 041012 (13)
Mehr von Keynote Capitals Ltd.
Mehr von Keynote Capitals Ltd. (20)
Kürzlich hochgeladen
Kürzlich hochgeladen (20)
Keynote technicals commodity intraday levels for 041012
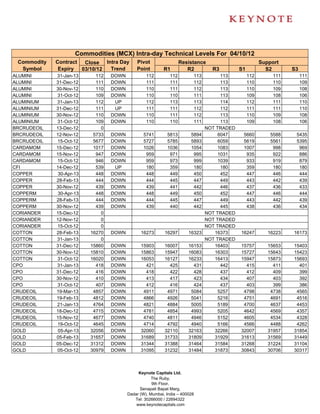
- 1. Commodities (MCX) Intra-day Technical Levels For 04/10/12 _ Commodity Contract Close Intra Day Pivot Resistance Support Symbol Expiry 03/10/12 Trend Point R1 R2 R3 S1 S2 S3 ALUMINI 31-Jan-13 112 DOWN 112 112 113 113 112 111 111 ALUMINI 31-Dec-12 111 DOWN 111 111 112 113 110 110 109 ALUMINI 30-Nov-12 110 DOWN 110 111 112 113 110 109 108 ALUMINI 31-Oct-12 109 DOWN 110 110 111 113 109 108 106 ALUMINIUM 31-Jan-13 112 UP 112 113 113 114 112 111 110 ALUMINIUM 31-Dec-12 111 UP 111 111 112 112 111 111 110 ALUMINIUM 30-Nov-12 110 DOWN 110 111 112 113 110 109 108 ALUMINIUM 31-Oct-12 109 DOWN 110 110 111 113 109 108 106 BRCRUDEOIL 13-Dec-12 0 NOT TRADED BRCRUDEOIL 12-Nov-12 5733 DOWN 5741 5813 5894 6047 5660 5588 5435 BRCRUDEOIL 15-Oct-12 5677 DOWN 5727 5785 5893 6059 5619 5561 5395 CARDAMOM 15-Dec-12 1017 DOWN 1026 1036 1054 1083 1007 998 969 CARDAMOM 15-Nov-12 947 DOWN 959 971 995 1031 935 922 886 CARDAMOM 15-Oct-12 946 DOWN 959 973 999 1039 933 919 879 CFI 14-Dec-12 539 UP 180 359 180 180 359 180 180 COPPER 30-Apr-13 448 DOWN 448 449 450 452 447 446 444 COPPER 28-Feb-13 444 DOWN 444 445 447 449 443 442 439 COPPER 30-Nov-12 439 DOWN 439 441 442 446 437 436 433 COPPERM 30-Apr-13 448 DOWN 448 449 450 452 447 446 444 COPPERM 28-Feb-13 444 DOWN 444 445 447 449 443 442 439 COPPERM 30-Nov-12 439 DOWN 439 440 442 445 438 436 434 CORIANDER 15-Dec-12 0 NOT TRADED CORIANDER 12-Nov-12 0 NOT TRADED CORIANDER 15-Oct-12 0 NOT TRADED COTTON 28-Feb-13 16270 DOWN 16273 16297 16323 16373 16247 16223 16173 COTTON 31-Jan-13 0 NOT TRADED COTTON 31-Dec-12 15860 DOWN 15903 16007 16153 16403 15757 15653 15403 COTTON 30-Nov-12 15810 DOWN 15863 15947 16083 16303 15727 15643 15423 COTTON 31-Oct-12 16020 DOWN 16053 16127 16233 16413 15947 15873 15693 CPO 31-Jan-13 418 DOWN 421 425 431 442 415 411 401 CPO 31-Dec-12 416 DOWN 418 422 428 437 412 409 399 CPO 30-Nov-12 410 DOWN 413 417 423 434 407 403 392 CPO 31-Oct-12 407 DOWN 412 416 424 437 403 399 386 CRUDEOIL 19-Mar-13 4857 DOWN 4911 4971 5084 5257 4798 4738 4565 CRUDEOIL 19-Feb-13 4812 DOWN 4866 4926 5041 5216 4751 4691 4516 CRUDEOIL 21-Jan-13 4764 DOWN 4821 4884 5005 5189 4700 4637 4453 CRUDEOIL 18-Dec-12 4715 DOWN 4781 4854 4993 5205 4642 4569 4357 CRUDEOIL 15-Nov-12 4677 DOWN 4740 4811 4946 5152 4605 4534 4328 CRUDEOIL 19-Oct-12 4645 DOWN 4714 4792 4940 5166 4566 4488 4262 GOLD 05-Apr-13 32056 DOWN 32060 32110 32163 32266 32007 31957 31854 GOLD 05-Feb-13 31657 DOWN 31689 31733 31809 31929 31613 31569 31449 GOLD 05-Dec-12 31312 DOWN 31344 31388 31464 31584 31268 31224 31104 GOLD 05-Oct-12 30979 DOWN 31095 31232 31484 31873 30843 30706 30317 Keynote Capitals Ltd. The Ruby, 9th Floor, Senapati Bapat Marg, Dadar (W), Mumbai, India – 400028 Tel: 30266000 / 22694322 www.keynotecapitals.com
- 2. Commodities (MCX) Intra-day Technical Levels For 04/10/12 _ Commodity Contract Close Intra Day Pivot Resistance Support Symbol Expiry 03/10/12 Trend Point R1 R2 R3 S1 S2 S3 GOLDGUINEA 31-Dec-12 25251 UP 25250 25301 25350 25450 25201 25150 25050 GOLDGUINEA 30-Nov-12 25150 DOWN 25166 25194 25239 25312 25121 25093 25020 GOLDGUINEA 31-Oct-12 25113 DOWN 25132 25160 25207 25282 25085 25057 24982 GOLDM 05-Dec-12 31329 DOWN 31360 31407 31485 31610 31282 31235 31110 GOLDM 05-Nov-12 31191 DOWN 31223 31267 31342 31461 31148 31104 30985 GOLDM 05-Oct-12 30983 DOWN 31015 31066 31150 31285 30931 30880 30745 GOLDPETAL 31-Dec-12 3169 DOWN 3171 3174 3180 3189 3165 3162 3153 GOLDPETAL 30-Nov-12 3162 DOWN 3164 3167 3173 3182 3158 3155 3146 GOLDPETAL 31-Oct-12 3163 DOWN 3165 3169 3176 3187 3158 3154 3143 GOLDPTLDEL 31-Dec-12 3357 DOWN 3358 3362 3367 3376 3353 3349 3340 GOLDPTLDEL 30-Nov-12 3308 DOWN 3310 3318 3327 3344 3301 3293 3276 GOLDPTLDEL 31-Oct-12 3306 DOWN 3306 3314 3322 3338 3298 3290 3274 IRONORE 30-Nov-12 0 NOT TRADED IRONORE 31-Oct-12 0 NOT TRADED KAPAS 30-Apr-13 909 DOWN 912 918 927 941 903 897 882 KAPAS 30-Mar-13 886 DOWN 890 895 903 916 882 877 864 KAPASKHALI 30-Apr-13 1438 UP 1435 1443 1449 1463 1429 1421 1407 KAPASKHALI 30-Mar-13 1435 DOWN 1436 1439 1443 1451 1432 1428 1421 KAPASKHALI 28-Feb-13 1417 UP 1414 1427 1438 1461 1404 1391 1367 KAPASKHALI 31-Jan-13 1398 UP 1395 1408 1419 1443 1384 1371 1347 KAPASKHALI 31-Dec-12 1386 UP 1381 1399 1412 1443 1368 1350 1319 LEAD 31-Jan-13 120 UP 120 121 121 122 120 119 118 LEAD 31-Dec-12 120 UP 120 121 121 122 120 119 118 LEAD 30-Nov-12 120 DOWN 120 120 121 122 119 119 117 LEAD 31-Oct-12 120 DOWN 120 120 121 122 119 119 118 LEADMINI 31-Jan-13 120 UP 120 120 121 122 119 119 118 LEADMINI 31-Dec-12 120 UP 120 120 121 122 119 119 118 LEADMINI 30-Nov-12 120 DOWN 120 120 121 122 119 119 117 LEADMINI 31-Oct-12 120 DOWN 120 120 121 122 119 119 118 MAIZE 20-Dec-12 1358 UP 453 905 453 453 905 453 453 MAIZE 20-Nov-12 1406 UP 469 937 469 469 937 469 469 MAIZE 19-Oct-12 1410 UP 470 940 470 470 940 470 470 MENTHAOIL 31-Jan-13 1170 DOWN 1170 1185 1201 1232 1154 1139 1108 MENTHAOIL 31-Dec-12 1161 UP 1160 1175 1189 1217 1146 1131 1103 MENTHAOIL 30-Nov-12 1151 UP 1146 1167 1183 1221 1130 1109 1072 MENTHAOIL 31-Oct-12 1139 UP 1133 1155 1170 1208 1117 1095 1058 NATURALGAS 26-Dec-12 199 DOWN 201 204 210 218 196 193 184 NATURALGAS 27-Nov-12 191 DOWN 193 196 202 211 187 184 175 NATURALGAS 26-Oct-12 177 DOWN 179 183 189 198 173 170 160 NICKEL 31-Jan-13 993 DOWN 995 1000 1008 1020 988 983 971 NICKEL 31-Dec-12 985 DOWN 987 991 996 1004 982 979 970 NICKEL 30-Nov-12 979 DOWN 981 985 991 1001 975 971 961 NICKEL 31-Oct-12 972 DOWN 976 982 991 1005 967 961 947 Keynote Capitals Ltd. The Ruby, 9th Floor, Senapati Bapat Marg, Dadar (W), Mumbai, India – 400028 Tel: 30266000 / 22694322 www.keynotecapitals.com
- 3. Commodities (MCX) Intra-day Technical Levels For 04/10/12 _ Commodity Contract Close Intra Day Pivot Resistance Support Symbol Expiry 03/10/12 Trend Point R1 R2 R3 S1 S2 S3 NICKELM 31-Jan-13 993 DOWN 993 996 1000 1006 990 987 980 NICKELM 31-Dec-12 986 DOWN 987 991 996 1006 982 978 969 NICKELM 30-Nov-12 979 DOWN 981 985 991 1001 975 971 962 NICKELM 31-Oct-12 973 DOWN 976 981 990 1004 967 962 947 POTATO 15-Apr-13 676 DOWN 677 680 684 692 673 670 662 POTATO 15-Mar-13 707 DOWN 709 713 719 729 703 699 689 POTATO 15-Oct-12 904 DOWN 909 915 926 943 898 892 875 POTATOTRWR 15-Oct-12 891 DOWN 894 900 910 926 884 878 862 REFSOYOIL 15-Dec-12 715 UP 238 477 238 238 477 238 238 REFSOYOIL 15-Nov-12 710 UP 237 473 237 237 473 237 237 REFSOYOIL 15-Oct-12 708 UP 236 472 236 236 472 236 236 SILVER 04-May-13 65750 UP 65698 65919 66087 66476 65530 65309 64920 SILVER 05-Mar-13 64027 DOWN 64156 64346 64664 65172 63838 63648 63140 SILVER 05-Dec-12 62318 DOWN 62481 62709 63101 63721 62089 61861 61241 SILVER1000 31-Dec-12 63433 UP 63386 64046 64658 65930 62774 62114 60842 SILVER1000 30-Nov-12 62506 DOWN 62521 62723 62939 63357 62305 62103 61685 SILVER1000 31-Oct-12 61889 DOWN 62064 62324 62760 63456 61628 61368 60672 SILVERM 30-Apr-13 65589 DOWN 66217 66896 68203 70189 64910 64231 62245 SILVERM 28-Feb-13 64060 DOWN 64213 64427 64793 65373 63847 63633 63053 SILVERM 30-Nov-12 62341 DOWN 62515 62756 63170 63825 62101 61860 61205 SILVERMIC 30-Apr-13 65601 DOWN 65784 66017 66434 67084 65367 65134 64484 SILVERMIC 28-Feb-13 64061 DOWN 64209 64418 64775 65341 63852 63643 63077 SILVERMIC 30-Nov-12 62343 DOWN 62513 62745 63146 63779 62112 61880 61247 SUGARMKOL 20-Dec-12 3555 UP 1185 2370 1185 1185 2370 1185 1185 SUGARMKOL 20-Nov-12 3631 UP 1210 2421 1210 1210 2421 1210 1210 SUGARMKOL 19-Oct-12 3546 UP 1182 2364 1182 1182 2364 1182 1182 WHEAT 20-Dec-12 1511 UP 504 1008 504 504 1008 504 504 WHEAT 20-Nov-12 1514 UP 505 1009 505 505 1009 505 505 WHEAT 19-Oct-12 1493 UP 498 995 498 498 995 498 498 ZINC 31-Jan-13 110 DOWN 111 112 113 115 110 109 107 ZINC 31-Dec-12 110 DOWN 110 110 111 112 109 109 108 ZINC 30-Nov-12 109 DOWN 109 110 110 112 108 108 107 ZINC 31-Oct-12 108 DOWN 109 109 110 112 107 107 105 Keynote Capitals Ltd. The Ruby, 9th Floor, Senapati Bapat Marg, Dadar (W), Mumbai, India – 400028 Tel: 30266000 / 22694322 www.keynotecapitals.com
- 4. Commodities (MCX) Intra-day Technical Levels For 04/10/12 _ Commodity Contract Close Intra Day Pivot Resistance Support Symbol Expiry 03/10/12 Trend Point R1 R2 R3 S1 S2 S3 ZINCMINI 31-Jan-13 111 DOWN 111 111 112 113 110 109 108 ZINCMINI 31-Dec-12 110 DOWN 110 110 111 112 109 109 108 ZINCMINI 30-Nov-12 109 DOWN 109 110 110 112 108 108 107 ZINCMINI 31-Oct-12 108 DOWN 109 109 110 112 107 107 105 Sanjay Bhatia (AVP – Technical Research), Email Id sanjay@keynotecapitals.net Disclaimer: This document is not for public distribution and has been furnished to you solely for your information and must not be reproduced or redistributed to any other person. Persons into whose possession this document may come are required to observe these restrictions. This material is for the personal information of the authorized recipient, and we are not soliciting any action based upon it. This report is not to be construed as an offer to sell or the solicitation of an offer to buy any security in any jurisdiction where such an offer or solicitation would be illegal. It is for the general information of clients of Keynote Capitals Ltd. It does not constitute a personal recommendation or take into account the particular investment objectives, financial situations, or needs of individual clients. We have reviewed the report, and in so far as it includes current or historical information, it is believed to be reliable though its accuracy or completeness cannot be guaranteed. Neither Keynote Capitals Ltd., nor any person connected with it, accepts any liability arising from the use of this document. The recipients of this material should rely on their own investigations and take their own professional advice. Price and value of the investments referred to in this material may go up or down. Past performance is not a guide for future performance. Certain transactions -including those involving futures, options and other derivatives as well as non-investment grade securities - involve substantial risk and are not suitable for all investors. Reports based on technical analysis centers on studying charts of a stock’s price movement and trading volume, as opposed to focusing on a company’s fundamentals and as such, may not match with a report on a company’s fundamentals. Opinions expressed are our current opinions as of the date appearing on this material only. While we endeavor to update on a reasonable basis the information discussed in this material, there may be regulatory, compliance, or other reasons that prevent us from doing so. Prospective investors and others are cautioned that any forward-looking statements are not predictions and may be subject to change without notice. Our proprietary trading and investment businesses may make investment decisions that are inconsistent with the recommendations expressed herein. We and our affiliates, officers, directors, and employees world wide may: (a) from time to time, have long or short positions in, and buy or sell the securities thereof, of company (ies) mentioned herein or (b) be engaged in any other transaction involving such securities and earn brokerage or other compensation or act as a market maker in the financial instruments of the company (ies) discussed herein or act as advisor or lender / borrower to such company (ies) or have other potential conflict of interest with respect to any recommendation and related information and opinions. The analyst for this report certifies that all of the views expressed in this report accurately reflect his or her personal views about the subject company or companies and its or their securities, and no part of his or her compensation was, is or will be, directly or indirectly related to specific recommendations or views expressed in this report. No part of this material may be duplicated in any form and/or redistributed without Keynote Capitals Ltd’s., prior written consent. Pivot Point: Intra- Day Trading Tool. - The key to the use of this tool is the use of Stop Loss Intra Day Trend: It is valid only till the point where Price trades above Pivot Point. For Eg. “UP” would be valid till Price remains above Pivot Point. It would become “DOWN” in event Price trades below Pivot Point. Pivot Point (PP): This is a trigger point for Intra Day Buy / Sell based on the price range of the previous day. R1: Resistance 1: 1st Resistance level over Pivot Point, R2: Resistance 2: Next Resistance level after R1. R3: Resistance 3: Next Resistance level after R2. S1: Support 1: 1st Support level after Pivot Point, S2: Support 2: Next Support level after S1. S3: Support 3: Next Support level after S2. Note: As per this tool, the trader should take BUY position just above the Pivot Point and keep the Pivot Point level as stop loss and the first target would be R1 level (Resistance 1). If R1 is crossed then R2 (Resistance 2) becomes the next target with the stop loss placed at R1 level. If R2 is crossed then R3 (Resistance 3) becomes the next target with the stop loss placed at R2 level. Similarly if price goes below the Pivot Point the trader should take a SELL position and keep the Pivot Point level as the stop loss and the first target would be S1 level (Support 1). If S1 level is breached then S2 level (Support 2) becomes the next target with the stop loss placed at S1 level. If S2 level is breached then S3 level (Support 3) becomes the next target with the stop loss placed at S2 level. Keynote Capitals Ltd. The Ruby, 9th Floor, Senapati Bapat Marg, Dadar (W), Mumbai, India – 400028 Tel: 30266000 / 22694322 www.keynotecapitals.com