SlideShare ist ein Scribd-Unternehmen logo
1 von 16
Downloaden Sie, um offline zu lesen
The Transition of the Transistor to Carbon Nanotubes
Kevin Kuwata
Department of Physics, Occidental College
Monday April 13, 2015
Abstract
This paper look at the properties of traditional transistors to make a paralleled comparison
to carbon nanotube transistors. Starting with the basic components of the transistor, reviewing in
detail the various materials which a transistor consists and transition towards a qualitative overview
of carbon nanotube transistors, the future.
Introduction
In 1925, Julius Lilienfeld filed a patent describing an electronic device that would replace the
triode . This device was the field effect transistor, and not only did it revolutionize electronics, it was1
a necessary stepping stone towards integrated circuits.
Transistors allow an external circuit to be controlled electronically just as a mechanical switch
does. This allows for the implementation of switches where a mechanical switch would not
necessarily fit. There could be a requirement to work with high voltage supply; a transistor could be
used to isolate the high voltage system from the experimenter. Transistors find themselves in a wide
range of applications from intuitive switching circuits or the logic gates of integrated circuits.
The structure of this paper is as follows: starting with an introduction of semiconductors in
the vocabulary of band theory of solids, then exploration of the interaction of doped
semiconductors, and finally a discussion on the history of point contact transistors to metal oxide
field effect transistors (MOSFET) leading into the future of transistors: carbon nanotube transistors.
Semiconductors
In order to start talking about transistors, we need to discuss at length the different
components which make up a transistor. Starting at the most basic level, we must first discuss a 

semiconductor and how it is characterized in the sense of the band structure of a solid. The first
type of material we will consider is the conductor. A conductor is characterized by its ability to easily
conduct electricity. This conductivity arrises from the overlapping band energy between the
conduction band and the valence band of a metal. In Figure 1, a band energy diagram compares the
band energies for a conductor, insulator, and semiconductor, respectively .2
The two types of bands denoted by the labels ‘Allowed’ and ‘Forbidden’ simply note where
additional electrons can reside. If an excited electron is found with the correct energy it can be
allowed to transition into the higher band. An insulator is characterized by the second region, or the
forbidden band which is too large for most of the electrons to cross solely due to room
temperature. However, an insulator at a very high temperature could have more electrons with
energies sufficient enough to jump the forbidden gap and will therefore conduct slightly. Finally, a
semiconductor is a material with a forbidden band which is just large enough so that the electrons
cannot jump on their own, but with the addition of some energy, they can easily clear the gap.
In a process called doping, the material composition can be changed to decrease the
forbidden band’s width. Doping is process of taking a pure semiconducting sample and injecting a
dopant. A dopant is simply an impurity which alters the electrical or optical properties of a material
by either accepting or donating an electron. Introducing a dopant allows additional energy levels
Figure 1. Energy diagram for conductors, insulators, and semiconductors. Note the forbidden energy band thickness
in the conductor (Left) compared to that of the semiconductor (Right)2.
2
within the original forbidden band. If the additional energy levels are filled and are close to the
conduction band (Figure 2a) electrons will be able to clear the gap with minimal additional energy.
This type of semiconductor doping is called an n-type semiconductor, n for the negative charge
carriers. Because the impurity is localized, the hole that is left behind after excitation is remains in
the forbidden band and only the electron (now free in the conduction band) can contribute towards
current.
For the p-type semiconductor, if the additional energy levels are empty and closer to the
valence band the electrons can jump from the valence band to the, now available, empty energy level
in the forbidden band. The electrons are now forced to stay within the energy band, while the holes
are free to move in the valence band and contribute towards the semiconductors current.
Starting with a pure semiconductor, silicon for instance, and implanting impurities into the
structure can produce additional electrons or holes in the material. A hole, is simply the absence of
an electron, but can be thought of as a positive charge. The decision of the type of impurity to add
is determined by several factors, but the number of valence electrons is the fundamental reason in
choosing a particular dopant. Continuing the case of silicon, adding an element with one more
Figure 2. (a) An energy band diagram for a n-type semiconductor with the additional filled electron band near the
valence band. (b) The energy band diagram for a p-type semiconductor. Notice the location of the empty energy band
near the valence band2.
a. b.
3
valence electron than silicon will result in a material with excess electrons. Thus, adding antimony to
silicon will introduce an additional electron which is free to move, therefore making an n-type
semiconductor.3
Again returning to the case of silicon, adding an impurity with one less electron than silicon, such as
boron, will result in a neighboring atom losing an electron and producing a hole and a p-type
semiconductor .4
Diodes
The next major component of a transistor is the diode. A diode is created when different
semiconductor materials are stacked on top of each other. The most basic case, is a NP diode
(Figure 4a) can be analyzed at length to gain insight. When n and p type materials are stacked,
diffusion occurs because of the different concentrations of charge carriers within the materials.
Figure 3. (a) Antimony is added to silicon, introducing an additional electron and producing an n-type semiconductor..
(b) A p-type semiconductor where boron was added to silicon and because boron has one less valence electron than
silicon, it steals an electron from a neighboring atom, creating a hole4.
a. b.
4
The energy required to transition from the conduction band to the valence band is provided
by the system’s environment. The temperature of the room provides the thermal energy to allow the
electrons to transition energy bands. Figure 4a, shows the energy required for the electrons to
transfer from the n material to the p material. The density of particles at a given temperature T with
energy state is given by the Fermi-Dirac equation :5
where is the chemical energy and k is Botlzman’s constant. At absolute zero is defined as the
Fermi energy level.
The only electrons which jump the forbidden energy level are the ones with which have
energy greater than where is the lowest energy of the conduction band and the is
the additional energy required for the electrons to flow from the n material to the p material. In
order to find the number of electrons with acceptable energy we need to integrate1:
ε
Figure 4. (a) Simply the flow of electrons due to diffusion and the additional energy required to flow from the n
material to the p material. (b) The flow of electrons if the system was reversed biased. This is used to calculated the
reverse current. (c) The energy required to transition from the n-type material to p-type material is reduced compared
to unbaked or reverse bias scenario.
a. b. c.
(1),ni (εi ) =
1
e(εi −µ)/kT
+1
µ µ
Eo +∆ E E0 ∆ E
(2). .N = ni (εi )dε =
1
e(εi −µ)/kT
+1E0 +´∆ E
∞
∫E0 +´∆ E
∞
∫ dε = Ce−∆ E/kT
5
We have collected all the constants into C to simplify the presentation. We know the flow of
electrons is proportional to the number of electrons with acceptable energy so we model it as such1:
Because there is no bias and the system is in thermal equilibrium the net flow is zero, meaning that
the flow of electrons is equal or
If an electric bias is applied to the system a net flow occurs depending on the orientation of the
applied bias.
In the reverse bias case (Figure 4b) the net flow of electrons is:
The energy required to transition from the valence band to the conduction band is increased due to
the opposing force from the reverse electric potential (Figure 4b). This increase in energy is
reflected in the flow rate for becoming:
while the flow from the p to the n type material remains unchanged equation 4. The increase in
energy for f1 occurs because the electrons are opposing the electric bias and therefore require
additional energy to overcome it. At room temperature we can approximate so that our
net flow under reverse bias is actually:
(3)
(4)
,
and
.
f1 = Ce−∆ E/KT
f2 = Ce−∆ E/KT
(5).f1 = f2
(6)fnet = f1 − f2 = Ce−∆ E/kT
e−eV0 /kT
−1( )
eV0
f1
(7),f1 = Ce−(∆ E+eVo )/kT
eeV0 /kT
→ 0
(8).fnet = Ce∆ E/kT
0
e
eV0/kT −1
⎛
⎝⎜
⎞
⎠⎟ = −Ce∆ E/kT
6
In the forward bias case (Figure 4c) the electrons are now pulled from the material, as well as
the holes, thus decreasing the energy the electrons required in order to contribute to current. The
flow f1 due to the forward bias is now:
The flow f2 is unaffected by the forward bias thus the final net flow under forward bias is:
Now we have an equation for flowing electrons, but we know that change in charge over change in
time, at a given point is the current through that point. We can conclude that the current for
a PN diode can be model as the net flow between the two materials.
here is the collection of all the constants from equation (10) and represents the reverse saturation
current. The forward bias voltage applied, is now defined as the diode voltage.
The diode has a reverse saturation current which is significantly smaller than the forward current
and is greatly influenced by temperature, so at room temperature this term is approximated to be
zero. If we were to graph equation (11) we could get an IV characteristic curve for our newly created
diode (Figure 5).6
(9)f1 = Ce−(∆ E+eV0 )/kT
(10)fnet = f1 − f2 = −Ce−∆ E/kT
(e−eV0 /kT
−1)
dq / dt
(11)I = I0 (eeVd /kT
−1)
I0
V0 Vd
Figure 5: (a)The IV curve for a diode. Notice the saturated reverse current which occurs for negative values of
voltages. (b) A simple diode circuit used in load line analysis to determine the operating voltage Vd of the diode.6
a. b.
7
The negative current of the diode in Figure 5a is the reverse saturated current and is the same value
as . Note that the value for is not constant and is dependent with temperature. If we perform
a Kirchoff Voltage Loop around the circuit in Figure 5b, we get the following equation:
Substituting equation (11) for I into equation (12) we get a transcendental equation:
Equation (14) cannot be solved analytically but is solved most easily with the graphical solution
shown below (Figure 6).7
From Figure 6, plugging in values for constants and room temperature and assuming the diode has a
voltage drop Vd of 0.6 volts, the intersection of the lines dictates the current through the diode .8
Now that the diode has been modeled in a consistent and quantitative manner, we are able to tackle
the different types of transistors and adequately describe their operation.
I0 I0
(12)V0 − IRL −Vd = 0
(13)
(14)
,
and
.
V0 − I0 (eeVd /kT
−1)⎡⎣ ⎤⎦RL −Vd = 0
I =
V0 −Vd
RL
= I0 eeVd /kT
−1( )
Figure 6. Load line analysis for the simple circuit in Figure 5b resulting in the diode voltage, therefore allowing us to
determine the current through the diode. The intersection of the two lines indicates the diode’s voltage7.
8
Various Types of Transistors, Chronological
Point Contact Transistor
The very first type of transistor introduced was discovered in 1947 at Bell Labs (Figure 7a). It9
utilized a germanium slab, an external power supply to provide an electric potential over the
germanium, and two gold leads.
With this device, the research lab was able to observe the conduction of electrons between
two contacts separated in space controlled by an external electric potential. It was found applying a
voltage to the emitter side of the device would result in a larger voltage on the collector of the
device. Looking at the device in its simplified circuit form, Figure 8, we can analyze the flow of
electrons .10
Figure 7. (a)The first transistor created at Bell Labs in 1947 using a germanium body and gold terminal contacts. (b) A
schematic overview of the point contact transistor. Note the PN type semiconductor beneath the gold contacts. The
electric field applied to the base of the germanium creates free electrons which contribute to current.9
a. b.
9
As the electric potential between the emitter contact and the germanium base increases, so does the
electric field. When the field becomes strong enough electrons are pulled from the germanium n-
doped material leaving behind holes; holes are then attracted towards the collector contact. The
collector current creates an electric field within the germanium block which allows the flow of
electrons towards the emitter contact.
Metal Oxide Semiconductor Field Effect Transistor
While experimenting with the point contact transistor, Shockely of the Bell Lab group,
found that allowing minority carriers to flow from the emitter through the base material to the
collector lead, the amplification of the signal could be increased . This discovery lead to the11
development of the Field Effect Transistor (FET) and eventually to the Metal Oxide Semiconductor
Field Effect Transistor (MOSFET). The FET utilizes an electric field created by a gate voltage over a
pn type material. The MOSFET differs from a FET by a insulating oxide layer between the gate
terminal and the body of the transistor. This oxide allows for a better forward current with a lower
gate voltage. The MOSFET transistor consists of 4 terminals, shown schematically in below12
Figure 8. Simple circuit representation of a point contact transistor. Modeling the
first transistor.10
10
(Figure 9).The four terminals indicated are, base (substrate), gate, drain (emitter), and source
(collector).
A MOSFET operating in the depletion mode has a drain current that is proportional to the
voltage applied to the grate: as the gate potential increases, the holes in the p material are attracted
towards the gate. As this continues, the electrons in the n-type material of the MOSFET start to
become attracted towards the gate. Near the region of the gate, the holes and electrons recombine
leaving a decreased concentration of free charge carriers. As the concentration of free charge
carriers decrease, the ability for current to conduct decreases too. Thus, the current at the drain
decreases as the electric potential on the gate of the MOSFET increases.
Because the current through the drain is dependent on the gate voltages VGS we get a family
of IV curves. Below is a typical IV curve for a p-type MOSFET operating in depletion mode11.
Depletion mode occurs when the gate voltage creates and electric field which attracts the free charge
carriers within the semiconductor. When the electric field attracts the majority of available charge
carriers, the current between the drain and the source is also reduced. This is because the number of
Figure 9. Schematic of a depletion mode p type MOSFET. This is a MOSFET which is normally ON with zero gate
voltage, VGS. In this figure, ID is the drain current to the D drain, G is the gate voltage, S is the source voltage and SS
is the voltage of the body of the MOSFET and usually set at the lowest potential connected to the MOSFET.12
11
available charge carriers is simply less. This type of mode of operation is characterized by an ON
state when the MOSFET has zero voltage applied to the gate voltage.
Enhancement mode, is characterized by the exact opposite application of the gate voltage.
In enhancement mode, the transistor requires that a voltage be applied to the gate of the transistor
in order for it to conduct forward current. As the gate voltage increases so does the drain current.
This is due to the fact that the charge carriers are drawn into the charge carriers are attracted by the
gate voltage and therefore contribute toward current between the drain and the source.
Notice that in depletion mode operation of a p-type MOSFET, applying more gate voltage
impedes the flow of current similar to the effect of squeezing a garden hose. The more you squeeze
the less water will flow. The current actually decreases with the increase of absolute value of the
voltage. This is due to the fact that the MOSFET is in depletion mode, requiring a reverse bias on
the gate. This reverse bias entails a higher voltage is actually more negative, and an increase in
voltage results in a decrease voltage value.
12
Figure 10. A IV characteristic curve for a p-type MOSFET. In the depletion mode of
operation the MOSFET acts as a garden hose. More voltage applied to the gate
restricts more current through the transistor. The current through the drain appears to
be decreasing with a decrease in gate voltage. This is due to the fact that the device is
hooked up with the leads attached in reverse bias.11
Carbon Nanotube Transistors
In 1965, Gordon E. Moore observed the number of transistors packed into an integrated
circuit doubles about every two years. This exponential advancement in technology cannot be
sustained forever and will eventually halt. As materials
become scaled smaller we approach physical limits of
the materials. New materials, such as the carbon
nanotube, are required to break these physical limits.
In the search to scale transistors down, in hopes to
achieve better efficiency and ON-OFF switching
speed, carbon nanotubes are investigated. A proof of
concept has been modeled and studied for the use of
carbon nanotubes inside transistors. Several groups
have successfully demonstrated the creation of logic
circuits with the implementation of carbon nanotube transistors . Researchers at the University13 14
of Southern California have successfully demonstrated a carbon nanotube transistor that emulates
the operation of a p-type MOSFET in depletion mode12.
Due to the difficulty in placement of carbon nanotubes, a process called chemical-vapor-
decomposition was utilized to grow the nanotubes. The first step in the process is depositing the
growth medium in which the carbon nanotube can start growing. The research group used catalytic
nanoscale iron particles to start the growth of the carbon nanotube on the Silicon substrate. Finally
the source and drain contacts are attached over the ends of the carbon nanotube.
The results of this process are promising, as the MOSFET transistor was successfully
modeled using carbon nanotube transistors. The IV curve for the p type MOSFET is shown in
Figure 12. Comparing the plot from Figure 12 and that of Figure 10 we can see a strong similarity
between the two devices, despite the fundamental difference in device components.
13
Figure 11. (a) Schematic of the carbon nanotube transistor.
The source is labeled S and the drain is labeled D. The
carbon nanotube connects the two terminals. (b) An atomic
force microscopy image of the appraise in (a) with the
carbon nanotube slightly visible (indicated by the arrow).
a.
b.
Due to the carbon nanotube’s poor reliability in oxygen and the difficulty of nanotube15
placement further understanding is required before commercialization. To compensate for the
carbon nanotube being exposed to air, back gated carbon nanotube transistors are being considered.
Interestingly enough, the gate length of a carbon nanotube was found to not affect the current
flowing through the transistor . In addition better understanding of the contacts and the carbon16
nanotube is required to gain insight on the effect of the work functions of the carbon nanotube to
the terminal contact used.
Conclusion
The carbon nanotube transistor was not possible without the crucial research performed at
Bell Labs resulting in the worlds first transistor. Then with better understanding of semiconductors
and their ability to be modified by a dopant, the Field Effect Transistor was born. This device
Figure 12. The IV curve for a p-type field effect transistor utilizing carbon nanotube operating in depletion mode.
Note the current to the drain increases as the voltage becomes more negative12
14
provided better control over the drain current by utilizing an electric field to control the charge
carriers which contribute to the drain current.
A carbon nanotube has been implanted inside of a field effect transistor to replicate the
electronic capabilities of a basic transistor. Although the development of logic circuits derived from
carbon nanotube transistors has already been realized, significant work is still required to understand
the effect of the metal leads’ work function and the effect on the transistors ability to conduct. The
carbon nanotube transistors also need to become more durable with minimal additional materials.
Just as triodes were phased out by the transistor popularized by its low power consumption and
relatively size , the MOSFET will become obsolete when the carbon nanotube transistor is scaled
further.

15
References
History of the transistor. (2015, April 2). In Wikipedia, the free encyclopedia. Retrieved from1
http://en.wikipedia.org/w/index.php?title=History_of_the_transistor&oldid=654696451
Eggleston, D. (2011). Basic Electronics for Scientists and Engineers. Cambridge University Press.2
Georgia State University. (n.d.). Atimony Valence Shell. Retrieved from http://hyperphysics.phy-3
astr.gsu.edu/hbase/solids/dope.html
Georgia State University. (n.d.). Boron Valence Shell. Retrieved from http://hyperphysics.phy-4
astr.gsu.edu/hbase/solids/dope.html
Shroeder, D. (1999). An Introduction to Thermal Physics (1st ed.). Addison-Wesley.5
Diode IV Curve. (n.d.). Retrieved from http://cnx.org/resources/6
dc6ed4580a0be64d1a922eff1eb355dc/2_42.png
Diode IV Characteristic Curve Load Line Analysis. (n.d.). Retrieved from http://7
upload.wikimedia.org/wikipedia/en/thumb/b/ba/Diode_Modelling_Image3.jpg/300px-
Diode_Modelling_Image3.jpg
Horowitz, P., & Hill, W. (1999). The Art of Electronics (2nd ed.). Cambridge University Press.8
Bell Labs. (n.d.). First Transistor. Retrieved from http://cnx.org/resources/9
9120e4bccd37da6ab1c4ff90e8c498cc/firsttransistor.gif
Bardeen, J. (n.d.). Semiconductor research leading to the point contact transistor. December 11,10
1956.
Shockley, W. (n.d.). Transistor technology envokes new physics. December 11, 1956.11
Bakshi, U., & Gods, A. (2008). Electronic Circuits. Technical Publications.12
Liu, X., Lee, C., & Zhou, C. (2001). Carbon nanotube field-effect inverters.13
Bachtold, A., Hadley, P., Nakanishi, T., & Dekker, C. (n.d.). Logic Circuits with Carbon Nanotube14
Transistors. November 9, 2001, 294.
Crockett, L. (2007). Carbon Nanotube Transistor Fabrication and Reliability Characterization.15
Research Accomplishments.
Wind, S., Appenzeller, J., & Avouris, P. (2003). Lateral Scaling in CArbon-Nanotube Field-Effect16
Transistors.
16

Weitere ähnliche Inhalte

Was ist angesagt?

Semiconductors (rawat d agreatt)
Semiconductors (rawat d agreatt)Semiconductors (rawat d agreatt)
Semiconductors (rawat d agreatt)Rawat DA Greatt
 
Engineering physics-Questions
Engineering physics-QuestionsEngineering physics-Questions
Engineering physics-QuestionsNexus
 
Energy band theory of solids
Energy band theory of solidsEnergy band theory of solids
Energy band theory of solidsBarani Tharan
 
Engineering Physics - II second semester Anna University lecturer notes
Engineering Physics - II second semester Anna University lecturer notesEngineering Physics - II second semester Anna University lecturer notes
Engineering Physics - II second semester Anna University lecturer notes24x7house
 
Semiconductor ch.3 part i, Introduction to the Quantum Theory of Solids
Semiconductor ch.3 part i, Introduction to the Quantum Theory of SolidsSemiconductor ch.3 part i, Introduction to the Quantum Theory of Solids
Semiconductor ch.3 part i, Introduction to the Quantum Theory of SolidsMazin A. Al-alousi
 
Band Theory- Chemistry
Band Theory- ChemistryBand Theory- Chemistry
Band Theory- ChemistrySyeda
 
The semiconductors.docx
The semiconductors.docxThe semiconductors.docx
The semiconductors.docxmadiana01
 
Opto electronics
Opto electronicsOpto electronics
Opto electronicsmofassair
 
BAND THEORY OF SOLIDS
BAND THEORY OF SOLIDSBAND THEORY OF SOLIDS
BAND THEORY OF SOLIDSMahi Shinde
 
Chapter 19 electrical properties
Chapter 19 electrical propertiesChapter 19 electrical properties
Chapter 19 electrical propertiesBasiony Shehata
 
Semiconductor Devices Class 12 Part-1
Semiconductor Devices Class 12 Part-1Semiconductor Devices Class 12 Part-1
Semiconductor Devices Class 12 Part-1Self-employed
 
Introduction to semiconductor materials
Introduction to semiconductor materialsIntroduction to semiconductor materials
Introduction to semiconductor materialsDr. Ghanshyam Singh
 
B.Tech sem I Engineering Physics U-II Chapter 1-Band theory of solid
B.Tech sem I Engineering Physics U-II Chapter 1-Band theory of solidB.Tech sem I Engineering Physics U-II Chapter 1-Band theory of solid
B.Tech sem I Engineering Physics U-II Chapter 1-Band theory of solidAbhi Hirpara
 
Band structure(2)
Band structure(2)Band structure(2)
Band structure(2)David David
 
Lec 5-semicondutors
Lec 5-semicondutorsLec 5-semicondutors
Lec 5-semicondutorshamzaatiq34
 
Theory discussion
Theory discussionTheory discussion
Theory discussionRay Wang
 

Was ist angesagt? (20)

Semiconductors (rawat d agreatt)
Semiconductors (rawat d agreatt)Semiconductors (rawat d agreatt)
Semiconductors (rawat d agreatt)
 
Chapter 9 Electrical Properties
Chapter 9 Electrical PropertiesChapter 9 Electrical Properties
Chapter 9 Electrical Properties
 
Engineering physics-Questions
Engineering physics-QuestionsEngineering physics-Questions
Engineering physics-Questions
 
Energy band theory of solids
Energy band theory of solidsEnergy band theory of solids
Energy band theory of solids
 
Unit 3
Unit 3Unit 3
Unit 3
 
Engineering Physics - II second semester Anna University lecturer notes
Engineering Physics - II second semester Anna University lecturer notesEngineering Physics - II second semester Anna University lecturer notes
Engineering Physics - II second semester Anna University lecturer notes
 
7 band structure
7 band structure7 band structure
7 band structure
 
Semiconductor ch.3 part i, Introduction to the Quantum Theory of Solids
Semiconductor ch.3 part i, Introduction to the Quantum Theory of SolidsSemiconductor ch.3 part i, Introduction to the Quantum Theory of Solids
Semiconductor ch.3 part i, Introduction to the Quantum Theory of Solids
 
Band Theory- Chemistry
Band Theory- ChemistryBand Theory- Chemistry
Band Theory- Chemistry
 
The semiconductors.docx
The semiconductors.docxThe semiconductors.docx
The semiconductors.docx
 
Opto electronics
Opto electronicsOpto electronics
Opto electronics
 
BAND THEORY OF SOLIDS
BAND THEORY OF SOLIDSBAND THEORY OF SOLIDS
BAND THEORY OF SOLIDS
 
Chapter 19 electrical properties
Chapter 19 electrical propertiesChapter 19 electrical properties
Chapter 19 electrical properties
 
Semiconductor Devices Class 12 Part-1
Semiconductor Devices Class 12 Part-1Semiconductor Devices Class 12 Part-1
Semiconductor Devices Class 12 Part-1
 
Introduction to semiconductor materials
Introduction to semiconductor materialsIntroduction to semiconductor materials
Introduction to semiconductor materials
 
B.Tech sem I Engineering Physics U-II Chapter 1-Band theory of solid
B.Tech sem I Engineering Physics U-II Chapter 1-Band theory of solidB.Tech sem I Engineering Physics U-II Chapter 1-Band theory of solid
B.Tech sem I Engineering Physics U-II Chapter 1-Band theory of solid
 
Band structure(2)
Band structure(2)Band structure(2)
Band structure(2)
 
Lec 5-semicondutors
Lec 5-semicondutorsLec 5-semicondutors
Lec 5-semicondutors
 
Electrical properties of materials
Electrical properties of materialsElectrical properties of materials
Electrical properties of materials
 
Theory discussion
Theory discussionTheory discussion
Theory discussion
 

Andere mochten auch

Andere mochten auch (6)

9
99
9
 
Periodeentregue rres
Periodeentregue rresPeriodeentregue rres
Periodeentregue rres
 
Ii guerra mundial
Ii guerra mundialIi guerra mundial
Ii guerra mundial
 
Future of work.compressed
Future of work.compressedFuture of work.compressed
Future of work.compressed
 
The HMS Fowey And Marine Archaeology
The HMS Fowey And Marine ArchaeologyThe HMS Fowey And Marine Archaeology
The HMS Fowey And Marine Archaeology
 
PhDThesis
PhDThesisPhDThesis
PhDThesis
 

Ähnlich wie CompsTransistor [final]

Lasers & semiconductors 2008 prelim solutions
Lasers & semiconductors 2008 prelim solutionsLasers & semiconductors 2008 prelim solutions
Lasers & semiconductors 2008 prelim solutionsJohn Jon
 
The Physics of Transparent Conducting Oxides
The Physics of Transparent Conducting OxidesThe Physics of Transparent Conducting Oxides
The Physics of Transparent Conducting OxidesUniversity of Liverpool
 
semo conductor.ppt
semo conductor.pptsemo conductor.ppt
semo conductor.pptkasthuri73
 
TRM-11fhsdbjbfffffffffffffffffffffffffffffffffffffff.ppt
TRM-11fhsdbjbfffffffffffffffffffffffffffffffffffffff.pptTRM-11fhsdbjbfffffffffffffffffffffffffffffffffffffff.ppt
TRM-11fhsdbjbfffffffffffffffffffffffffffffffffffffff.pptsauravnair2003
 
Module 1 Semiconductors (1).pptx
Module 1  Semiconductors (1).pptxModule 1  Semiconductors (1).pptx
Module 1 Semiconductors (1).pptxPriyaSharma135745
 
Diploma sem 2 applied science physics-unit 3-chap-1 band theory of solid
Diploma sem 2 applied science physics-unit 3-chap-1 band theory of solidDiploma sem 2 applied science physics-unit 3-chap-1 band theory of solid
Diploma sem 2 applied science physics-unit 3-chap-1 band theory of solidRai University
 
semiconductor-physics-3.pdf. Semiconductor
semiconductor-physics-3.pdf.  Semiconductorsemiconductor-physics-3.pdf.  Semiconductor
semiconductor-physics-3.pdf. SemiconductorMinaNath2
 
Semiconductors
SemiconductorsSemiconductors
SemiconductorsA B Shinde
 
1502957323lectrure_2_KUET.pptx
1502957323lectrure_2_KUET.pptx1502957323lectrure_2_KUET.pptx
1502957323lectrure_2_KUET.pptxTajmun1
 
1502957323lectrure_2_KUET [Autosaved].pptx
1502957323lectrure_2_KUET [Autosaved].pptx1502957323lectrure_2_KUET [Autosaved].pptx
1502957323lectrure_2_KUET [Autosaved].pptxTajmun1
 
solids_and_semiconductor_devices_1.ppt
solids_and_semiconductor_devices_1.pptsolids_and_semiconductor_devices_1.ppt
solids_and_semiconductor_devices_1.pptmragarwal
 
applied electronics 1
applied electronics 1applied electronics 1
applied electronics 1Tadesse6
 
Solids & Semiconductor Devices
Solids & Semiconductor DevicesSolids & Semiconductor Devices
Solids & Semiconductor DevicesCHETAN D. GANDATE
 
B.tech sem i engineering physics u ii chapter 1-band theory of solid
B.tech sem i engineering physics u ii chapter 1-band theory of solidB.tech sem i engineering physics u ii chapter 1-band theory of solid
B.tech sem i engineering physics u ii chapter 1-band theory of solidRai University
 
Chapter 38
Chapter 38Chapter 38
Chapter 38mcfalltj
 
Solids_And_Semiconductor_Devices_1.ppt
Solids_And_Semiconductor_Devices_1.pptSolids_And_Semiconductor_Devices_1.ppt
Solids_And_Semiconductor_Devices_1.pptssuserfa217a
 
Class 12th Solids and semiconductor devices part 1
Class 12th Solids and semiconductor devices part 1Class 12th Solids and semiconductor devices part 1
Class 12th Solids and semiconductor devices part 1Arpit Meena
 

Ähnlich wie CompsTransistor [final] (20)

Lasers & semiconductors 2008 prelim solutions
Lasers & semiconductors 2008 prelim solutionsLasers & semiconductors 2008 prelim solutions
Lasers & semiconductors 2008 prelim solutions
 
Unit 3.docx
Unit 3.docxUnit 3.docx
Unit 3.docx
 
The Physics of Transparent Conducting Oxides
The Physics of Transparent Conducting OxidesThe Physics of Transparent Conducting Oxides
The Physics of Transparent Conducting Oxides
 
Energy bands and gaps in semiconductor
Energy bands and gaps in semiconductorEnergy bands and gaps in semiconductor
Energy bands and gaps in semiconductor
 
semo conductor.ppt
semo conductor.pptsemo conductor.ppt
semo conductor.ppt
 
TRM-11fhsdbjbfffffffffffffffffffffffffffffffffffffff.ppt
TRM-11fhsdbjbfffffffffffffffffffffffffffffffffffffff.pptTRM-11fhsdbjbfffffffffffffffffffffffffffffffffffffff.ppt
TRM-11fhsdbjbfffffffffffffffffffffffffffffffffffffff.ppt
 
Bandtheory of solids
Bandtheory of solidsBandtheory of solids
Bandtheory of solids
 
Module 1 Semiconductors (1).pptx
Module 1  Semiconductors (1).pptxModule 1  Semiconductors (1).pptx
Module 1 Semiconductors (1).pptx
 
Diploma sem 2 applied science physics-unit 3-chap-1 band theory of solid
Diploma sem 2 applied science physics-unit 3-chap-1 band theory of solidDiploma sem 2 applied science physics-unit 3-chap-1 band theory of solid
Diploma sem 2 applied science physics-unit 3-chap-1 band theory of solid
 
semiconductor-physics-3.pdf. Semiconductor
semiconductor-physics-3.pdf.  Semiconductorsemiconductor-physics-3.pdf.  Semiconductor
semiconductor-physics-3.pdf. Semiconductor
 
Semiconductors
SemiconductorsSemiconductors
Semiconductors
 
1502957323lectrure_2_KUET.pptx
1502957323lectrure_2_KUET.pptx1502957323lectrure_2_KUET.pptx
1502957323lectrure_2_KUET.pptx
 
1502957323lectrure_2_KUET [Autosaved].pptx
1502957323lectrure_2_KUET [Autosaved].pptx1502957323lectrure_2_KUET [Autosaved].pptx
1502957323lectrure_2_KUET [Autosaved].pptx
 
solids_and_semiconductor_devices_1.ppt
solids_and_semiconductor_devices_1.pptsolids_and_semiconductor_devices_1.ppt
solids_and_semiconductor_devices_1.ppt
 
applied electronics 1
applied electronics 1applied electronics 1
applied electronics 1
 
Solids & Semiconductor Devices
Solids & Semiconductor DevicesSolids & Semiconductor Devices
Solids & Semiconductor Devices
 
B.tech sem i engineering physics u ii chapter 1-band theory of solid
B.tech sem i engineering physics u ii chapter 1-band theory of solidB.tech sem i engineering physics u ii chapter 1-band theory of solid
B.tech sem i engineering physics u ii chapter 1-band theory of solid
 
Chapter 38
Chapter 38Chapter 38
Chapter 38
 
Solids_And_Semiconductor_Devices_1.ppt
Solids_And_Semiconductor_Devices_1.pptSolids_And_Semiconductor_Devices_1.ppt
Solids_And_Semiconductor_Devices_1.ppt
 
Class 12th Solids and semiconductor devices part 1
Class 12th Solids and semiconductor devices part 1Class 12th Solids and semiconductor devices part 1
Class 12th Solids and semiconductor devices part 1
 

CompsTransistor [final]

  • 1. The Transition of the Transistor to Carbon Nanotubes Kevin Kuwata Department of Physics, Occidental College Monday April 13, 2015 Abstract This paper look at the properties of traditional transistors to make a paralleled comparison to carbon nanotube transistors. Starting with the basic components of the transistor, reviewing in detail the various materials which a transistor consists and transition towards a qualitative overview of carbon nanotube transistors, the future. Introduction In 1925, Julius Lilienfeld filed a patent describing an electronic device that would replace the triode . This device was the field effect transistor, and not only did it revolutionize electronics, it was1 a necessary stepping stone towards integrated circuits. Transistors allow an external circuit to be controlled electronically just as a mechanical switch does. This allows for the implementation of switches where a mechanical switch would not necessarily fit. There could be a requirement to work with high voltage supply; a transistor could be used to isolate the high voltage system from the experimenter. Transistors find themselves in a wide range of applications from intuitive switching circuits or the logic gates of integrated circuits. The structure of this paper is as follows: starting with an introduction of semiconductors in the vocabulary of band theory of solids, then exploration of the interaction of doped semiconductors, and finally a discussion on the history of point contact transistors to metal oxide field effect transistors (MOSFET) leading into the future of transistors: carbon nanotube transistors. Semiconductors In order to start talking about transistors, we need to discuss at length the different components which make up a transistor. Starting at the most basic level, we must first discuss a 

  • 2. semiconductor and how it is characterized in the sense of the band structure of a solid. The first type of material we will consider is the conductor. A conductor is characterized by its ability to easily conduct electricity. This conductivity arrises from the overlapping band energy between the conduction band and the valence band of a metal. In Figure 1, a band energy diagram compares the band energies for a conductor, insulator, and semiconductor, respectively .2 The two types of bands denoted by the labels ‘Allowed’ and ‘Forbidden’ simply note where additional electrons can reside. If an excited electron is found with the correct energy it can be allowed to transition into the higher band. An insulator is characterized by the second region, or the forbidden band which is too large for most of the electrons to cross solely due to room temperature. However, an insulator at a very high temperature could have more electrons with energies sufficient enough to jump the forbidden gap and will therefore conduct slightly. Finally, a semiconductor is a material with a forbidden band which is just large enough so that the electrons cannot jump on their own, but with the addition of some energy, they can easily clear the gap. In a process called doping, the material composition can be changed to decrease the forbidden band’s width. Doping is process of taking a pure semiconducting sample and injecting a dopant. A dopant is simply an impurity which alters the electrical or optical properties of a material by either accepting or donating an electron. Introducing a dopant allows additional energy levels Figure 1. Energy diagram for conductors, insulators, and semiconductors. Note the forbidden energy band thickness in the conductor (Left) compared to that of the semiconductor (Right)2. 2
  • 3. within the original forbidden band. If the additional energy levels are filled and are close to the conduction band (Figure 2a) electrons will be able to clear the gap with minimal additional energy. This type of semiconductor doping is called an n-type semiconductor, n for the negative charge carriers. Because the impurity is localized, the hole that is left behind after excitation is remains in the forbidden band and only the electron (now free in the conduction band) can contribute towards current. For the p-type semiconductor, if the additional energy levels are empty and closer to the valence band the electrons can jump from the valence band to the, now available, empty energy level in the forbidden band. The electrons are now forced to stay within the energy band, while the holes are free to move in the valence band and contribute towards the semiconductors current. Starting with a pure semiconductor, silicon for instance, and implanting impurities into the structure can produce additional electrons or holes in the material. A hole, is simply the absence of an electron, but can be thought of as a positive charge. The decision of the type of impurity to add is determined by several factors, but the number of valence electrons is the fundamental reason in choosing a particular dopant. Continuing the case of silicon, adding an element with one more Figure 2. (a) An energy band diagram for a n-type semiconductor with the additional filled electron band near the valence band. (b) The energy band diagram for a p-type semiconductor. Notice the location of the empty energy band near the valence band2. a. b. 3
  • 4. valence electron than silicon will result in a material with excess electrons. Thus, adding antimony to silicon will introduce an additional electron which is free to move, therefore making an n-type semiconductor.3 Again returning to the case of silicon, adding an impurity with one less electron than silicon, such as boron, will result in a neighboring atom losing an electron and producing a hole and a p-type semiconductor .4 Diodes The next major component of a transistor is the diode. A diode is created when different semiconductor materials are stacked on top of each other. The most basic case, is a NP diode (Figure 4a) can be analyzed at length to gain insight. When n and p type materials are stacked, diffusion occurs because of the different concentrations of charge carriers within the materials. Figure 3. (a) Antimony is added to silicon, introducing an additional electron and producing an n-type semiconductor.. (b) A p-type semiconductor where boron was added to silicon and because boron has one less valence electron than silicon, it steals an electron from a neighboring atom, creating a hole4. a. b. 4
  • 5. The energy required to transition from the conduction band to the valence band is provided by the system’s environment. The temperature of the room provides the thermal energy to allow the electrons to transition energy bands. Figure 4a, shows the energy required for the electrons to transfer from the n material to the p material. The density of particles at a given temperature T with energy state is given by the Fermi-Dirac equation :5 where is the chemical energy and k is Botlzman’s constant. At absolute zero is defined as the Fermi energy level. The only electrons which jump the forbidden energy level are the ones with which have energy greater than where is the lowest energy of the conduction band and the is the additional energy required for the electrons to flow from the n material to the p material. In order to find the number of electrons with acceptable energy we need to integrate1: ε Figure 4. (a) Simply the flow of electrons due to diffusion and the additional energy required to flow from the n material to the p material. (b) The flow of electrons if the system was reversed biased. This is used to calculated the reverse current. (c) The energy required to transition from the n-type material to p-type material is reduced compared to unbaked or reverse bias scenario. a. b. c. (1),ni (εi ) = 1 e(εi −µ)/kT +1 µ µ Eo +∆ E E0 ∆ E (2). .N = ni (εi )dε = 1 e(εi −µ)/kT +1E0 +´∆ E ∞ ∫E0 +´∆ E ∞ ∫ dε = Ce−∆ E/kT 5
  • 6. We have collected all the constants into C to simplify the presentation. We know the flow of electrons is proportional to the number of electrons with acceptable energy so we model it as such1: Because there is no bias and the system is in thermal equilibrium the net flow is zero, meaning that the flow of electrons is equal or If an electric bias is applied to the system a net flow occurs depending on the orientation of the applied bias. In the reverse bias case (Figure 4b) the net flow of electrons is: The energy required to transition from the valence band to the conduction band is increased due to the opposing force from the reverse electric potential (Figure 4b). This increase in energy is reflected in the flow rate for becoming: while the flow from the p to the n type material remains unchanged equation 4. The increase in energy for f1 occurs because the electrons are opposing the electric bias and therefore require additional energy to overcome it. At room temperature we can approximate so that our net flow under reverse bias is actually: (3) (4) , and . f1 = Ce−∆ E/KT f2 = Ce−∆ E/KT (5).f1 = f2 (6)fnet = f1 − f2 = Ce−∆ E/kT e−eV0 /kT −1( ) eV0 f1 (7),f1 = Ce−(∆ E+eVo )/kT eeV0 /kT → 0 (8).fnet = Ce∆ E/kT 0 e eV0/kT −1 ⎛ ⎝⎜ ⎞ ⎠⎟ = −Ce∆ E/kT 6
  • 7. In the forward bias case (Figure 4c) the electrons are now pulled from the material, as well as the holes, thus decreasing the energy the electrons required in order to contribute to current. The flow f1 due to the forward bias is now: The flow f2 is unaffected by the forward bias thus the final net flow under forward bias is: Now we have an equation for flowing electrons, but we know that change in charge over change in time, at a given point is the current through that point. We can conclude that the current for a PN diode can be model as the net flow between the two materials. here is the collection of all the constants from equation (10) and represents the reverse saturation current. The forward bias voltage applied, is now defined as the diode voltage. The diode has a reverse saturation current which is significantly smaller than the forward current and is greatly influenced by temperature, so at room temperature this term is approximated to be zero. If we were to graph equation (11) we could get an IV characteristic curve for our newly created diode (Figure 5).6 (9)f1 = Ce−(∆ E+eV0 )/kT (10)fnet = f1 − f2 = −Ce−∆ E/kT (e−eV0 /kT −1) dq / dt (11)I = I0 (eeVd /kT −1) I0 V0 Vd Figure 5: (a)The IV curve for a diode. Notice the saturated reverse current which occurs for negative values of voltages. (b) A simple diode circuit used in load line analysis to determine the operating voltage Vd of the diode.6 a. b. 7
  • 8. The negative current of the diode in Figure 5a is the reverse saturated current and is the same value as . Note that the value for is not constant and is dependent with temperature. If we perform a Kirchoff Voltage Loop around the circuit in Figure 5b, we get the following equation: Substituting equation (11) for I into equation (12) we get a transcendental equation: Equation (14) cannot be solved analytically but is solved most easily with the graphical solution shown below (Figure 6).7 From Figure 6, plugging in values for constants and room temperature and assuming the diode has a voltage drop Vd of 0.6 volts, the intersection of the lines dictates the current through the diode .8 Now that the diode has been modeled in a consistent and quantitative manner, we are able to tackle the different types of transistors and adequately describe their operation. I0 I0 (12)V0 − IRL −Vd = 0 (13) (14) , and . V0 − I0 (eeVd /kT −1)⎡⎣ ⎤⎦RL −Vd = 0 I = V0 −Vd RL = I0 eeVd /kT −1( ) Figure 6. Load line analysis for the simple circuit in Figure 5b resulting in the diode voltage, therefore allowing us to determine the current through the diode. The intersection of the two lines indicates the diode’s voltage7. 8
  • 9. Various Types of Transistors, Chronological Point Contact Transistor The very first type of transistor introduced was discovered in 1947 at Bell Labs (Figure 7a). It9 utilized a germanium slab, an external power supply to provide an electric potential over the germanium, and two gold leads. With this device, the research lab was able to observe the conduction of electrons between two contacts separated in space controlled by an external electric potential. It was found applying a voltage to the emitter side of the device would result in a larger voltage on the collector of the device. Looking at the device in its simplified circuit form, Figure 8, we can analyze the flow of electrons .10 Figure 7. (a)The first transistor created at Bell Labs in 1947 using a germanium body and gold terminal contacts. (b) A schematic overview of the point contact transistor. Note the PN type semiconductor beneath the gold contacts. The electric field applied to the base of the germanium creates free electrons which contribute to current.9 a. b. 9
  • 10. As the electric potential between the emitter contact and the germanium base increases, so does the electric field. When the field becomes strong enough electrons are pulled from the germanium n- doped material leaving behind holes; holes are then attracted towards the collector contact. The collector current creates an electric field within the germanium block which allows the flow of electrons towards the emitter contact. Metal Oxide Semiconductor Field Effect Transistor While experimenting with the point contact transistor, Shockely of the Bell Lab group, found that allowing minority carriers to flow from the emitter through the base material to the collector lead, the amplification of the signal could be increased . This discovery lead to the11 development of the Field Effect Transistor (FET) and eventually to the Metal Oxide Semiconductor Field Effect Transistor (MOSFET). The FET utilizes an electric field created by a gate voltage over a pn type material. The MOSFET differs from a FET by a insulating oxide layer between the gate terminal and the body of the transistor. This oxide allows for a better forward current with a lower gate voltage. The MOSFET transistor consists of 4 terminals, shown schematically in below12 Figure 8. Simple circuit representation of a point contact transistor. Modeling the first transistor.10 10
  • 11. (Figure 9).The four terminals indicated are, base (substrate), gate, drain (emitter), and source (collector). A MOSFET operating in the depletion mode has a drain current that is proportional to the voltage applied to the grate: as the gate potential increases, the holes in the p material are attracted towards the gate. As this continues, the electrons in the n-type material of the MOSFET start to become attracted towards the gate. Near the region of the gate, the holes and electrons recombine leaving a decreased concentration of free charge carriers. As the concentration of free charge carriers decrease, the ability for current to conduct decreases too. Thus, the current at the drain decreases as the electric potential on the gate of the MOSFET increases. Because the current through the drain is dependent on the gate voltages VGS we get a family of IV curves. Below is a typical IV curve for a p-type MOSFET operating in depletion mode11. Depletion mode occurs when the gate voltage creates and electric field which attracts the free charge carriers within the semiconductor. When the electric field attracts the majority of available charge carriers, the current between the drain and the source is also reduced. This is because the number of Figure 9. Schematic of a depletion mode p type MOSFET. This is a MOSFET which is normally ON with zero gate voltage, VGS. In this figure, ID is the drain current to the D drain, G is the gate voltage, S is the source voltage and SS is the voltage of the body of the MOSFET and usually set at the lowest potential connected to the MOSFET.12 11
  • 12. available charge carriers is simply less. This type of mode of operation is characterized by an ON state when the MOSFET has zero voltage applied to the gate voltage. Enhancement mode, is characterized by the exact opposite application of the gate voltage. In enhancement mode, the transistor requires that a voltage be applied to the gate of the transistor in order for it to conduct forward current. As the gate voltage increases so does the drain current. This is due to the fact that the charge carriers are drawn into the charge carriers are attracted by the gate voltage and therefore contribute toward current between the drain and the source. Notice that in depletion mode operation of a p-type MOSFET, applying more gate voltage impedes the flow of current similar to the effect of squeezing a garden hose. The more you squeeze the less water will flow. The current actually decreases with the increase of absolute value of the voltage. This is due to the fact that the MOSFET is in depletion mode, requiring a reverse bias on the gate. This reverse bias entails a higher voltage is actually more negative, and an increase in voltage results in a decrease voltage value. 12 Figure 10. A IV characteristic curve for a p-type MOSFET. In the depletion mode of operation the MOSFET acts as a garden hose. More voltage applied to the gate restricts more current through the transistor. The current through the drain appears to be decreasing with a decrease in gate voltage. This is due to the fact that the device is hooked up with the leads attached in reverse bias.11
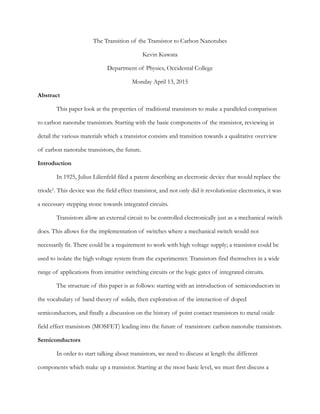
  • 13. Carbon Nanotube Transistors In 1965, Gordon E. Moore observed the number of transistors packed into an integrated circuit doubles about every two years. This exponential advancement in technology cannot be sustained forever and will eventually halt. As materials become scaled smaller we approach physical limits of the materials. New materials, such as the carbon nanotube, are required to break these physical limits. In the search to scale transistors down, in hopes to achieve better efficiency and ON-OFF switching speed, carbon nanotubes are investigated. A proof of concept has been modeled and studied for the use of carbon nanotubes inside transistors. Several groups have successfully demonstrated the creation of logic circuits with the implementation of carbon nanotube transistors . Researchers at the University13 14 of Southern California have successfully demonstrated a carbon nanotube transistor that emulates the operation of a p-type MOSFET in depletion mode12. Due to the difficulty in placement of carbon nanotubes, a process called chemical-vapor- decomposition was utilized to grow the nanotubes. The first step in the process is depositing the growth medium in which the carbon nanotube can start growing. The research group used catalytic nanoscale iron particles to start the growth of the carbon nanotube on the Silicon substrate. Finally the source and drain contacts are attached over the ends of the carbon nanotube. The results of this process are promising, as the MOSFET transistor was successfully modeled using carbon nanotube transistors. The IV curve for the p type MOSFET is shown in Figure 12. Comparing the plot from Figure 12 and that of Figure 10 we can see a strong similarity between the two devices, despite the fundamental difference in device components. 13 Figure 11. (a) Schematic of the carbon nanotube transistor. The source is labeled S and the drain is labeled D. The carbon nanotube connects the two terminals. (b) An atomic force microscopy image of the appraise in (a) with the carbon nanotube slightly visible (indicated by the arrow). a. b.
  • 14. Due to the carbon nanotube’s poor reliability in oxygen and the difficulty of nanotube15 placement further understanding is required before commercialization. To compensate for the carbon nanotube being exposed to air, back gated carbon nanotube transistors are being considered. Interestingly enough, the gate length of a carbon nanotube was found to not affect the current flowing through the transistor . In addition better understanding of the contacts and the carbon16 nanotube is required to gain insight on the effect of the work functions of the carbon nanotube to the terminal contact used. Conclusion The carbon nanotube transistor was not possible without the crucial research performed at Bell Labs resulting in the worlds first transistor. Then with better understanding of semiconductors and their ability to be modified by a dopant, the Field Effect Transistor was born. This device Figure 12. The IV curve for a p-type field effect transistor utilizing carbon nanotube operating in depletion mode. Note the current to the drain increases as the voltage becomes more negative12 14
  • 15. provided better control over the drain current by utilizing an electric field to control the charge carriers which contribute to the drain current. A carbon nanotube has been implanted inside of a field effect transistor to replicate the electronic capabilities of a basic transistor. Although the development of logic circuits derived from carbon nanotube transistors has already been realized, significant work is still required to understand the effect of the metal leads’ work function and the effect on the transistors ability to conduct. The carbon nanotube transistors also need to become more durable with minimal additional materials. Just as triodes were phased out by the transistor popularized by its low power consumption and relatively size , the MOSFET will become obsolete when the carbon nanotube transistor is scaled further.
 15
  • 16. References History of the transistor. (2015, April 2). In Wikipedia, the free encyclopedia. Retrieved from1 http://en.wikipedia.org/w/index.php?title=History_of_the_transistor&oldid=654696451 Eggleston, D. (2011). Basic Electronics for Scientists and Engineers. Cambridge University Press.2 Georgia State University. (n.d.). Atimony Valence Shell. Retrieved from http://hyperphysics.phy-3 astr.gsu.edu/hbase/solids/dope.html Georgia State University. (n.d.). Boron Valence Shell. Retrieved from http://hyperphysics.phy-4 astr.gsu.edu/hbase/solids/dope.html Shroeder, D. (1999). An Introduction to Thermal Physics (1st ed.). Addison-Wesley.5 Diode IV Curve. (n.d.). Retrieved from http://cnx.org/resources/6 dc6ed4580a0be64d1a922eff1eb355dc/2_42.png Diode IV Characteristic Curve Load Line Analysis. (n.d.). Retrieved from http://7 upload.wikimedia.org/wikipedia/en/thumb/b/ba/Diode_Modelling_Image3.jpg/300px- Diode_Modelling_Image3.jpg Horowitz, P., & Hill, W. (1999). The Art of Electronics (2nd ed.). Cambridge University Press.8 Bell Labs. (n.d.). First Transistor. Retrieved from http://cnx.org/resources/9 9120e4bccd37da6ab1c4ff90e8c498cc/firsttransistor.gif Bardeen, J. (n.d.). Semiconductor research leading to the point contact transistor. December 11,10 1956. Shockley, W. (n.d.). Transistor technology envokes new physics. December 11, 1956.11 Bakshi, U., & Gods, A. (2008). Electronic Circuits. Technical Publications.12 Liu, X., Lee, C., & Zhou, C. (2001). Carbon nanotube field-effect inverters.13 Bachtold, A., Hadley, P., Nakanishi, T., & Dekker, C. (n.d.). Logic Circuits with Carbon Nanotube14 Transistors. November 9, 2001, 294. Crockett, L. (2007). Carbon Nanotube Transistor Fabrication and Reliability Characterization.15 Research Accomplishments. Wind, S., Appenzeller, J., & Avouris, P. (2003). Lateral Scaling in CArbon-Nanotube Field-Effect16 Transistors. 16