SlideShare ist ein Scribd-Unternehmen logo
1 von 15
Downloaden Sie, um offline zu lesen
166Department of Analytical Skills
DATA INTERPRETATION
Data interpretation is an act of analysing data with the objective to gain useful information from it. It
is done to draw conclusions from the given data. Different statistical tools are used to represent the
data in organized structures.
Different method in which data can be presented to solve Data Interpretation Questions:
1. Tables: Tables are the most convenient and versatile method to present data. Analyzing and
drawing conclusions from tables is much easier than any other method. Tables are the fundamental
method to represent data. In tables, the data is arranged in rows and columns which help us to
scrutinize data efficiently.
2. Pie chart: A Pie chart is a pictorial representation of data as part of a circle. The circle presents the
total value and the different parts of the circle present certain portions of the data.
There are two types of pie chart: Normal and Exploded
3. Bar Graph: A bar graph is a way of representing data on the graph using X-axis and Y-axis. It is
the most convenient way to present data. It is proven that using lengths in case of bar chart is a better
indicator than pie charts where the data is categorized in terms of areas.
4. Line Graph: Line graph is the simplified version of the normal bar graph. It is simple to draw
conclusions from Line Graph.
167Department of Analytical Skills
5. Mixed Graph: Pie Chart along with tabular data, bar graph along with tabular data.
Some important tricks to solve data interpretation questions:
1. Memorize some fractional and percentage values.
2. Don’t waste time with lengthy calculations. Try to solve questions with approximation.
3. Use previous calculation if needed again.
4. Important topics to concentrate in data interpretation is Ratios, Percentages and Average.
5. Don’t assume anything, There are few questions which ask to find out some data which is not
available. Always be alert enough to see whether the data given is enough to answer the question or
not and do not answer the question based on assumptions.
Example 1: Study the following table and answer the questions.
Classification of 100 Students based on the Marks Obtained by them in Physics and Chemistry in an
Examination.
Subject
Marks out of 50
40 and
above
30 and
above
20 and
above
10 and
above
0 and
above
Physics 9 32 80 92 100
Chemistry 4 21 66 81 100
Average
(Aggregate)
7 27 73 87 100
I. What is the different between the number of students passed with 30 as cut-off marks in Chemistry
and those passed with 30 as cut-off marks in aggregate?
Solution: Required difference = (No. of students scoring 30 and above marks in Chemistry)
– (Number of students scoring 30 and above marks in aggregate)
= 27 – 21 = 6.
II. If at least 60% marks in Physics are required for pursuing higher studies in Physics, how many
students will be eligible to pursue higher studies in Physics?
Solution:
168Department of Analytical Skills
III. The percentage of number of students getting at least 60% marks in Chemistry over those getting
at least 40% marks in aggregate, is approximately?
Solution:
Example 2: The following pie chart shows the amount of subscriptions generated for India Bonds
from different categories of investors.
Subscriptions Generated for India Bonds
I. In the corporate sector, approximately how many degrees should be there in the central angle?
Solution: Since 1% = 3.6 degrees
Corporate Houses = 34%
34 x 3.6 = 122.40
II. If the investment by NRI’s are Rs 4,000 crore, then the investments by corporate houses and FII’s
together is:
Solution: Corporate Houses and FII’s together = 34 + 33 = 67%
NRI = 11%
Total investment by Corporate Houses and FII’s together =
(67/11) x 4000 = 24, 363.6364
III. If the total investment other than by FII and corporate houses is Rs 335,000 crore, then the
investment by NRI’s and Offshore funds will be (approximately)?
Solution: Investment other than NRI and corporate houses is 33% = 335000.
Also, investment by offshore funds and NRI’s is equal to 27%.
Hence, 27 x 335,000/33 = 274, 090.909
169Department of Analytical Skills
Example 3: The following bar graph shows the Income and Expenditures (in million US $) of five
companies in the year 2001. The percent profit or loss of a company is given by
Income and Expenditure (in million US $) of five companies in the year 2001
I. The companies M and N together had a percentage of profit/loss of?
Solution:
II. In 2001, what was the approximate percentage of profit/loss of all the five Companies taken
together?
Solution:
170Department of Analytical Skills
III. Which company earned the maximum percentage profit in the year 2001?
Solution:
IV. For Company R, if the expenditure had increased by 20% in year 2001 from year 2000 and the
company had earned profit of 10% in 2000, what was the Company’s income in 2000 (in million US
$)?
Solution:
Example 4: The following line graph gives the percentage of the number of candidates who qualified
an examination out of the total number of candidates who appeared for the examination over a period
of seven years from 1994 to 2000.
Percentage of Candidates Qualified to Appeared in an Examination Over the Years
171Department of Analytical Skills
I. The difference between the percentages of candidates qualified to appear was maximum in which of
the following pairs of years?
Solution: The differences between the percentages of candidates qualified to appear for the give
pairs of years are:
For 1994 and 1995 = 50 – 30 = 20
For 1998 and 1999 = 80 – 80 = 0
For 1994 and 1997 = 50 – 30 = 20
For 1997 and 1998 = 80 – 50 = 30
For 1999 and 2000 = 80 – 60 = 20
Thus, the maximum difference is between the years 1997 and 1998.
II. If the number of candidates qualified in 1998 was 21200, what was the number of candidates
appeared in 1998?
Solution:
III. If the total number of candidates appeared in 1996 and 1997 together was 47400, then the total
number of candidates qualified in these two years together was?
Solution: The total number of candidates qualified in 1996 and 1997 together,
cannot be determined until we know at least, the number of candidates appeared in
any one of the two years 1996 or 1997 or the percentage of candidates qualified to
appeared in 1996 and 1997 together.
Hence, the data is inadequate
IV. The total number of candidates qualified in 1999 and 2000 together was 33500 and the number of
candidates appeared in 1999 was 26500. What was the number of candidates in 2000?
Solution:
172Department of Analytical Skills
Example 5: Study the following information carefully and answer the question given below:
Pie chart shows the production of rice by 5 different factories and line chart shows the percentage of
sale.
Total production = 3600 kg
I. In which of the following factory the sale of rice is the highest?
Solution: Sale of rice by factory M = 3600 × 20% × 60% = 432 kg
Sale of rice by factory N = 3600 × 15% × 80% = 432 kg
Sale of rice by factory O = 3600 × 18% × 75% = 486 kg
Sale of rice by factory P = 3600 × 25% × 88% = 792 kg
Sale of rice by factory Q = 3600 × 22% × 75% = 594 kg
Sale of rice of factory P is the highest.
II. Rice sold by factory M and N together is how much percent more than the production of rice by
factory M?
Solution: Rice sold by factory M = 3600 × 20% × 60% = 432 kg
Rice sold by factory N = 3600 × 15% × 80% = 432 kg
Production of rice by factory M = 3600 × 20% = 720 kg
% more = {[432 + 432 – 720] × 100} / 720
= (144 × 100) / 720= 20%
III. If the cost price of rice is Rs 45 per kg and profit earned by factory Q on 1 kg rice is 20% of the
cost price, find the total profit earned by factory Q.
Solution: Rice sold by factory Q = 3600 × 22% × 75% = 594 kg
Profit on 1 kg rice = 45 × 20% = Rs 9
Total profit = 9 × 594 = Rs 5346
173Department of Analytical Skills
IV. What percent of total rice has been sold by all the factory?
Solution: Sale of rice by factory M = 3600 × 20% × 60% = 432 kg
Sale of rice by factory N = 3600 × 15% × 80% = 432 kg
Sale of rice by factory O = 3600 × 18% × 75% = 486 kg
Sale of rice by factory P = 3600 × 25% × 88% = 792 kg
Sale of rice by factory Q = 3600 × 22% × 75% = 594 kg
Total sale = 432 + 432 + 486 + 792 + 594 = 2736 kg
Required % = (2736 × 100) / 3600 = 76%
V. What is the ratio of rice sold by factory P and Q together to the rice sold by factory N and O
together?
Solution: Rice sold by factory P = 3600 × 25% × 88% = 792 kg
Rice sold by factory Q = 3600 × 22% × 75% = 594 kg
Rice sold by factory N = 3600 × 15% × 80% = 432 kg
Rice sold by factory O = 3600 × 18% × 75% = 486 kg
Required Ratio = 792 + 594 : 432 + 486
= 1386 : 918 = 77 : 51
174Department of Analytical Skills
LEVEL – I
Directions (1-3): Classification of 100 students based on the marks obtained by them in Physics and
Chemistry in an examination.
1. If at least 60% marks in Physics are required for pursuing higher studies in Physics, how many
students will be eligible to pursue higher studies in Physics?
A. 27 B. 32 C. 34 D. 41
2. The percentage of the number of students getting at least 60% marks in Chemistry over those
getting at least 40% marks in aggregate, is approximately:
A. 21% B. 27% C. 29% D. 31%
3. If it is known the at least 23 students were eligible for a Symposium on Chemistry, the minimum
qualifying marks in Chemistry for eligibility to Symposium would lie in the range:
A. 40-50 B. 30-40 C. 20-30 D. Cannot be determined
Directions (4-6): Study the following bar graph and answer the questions that follow:
Total monthly income = Rs. 50,000
4. What amount is spent on food?
A. Rs. 10,000 B. Rs. 15,000 C. Rs. 20,000 D. Rs. 30,000
5. How much more money is spent on clothing and housing together than on transportation?
A. Rs. 1,000 B. Rs. 5,000 C. Rs. 2,000 D. Rs. 2,500
6. What percent of amount on food is spent as amount on education?
A. 10% B. 40% C. 25% D. 20%
175Department of Analytical Skills
Directions (7-9): Study the pie chart below and answer the questions that follow:
The above pie chart shows the sales of four different types of articles in a shop.
7. What is the central angle of type A?
A. 128 degrees B. 126 degrees C. 136 degrees D. 140 degrees
8. If the total sale is 1200, what is the sale of B?
A. 120 B. 360 C. 260 D. 240
9. What is the difference between the central angle of A and D?
A. 108 degrees B. 120 degrees C. 96 degrees D. 130 degrees
Directions (10-14): The following table shows the number of boys and girls of different schools that
have participated in a scholarship test over five years.
10. How many girls more participated in year 2004 as compared to 2003 for all schools taken
together?
A. 110 B. 370 C. 480 D. 210
11. The ratio of boys: girls for school B over the years 2001-2004 is?
A. 17:34 B. 14:37 C. 37:10 D. 34:17
12. The percentage increase in participation of boys from school B in 2004 over those in 2001 is
nearly?
A. 28% B. 71% C. 72% D. 72%
13. The total number of participants in year 2003 is
A. 2000 B. 1830 C. 1720 D. 1640
176Department of Analytical Skills
14. In year 2004 the number of participating girls is what percent of number of participating boys?
A. 17:56 B. 56:17 C. 57:16 D. 16:57
Directions (15-17): These questions are based on the line graph below.
(in Rs. lakhs)
Total Cost = Manufacturing Cost + Advertising Cost
15. For which of the following cars is the manufacturing cost as a percentage of advertising cost the
least?
A. Xing B. City C. Lancer D. Zen
16. In a certain year, 30, 000 "City" cars, are produced, and are sold at Rs. 9.3 lacs/car. If 2% of the
total profit is given as a bonus to the 2,040 engineers, the amount received by each engineer as
bonus is (in Rs.)
A. 5, 000 B. 50, 000 C. 5 lacs D. None of these
17. The company that manufactures Zen produces 500 Zen cars per day while the company that
manufactures City produces 600 City per day. They sell them at Rs. 6 lacs/car and Rs. 8.4 lacs/car
respectively. The profit made by the former is approximately what percentage of that of the latter?
A. 100% B. 156% C. 250% D. None of these
Directions (18-20): The bar graph given below shows the percentage distribution of the total
expenditures of a company under various expense heads during 2003.
Percentage Distribution of Total Expenditure of a Company
177Department of Analytical Skills
18. The expenditure on the interest on loans is by what percent more than the expenditure on
transport?
A. 5% B. 40% C. 20% D. 10%
19. If the interest on loans amounted to Rs. 2.45 crores then the total amount of expenditure on
advertisement, taxes and research and development is?
A. Rs. 7 crores B. Rs. 5.4 crores C. Rs. 4.2 crores D. Rs. 3 crores
20. The total amount of expenditures of the company is how many times of expenditure on research
and development?
A. 20 B. 27 C. 18 D. 8
LEVEL – II
Directions (1-4): Study the following table carefully to answer these questions:
Number of workers employed in six units of a factory over the years.
1. In the year 2000 the number of workers employed by unit 'C' is what percent of the total number of
workers employed by all the units in the same year (rounded off to two places of decimal)?
A. 16.39 B. 17.21 C. 16.88 D. None of these
2. For all the given years what is the difference between the average number of workers in units D and
E?
A. 37 B. 33 C. 32 (2/3) D. 37 (1/3)
3. In which year is the percentage increase/decrease in the number of workers employed the minimum
for unit 'F'?
A. 2003 B. 1999 C. 2002 D. 2000
4. What is the approximate ratio of the number of workers employed in all the units in 1998 to that in
1999?
A. 13:14 B. 37:36 C. 10:9 D. 13:11
178Department of Analytical Skills
Directions (5-7): Pie chart shows the percent of money spent by family on various item during 1999.
Study the graph and answer these questions.
5. If the total amount spent was Rs. 46,000, how much money was spent on clothing and housing
together?
A. Rs. 11500 B. Rs. 1150 C. Rs. 10000 D. Rs. 15000
6. The ratio of the total amount of money spent on housing to that spent on education was
A. 5:2 B. 2:5 C. 4:5 D. 5:4
7. If the total amount spent during the year 1998 was Rs.46000, the amount spent on food was:
A. Rs. 12447 B. Rs. 15000 C. Rs. 6900 D. Rs. 3067 approx.
Directions (8-10): These questions are based on the circle graph which shows the expenditure
incurred in bringing out a book by a publisher.
8. What should be the central angle of the sector for transportation charges?
A. 4o
B. 14.4o
C. 12.4o
D. 8.4o
9. If the advertisement charges amount to Rs. 18,000, the total expenditure incurred in bringing out
the book is Rs.
A. 60,300 B. 63,000 C. 9,000 D. 1,00,000
10. If the author's royalties amount to Rs. 30,000, the binder's charges amount to Rs.
179Department of Analytical Skills
A. 6,000 B. 10,500 C. 12,000 D. 15,000
Directions (11-15): Study the following graph to answer these questions:
Percent profit earned by two companies A & B over the years.
Profit = Income - Expenditure
% Profit = Profit/Expenditure * 100
11. If the income of company A in 1998 was Rs. 1,42,500 what was its expenditure in that year?
A. 1,05,000 B. 95,000 C. 99,500 D. 1,05,555
12. Expenditure of company B in 1999 was 90% of its expenditure in 1998. Income of company B in
1999 was what percent of its income in 1998?
A. 130.5 B. 96 (2/3) C. 121.5 D. 93 (1/3)
13. If the expenditure of company A in 1997 was Rs. 70 lakhs and income of company A in 1997 was
equal to its expenditure in 1998, what was the total income (in Rs. lakh) of the company A in 1997 &
1998 together?
A. 175 B. 131.25 C. 218.75 D. Cannot be determined
14. Expenditure of company B in years 1996 and 1997 were in the ratio of 5:7 respectively. What was
the respective ratio of their incomes?
A. 10:13 B. 8:13 C. 13:14 D. 11:14
15. Total expenditure of companies A & B together in 2001 was Rs. 13.5 lakhs. What was the total
income of the two companies (in Rs. lakh) in that year?
A. 19.575 B. 20.25 C. 19.75 D. Cannot be determined
180Department of Analytical Skills
Directions (16-19): The following questions are based on the stacked bar graph given below.
Sales of various precious stones in India for the period of 1995-1996 to 1999-2000
16. What is the total sale of ruby as a percent of the total sales of precious stones for the given period?
A. 17.3% B. 19.23% C. 23.1% D. None of these
17. By what percent is the average annual sale of Emerald for the given period more than the sales of
Opal in 1998-1999?
A. 120% B. 50% C. 25% D. 40%
18. For how many years is the sale of Bezel as a percentage of the total sales of precious stones less
than that of Topaz?
A. One B. Two C. Three D. Four
19. If the sales of Topaz increased from 1994-1995 to 1995-1996 by 25% and increased from 1999-
2000 to 2000-01 by 50%, then what is the difference between the sales of Topaz in 1994-95 and that
in 2000-01?
A. 50, 000 tonnes B. 100, 000 tonnes C. 140, 000 tonnes D. 160, 000 tonnes
20. Which of the given stones experienced highest percentage growth in its sale in any year over that
of the previous year over theprevious 1996-97 to 1999-2000
A. Topaz B. Emerald C. Ruby D. Bezel

Weitere ähnliche Inhalte

Was ist angesagt?

Illustrating Rational Algebraic Expressions
Illustrating Rational Algebraic ExpressionsIllustrating Rational Algebraic Expressions
Illustrating Rational Algebraic ExpressionsFree Math Powerpoints
 
Binomial Theorem
Binomial TheoremBinomial Theorem
Binomial Theoremitutor
 
Introduction to Statistics
Introduction to StatisticsIntroduction to Statistics
Introduction to StatisticsAnjan Mahanta
 
Probability (gr.11)
Probability (gr.11)Probability (gr.11)
Probability (gr.11)Vukile Xhego
 
Properties of arithmetic mean
Properties of arithmetic meanProperties of arithmetic mean
Properties of arithmetic meanNadeem Uddin
 
Data collection and presentation
Data collection and presentationData collection and presentation
Data collection and presentationferdaus44
 
WHAT IS RESEARCH DESIGN ? EXPLAIN IMPORTANCE OF RESEARCH DESIGN
WHAT IS RESEARCH DESIGN ? EXPLAIN IMPORTANCE OF RESEARCH DESIGN WHAT IS RESEARCH DESIGN ? EXPLAIN IMPORTANCE OF RESEARCH DESIGN
WHAT IS RESEARCH DESIGN ? EXPLAIN IMPORTANCE OF RESEARCH DESIGN Sachin Somanna M P
 
Trigonometric Ratios
Trigonometric RatiosTrigonometric Ratios
Trigonometric Ratiosliliana1993
 
Measures of central tendency
Measures of central tendencyMeasures of central tendency
Measures of central tendencyChie Pegollo
 
Coefficient of variation
Coefficient of variationCoefficient of variation
Coefficient of variationNadeem Uddin
 
Types of random sampling
Types of random samplingTypes of random sampling
Types of random samplingStudying
 
Source of Data in Research
Source of Data in ResearchSource of Data in Research
Source of Data in ResearchManu K M
 
2.4 Linear Functions
2.4 Linear Functions2.4 Linear Functions
2.4 Linear Functionssmiller5
 

Was ist angesagt? (20)

Illustrating Rational Algebraic Expressions
Illustrating Rational Algebraic ExpressionsIllustrating Rational Algebraic Expressions
Illustrating Rational Algebraic Expressions
 
Binomial Theorem
Binomial TheoremBinomial Theorem
Binomial Theorem
 
Geometric Mean
Geometric MeanGeometric Mean
Geometric Mean
 
Introduction to Statistics
Introduction to StatisticsIntroduction to Statistics
Introduction to Statistics
 
Probability (gr.11)
Probability (gr.11)Probability (gr.11)
Probability (gr.11)
 
A RESEARCH PROBLEM
A RESEARCH PROBLEMA RESEARCH PROBLEM
A RESEARCH PROBLEM
 
Properties of arithmetic mean
Properties of arithmetic meanProperties of arithmetic mean
Properties of arithmetic mean
 
Data collection and presentation
Data collection and presentationData collection and presentation
Data collection and presentation
 
Research data interpretation
Research data interpretationResearch data interpretation
Research data interpretation
 
EXPERIMENTAL RESEARCH DESIGN
EXPERIMENTAL RESEARCH DESIGNEXPERIMENTAL RESEARCH DESIGN
EXPERIMENTAL RESEARCH DESIGN
 
WHAT IS RESEARCH DESIGN ? EXPLAIN IMPORTANCE OF RESEARCH DESIGN
WHAT IS RESEARCH DESIGN ? EXPLAIN IMPORTANCE OF RESEARCH DESIGN WHAT IS RESEARCH DESIGN ? EXPLAIN IMPORTANCE OF RESEARCH DESIGN
WHAT IS RESEARCH DESIGN ? EXPLAIN IMPORTANCE OF RESEARCH DESIGN
 
Experimental design
Experimental designExperimental design
Experimental design
 
Trigonometric Ratios
Trigonometric RatiosTrigonometric Ratios
Trigonometric Ratios
 
Measures of central tendency
Measures of central tendencyMeasures of central tendency
Measures of central tendency
 
Coefficient of variation
Coefficient of variationCoefficient of variation
Coefficient of variation
 
Linear Inequality
Linear InequalityLinear Inequality
Linear Inequality
 
Laws of exponents
Laws of exponentsLaws of exponents
Laws of exponents
 
Types of random sampling
Types of random samplingTypes of random sampling
Types of random sampling
 
Source of Data in Research
Source of Data in ResearchSource of Data in Research
Source of Data in Research
 
2.4 Linear Functions
2.4 Linear Functions2.4 Linear Functions
2.4 Linear Functions
 

Ähnlich wie data interpretation

StatProb.ppt
StatProb.pptStatProb.ppt
StatProb.pptUMESHK25
 
StatProb (1).ppt
StatProb (1).pptStatProb (1).ppt
StatProb (1).pptUMESHK25
 
StatProb (1).ppt
StatProb (1).pptStatProb (1).ppt
StatProb (1).pptUMESHK25
 
StatProb.ppt
StatProb.pptStatProb.ppt
StatProb.pptUMESHK25
 
Strayer mat 540 week 2 quiz 1 set 2 questions new
Strayer mat 540 week 2 quiz 1 set 2 questions newStrayer mat 540 week 2 quiz 1 set 2 questions new
Strayer mat 540 week 2 quiz 1 set 2 questions newcharlesangles123
 
Strayer mat 540 week 2 quiz 1 set 2 questions new
Strayer mat 540 week 2 quiz 1 set 2 questions newStrayer mat 540 week 2 quiz 1 set 2 questions new
Strayer mat 540 week 2 quiz 1 set 2 questions newerwinlewiss
 
Percentage and its applications /COMMERCIAL MATHEMATICS
Percentage and its applications /COMMERCIAL MATHEMATICSPercentage and its applications /COMMERCIAL MATHEMATICS
Percentage and its applications /COMMERCIAL MATHEMATICSindianeducation
 
Acc 350 wk 4 quiz 3 chapter 3
Acc 350 wk 4 quiz 3 chapter 3Acc 350 wk 4 quiz 3 chapter 3
Acc 350 wk 4 quiz 3 chapter 3fascinating_heart
 
Strayer mat 540 week 2 quiz 1 set 2 questions new
Strayer mat 540 week 2 quiz 1 set 2 questions newStrayer mat 540 week 2 quiz 1 set 2 questions new
Strayer mat 540 week 2 quiz 1 set 2 questions newBartholomee
 
Placement papers of all it and non it companies
Placement papers of all it and non it companiesPlacement papers of all it and non it companies
Placement papers of all it and non it companiesSachin Sharma
 
Sem 1 SMU mba spring assignments
Sem 1 SMU mba spring assignmentsSem 1 SMU mba spring assignments
Sem 1 SMU mba spring assignmentssolved_assignments
 
Business Mathematics XII - Hissan 2078
Business Mathematics XII - Hissan 2078Business Mathematics XII - Hissan 2078
Business Mathematics XII - Hissan 2078YEP Nepal
 
Strayer mat 540 week 2 quiz 1 set 2 questions new
Strayer mat 540 week 2 quiz 1 set 2 questions newStrayer mat 540 week 2 quiz 1 set 2 questions new
Strayer mat 540 week 2 quiz 1 set 2 questions neweyavagal
 
Strayer mat 540 week 2 quiz 1 set 2 questions new
Strayer mat 540 week 2 quiz 1 set 2 questions newStrayer mat 540 week 2 quiz 1 set 2 questions new
Strayer mat 540 week 2 quiz 1 set 2 questions neweyavagal
 
Strayer mat 540 week 2 quiz 1 set 2 questions new
Strayer mat 540 week 2 quiz 1 set 2 questions newStrayer mat 540 week 2 quiz 1 set 2 questions new
Strayer mat 540 week 2 quiz 1 set 2 questions neweyavagal
 
DATA INTERPRETATION.pptx
DATA INTERPRETATION.pptxDATA INTERPRETATION.pptx
DATA INTERPRETATION.pptxRatneshCrypto
 
Mb0040 statistics for management spring2015_assignment- SMU_MBA-Solved-Assign...
Mb0040 statistics for management spring2015_assignment- SMU_MBA-Solved-Assign...Mb0040 statistics for management spring2015_assignment- SMU_MBA-Solved-Assign...
Mb0040 statistics for management spring2015_assignment- SMU_MBA-Solved-Assign...pkharb
 
As mentioned earlier, the mid-term will have conceptual and quanti.docx
As mentioned earlier, the mid-term will have conceptual and quanti.docxAs mentioned earlier, the mid-term will have conceptual and quanti.docx
As mentioned earlier, the mid-term will have conceptual and quanti.docxfredharris32
 

Ähnlich wie data interpretation (20)

StatProb.ppt
StatProb.pptStatProb.ppt
StatProb.ppt
 
StatProb (1).ppt
StatProb (1).pptStatProb (1).ppt
StatProb (1).ppt
 
StatProb (1).ppt
StatProb (1).pptStatProb (1).ppt
StatProb (1).ppt
 
StatProb.ppt
StatProb.pptStatProb.ppt
StatProb.ppt
 
Sem 1
Sem 1Sem 1
Sem 1
 
Strayer mat 540 week 2 quiz 1 set 2 questions new
Strayer mat 540 week 2 quiz 1 set 2 questions newStrayer mat 540 week 2 quiz 1 set 2 questions new
Strayer mat 540 week 2 quiz 1 set 2 questions new
 
Strayer mat 540 week 2 quiz 1 set 2 questions new
Strayer mat 540 week 2 quiz 1 set 2 questions newStrayer mat 540 week 2 quiz 1 set 2 questions new
Strayer mat 540 week 2 quiz 1 set 2 questions new
 
Percentage and its applications /COMMERCIAL MATHEMATICS
Percentage and its applications /COMMERCIAL MATHEMATICSPercentage and its applications /COMMERCIAL MATHEMATICS
Percentage and its applications /COMMERCIAL MATHEMATICS
 
Acc 350 wk 4 quiz 3 chapter 3
Acc 350 wk 4 quiz 3 chapter 3Acc 350 wk 4 quiz 3 chapter 3
Acc 350 wk 4 quiz 3 chapter 3
 
Demand Forcasting
Demand ForcastingDemand Forcasting
Demand Forcasting
 
Strayer mat 540 week 2 quiz 1 set 2 questions new
Strayer mat 540 week 2 quiz 1 set 2 questions newStrayer mat 540 week 2 quiz 1 set 2 questions new
Strayer mat 540 week 2 quiz 1 set 2 questions new
 
Placement papers of all it and non it companies
Placement papers of all it and non it companiesPlacement papers of all it and non it companies
Placement papers of all it and non it companies
 
Sem 1 SMU mba spring assignments
Sem 1 SMU mba spring assignmentsSem 1 SMU mba spring assignments
Sem 1 SMU mba spring assignments
 
Business Mathematics XII - Hissan 2078
Business Mathematics XII - Hissan 2078Business Mathematics XII - Hissan 2078
Business Mathematics XII - Hissan 2078
 
Strayer mat 540 week 2 quiz 1 set 2 questions new
Strayer mat 540 week 2 quiz 1 set 2 questions newStrayer mat 540 week 2 quiz 1 set 2 questions new
Strayer mat 540 week 2 quiz 1 set 2 questions new
 
Strayer mat 540 week 2 quiz 1 set 2 questions new
Strayer mat 540 week 2 quiz 1 set 2 questions newStrayer mat 540 week 2 quiz 1 set 2 questions new
Strayer mat 540 week 2 quiz 1 set 2 questions new
 
Strayer mat 540 week 2 quiz 1 set 2 questions new
Strayer mat 540 week 2 quiz 1 set 2 questions newStrayer mat 540 week 2 quiz 1 set 2 questions new
Strayer mat 540 week 2 quiz 1 set 2 questions new
 
DATA INTERPRETATION.pptx
DATA INTERPRETATION.pptxDATA INTERPRETATION.pptx
DATA INTERPRETATION.pptx
 
Mb0040 statistics for management spring2015_assignment- SMU_MBA-Solved-Assign...
Mb0040 statistics for management spring2015_assignment- SMU_MBA-Solved-Assign...Mb0040 statistics for management spring2015_assignment- SMU_MBA-Solved-Assign...
Mb0040 statistics for management spring2015_assignment- SMU_MBA-Solved-Assign...
 
As mentioned earlier, the mid-term will have conceptual and quanti.docx
As mentioned earlier, the mid-term will have conceptual and quanti.docxAs mentioned earlier, the mid-term will have conceptual and quanti.docx
As mentioned earlier, the mid-term will have conceptual and quanti.docx
 

Kürzlich hochgeladen

Single or Multiple melodic lines structure
Single or Multiple melodic lines structureSingle or Multiple melodic lines structure
Single or Multiple melodic lines structuredhanjurrannsibayan2
 
How to Give a Domain for a Field in Odoo 17
How to Give a Domain for a Field in Odoo 17How to Give a Domain for a Field in Odoo 17
How to Give a Domain for a Field in Odoo 17Celine George
 
Micro-Scholarship, What it is, How can it help me.pdf
Micro-Scholarship, What it is, How can it help me.pdfMicro-Scholarship, What it is, How can it help me.pdf
Micro-Scholarship, What it is, How can it help me.pdfPoh-Sun Goh
 
Exploring_the_Narrative_Style_of_Amitav_Ghoshs_Gun_Island.pptx
Exploring_the_Narrative_Style_of_Amitav_Ghoshs_Gun_Island.pptxExploring_the_Narrative_Style_of_Amitav_Ghoshs_Gun_Island.pptx
Exploring_the_Narrative_Style_of_Amitav_Ghoshs_Gun_Island.pptxPooja Bhuva
 
Basic Civil Engineering first year Notes- Chapter 4 Building.pptx
Basic Civil Engineering first year Notes- Chapter 4 Building.pptxBasic Civil Engineering first year Notes- Chapter 4 Building.pptx
Basic Civil Engineering first year Notes- Chapter 4 Building.pptxDenish Jangid
 
Understanding Accommodations and Modifications
Understanding  Accommodations and ModificationsUnderstanding  Accommodations and Modifications
Understanding Accommodations and ModificationsMJDuyan
 
Plant propagation: Sexual and Asexual propapagation.pptx
Plant propagation: Sexual and Asexual propapagation.pptxPlant propagation: Sexual and Asexual propapagation.pptx
Plant propagation: Sexual and Asexual propapagation.pptxUmeshTimilsina1
 
Jual Obat Aborsi Hongkong ( Asli No.1 ) 085657271886 Obat Penggugur Kandungan...
Jual Obat Aborsi Hongkong ( Asli No.1 ) 085657271886 Obat Penggugur Kandungan...Jual Obat Aborsi Hongkong ( Asli No.1 ) 085657271886 Obat Penggugur Kandungan...
Jual Obat Aborsi Hongkong ( Asli No.1 ) 085657271886 Obat Penggugur Kandungan...ZurliaSoop
 
How to Add New Custom Addons Path in Odoo 17
How to Add New Custom Addons Path in Odoo 17How to Add New Custom Addons Path in Odoo 17
How to Add New Custom Addons Path in Odoo 17Celine George
 
Interdisciplinary_Insights_Data_Collection_Methods.pptx
Interdisciplinary_Insights_Data_Collection_Methods.pptxInterdisciplinary_Insights_Data_Collection_Methods.pptx
Interdisciplinary_Insights_Data_Collection_Methods.pptxPooja Bhuva
 
Kodo Millet PPT made by Ghanshyam bairwa college of Agriculture kumher bhara...
Kodo Millet  PPT made by Ghanshyam bairwa college of Agriculture kumher bhara...Kodo Millet  PPT made by Ghanshyam bairwa college of Agriculture kumher bhara...
Kodo Millet PPT made by Ghanshyam bairwa college of Agriculture kumher bhara...pradhanghanshyam7136
 
Python Notes for mca i year students osmania university.docx
Python Notes for mca i year students osmania university.docxPython Notes for mca i year students osmania university.docx
Python Notes for mca i year students osmania university.docxRamakrishna Reddy Bijjam
 
TỔNG ÔN TẬP THI VÀO LỚP 10 MÔN TIẾNG ANH NĂM HỌC 2023 - 2024 CÓ ĐÁP ÁN (NGỮ Â...
TỔNG ÔN TẬP THI VÀO LỚP 10 MÔN TIẾNG ANH NĂM HỌC 2023 - 2024 CÓ ĐÁP ÁN (NGỮ Â...TỔNG ÔN TẬP THI VÀO LỚP 10 MÔN TIẾNG ANH NĂM HỌC 2023 - 2024 CÓ ĐÁP ÁN (NGỮ Â...
TỔNG ÔN TẬP THI VÀO LỚP 10 MÔN TIẾNG ANH NĂM HỌC 2023 - 2024 CÓ ĐÁP ÁN (NGỮ Â...Nguyen Thanh Tu Collection
 
80 ĐỀ THI THỬ TUYỂN SINH TIẾNG ANH VÀO 10 SỞ GD – ĐT THÀNH PHỐ HỒ CHÍ MINH NĂ...
80 ĐỀ THI THỬ TUYỂN SINH TIẾNG ANH VÀO 10 SỞ GD – ĐT THÀNH PHỐ HỒ CHÍ MINH NĂ...80 ĐỀ THI THỬ TUYỂN SINH TIẾNG ANH VÀO 10 SỞ GD – ĐT THÀNH PHỐ HỒ CHÍ MINH NĂ...
80 ĐỀ THI THỬ TUYỂN SINH TIẾNG ANH VÀO 10 SỞ GD – ĐT THÀNH PHỐ HỒ CHÍ MINH NĂ...Nguyen Thanh Tu Collection
 
On_Translating_a_Tamil_Poem_by_A_K_Ramanujan.pptx
On_Translating_a_Tamil_Poem_by_A_K_Ramanujan.pptxOn_Translating_a_Tamil_Poem_by_A_K_Ramanujan.pptx
On_Translating_a_Tamil_Poem_by_A_K_Ramanujan.pptxPooja Bhuva
 
FSB Advising Checklist - Orientation 2024
FSB Advising Checklist - Orientation 2024FSB Advising Checklist - Orientation 2024
FSB Advising Checklist - Orientation 2024Elizabeth Walsh
 
Towards a code of practice for AI in AT.pptx
Towards a code of practice for AI in AT.pptxTowards a code of practice for AI in AT.pptx
Towards a code of practice for AI in AT.pptxJisc
 
COMMUNICATING NEGATIVE NEWS - APPROACHES .pptx
COMMUNICATING NEGATIVE NEWS - APPROACHES .pptxCOMMUNICATING NEGATIVE NEWS - APPROACHES .pptx
COMMUNICATING NEGATIVE NEWS - APPROACHES .pptxannathomasp01
 
2024-NATIONAL-LEARNING-CAMP-AND-OTHER.pptx
2024-NATIONAL-LEARNING-CAMP-AND-OTHER.pptx2024-NATIONAL-LEARNING-CAMP-AND-OTHER.pptx
2024-NATIONAL-LEARNING-CAMP-AND-OTHER.pptxMaritesTamaniVerdade
 
HMCS Max Bernays Pre-Deployment Brief (May 2024).pptx
HMCS Max Bernays Pre-Deployment Brief (May 2024).pptxHMCS Max Bernays Pre-Deployment Brief (May 2024).pptx
HMCS Max Bernays Pre-Deployment Brief (May 2024).pptxEsquimalt MFRC
 

Kürzlich hochgeladen (20)

Single or Multiple melodic lines structure
Single or Multiple melodic lines structureSingle or Multiple melodic lines structure
Single or Multiple melodic lines structure
 
How to Give a Domain for a Field in Odoo 17
How to Give a Domain for a Field in Odoo 17How to Give a Domain for a Field in Odoo 17
How to Give a Domain for a Field in Odoo 17
 
Micro-Scholarship, What it is, How can it help me.pdf
Micro-Scholarship, What it is, How can it help me.pdfMicro-Scholarship, What it is, How can it help me.pdf
Micro-Scholarship, What it is, How can it help me.pdf
 
Exploring_the_Narrative_Style_of_Amitav_Ghoshs_Gun_Island.pptx
Exploring_the_Narrative_Style_of_Amitav_Ghoshs_Gun_Island.pptxExploring_the_Narrative_Style_of_Amitav_Ghoshs_Gun_Island.pptx
Exploring_the_Narrative_Style_of_Amitav_Ghoshs_Gun_Island.pptx
 
Basic Civil Engineering first year Notes- Chapter 4 Building.pptx
Basic Civil Engineering first year Notes- Chapter 4 Building.pptxBasic Civil Engineering first year Notes- Chapter 4 Building.pptx
Basic Civil Engineering first year Notes- Chapter 4 Building.pptx
 
Understanding Accommodations and Modifications
Understanding  Accommodations and ModificationsUnderstanding  Accommodations and Modifications
Understanding Accommodations and Modifications
 
Plant propagation: Sexual and Asexual propapagation.pptx
Plant propagation: Sexual and Asexual propapagation.pptxPlant propagation: Sexual and Asexual propapagation.pptx
Plant propagation: Sexual and Asexual propapagation.pptx
 
Jual Obat Aborsi Hongkong ( Asli No.1 ) 085657271886 Obat Penggugur Kandungan...
Jual Obat Aborsi Hongkong ( Asli No.1 ) 085657271886 Obat Penggugur Kandungan...Jual Obat Aborsi Hongkong ( Asli No.1 ) 085657271886 Obat Penggugur Kandungan...
Jual Obat Aborsi Hongkong ( Asli No.1 ) 085657271886 Obat Penggugur Kandungan...
 
How to Add New Custom Addons Path in Odoo 17
How to Add New Custom Addons Path in Odoo 17How to Add New Custom Addons Path in Odoo 17
How to Add New Custom Addons Path in Odoo 17
 
Interdisciplinary_Insights_Data_Collection_Methods.pptx
Interdisciplinary_Insights_Data_Collection_Methods.pptxInterdisciplinary_Insights_Data_Collection_Methods.pptx
Interdisciplinary_Insights_Data_Collection_Methods.pptx
 
Kodo Millet PPT made by Ghanshyam bairwa college of Agriculture kumher bhara...
Kodo Millet  PPT made by Ghanshyam bairwa college of Agriculture kumher bhara...Kodo Millet  PPT made by Ghanshyam bairwa college of Agriculture kumher bhara...
Kodo Millet PPT made by Ghanshyam bairwa college of Agriculture kumher bhara...
 
Python Notes for mca i year students osmania university.docx
Python Notes for mca i year students osmania university.docxPython Notes for mca i year students osmania university.docx
Python Notes for mca i year students osmania university.docx
 
TỔNG ÔN TẬP THI VÀO LỚP 10 MÔN TIẾNG ANH NĂM HỌC 2023 - 2024 CÓ ĐÁP ÁN (NGỮ Â...
TỔNG ÔN TẬP THI VÀO LỚP 10 MÔN TIẾNG ANH NĂM HỌC 2023 - 2024 CÓ ĐÁP ÁN (NGỮ Â...TỔNG ÔN TẬP THI VÀO LỚP 10 MÔN TIẾNG ANH NĂM HỌC 2023 - 2024 CÓ ĐÁP ÁN (NGỮ Â...
TỔNG ÔN TẬP THI VÀO LỚP 10 MÔN TIẾNG ANH NĂM HỌC 2023 - 2024 CÓ ĐÁP ÁN (NGỮ Â...
 
80 ĐỀ THI THỬ TUYỂN SINH TIẾNG ANH VÀO 10 SỞ GD – ĐT THÀNH PHỐ HỒ CHÍ MINH NĂ...
80 ĐỀ THI THỬ TUYỂN SINH TIẾNG ANH VÀO 10 SỞ GD – ĐT THÀNH PHỐ HỒ CHÍ MINH NĂ...80 ĐỀ THI THỬ TUYỂN SINH TIẾNG ANH VÀO 10 SỞ GD – ĐT THÀNH PHỐ HỒ CHÍ MINH NĂ...
80 ĐỀ THI THỬ TUYỂN SINH TIẾNG ANH VÀO 10 SỞ GD – ĐT THÀNH PHỐ HỒ CHÍ MINH NĂ...
 
On_Translating_a_Tamil_Poem_by_A_K_Ramanujan.pptx
On_Translating_a_Tamil_Poem_by_A_K_Ramanujan.pptxOn_Translating_a_Tamil_Poem_by_A_K_Ramanujan.pptx
On_Translating_a_Tamil_Poem_by_A_K_Ramanujan.pptx
 
FSB Advising Checklist - Orientation 2024
FSB Advising Checklist - Orientation 2024FSB Advising Checklist - Orientation 2024
FSB Advising Checklist - Orientation 2024
 
Towards a code of practice for AI in AT.pptx
Towards a code of practice for AI in AT.pptxTowards a code of practice for AI in AT.pptx
Towards a code of practice for AI in AT.pptx
 
COMMUNICATING NEGATIVE NEWS - APPROACHES .pptx
COMMUNICATING NEGATIVE NEWS - APPROACHES .pptxCOMMUNICATING NEGATIVE NEWS - APPROACHES .pptx
COMMUNICATING NEGATIVE NEWS - APPROACHES .pptx
 
2024-NATIONAL-LEARNING-CAMP-AND-OTHER.pptx
2024-NATIONAL-LEARNING-CAMP-AND-OTHER.pptx2024-NATIONAL-LEARNING-CAMP-AND-OTHER.pptx
2024-NATIONAL-LEARNING-CAMP-AND-OTHER.pptx
 
HMCS Max Bernays Pre-Deployment Brief (May 2024).pptx
HMCS Max Bernays Pre-Deployment Brief (May 2024).pptxHMCS Max Bernays Pre-Deployment Brief (May 2024).pptx
HMCS Max Bernays Pre-Deployment Brief (May 2024).pptx
 

data interpretation

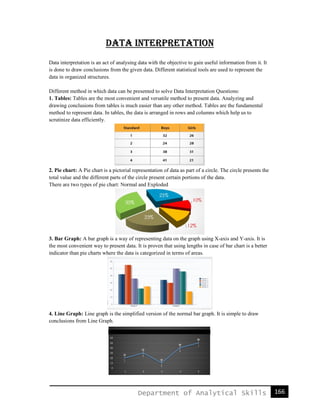
  • 1. 166Department of Analytical Skills DATA INTERPRETATION Data interpretation is an act of analysing data with the objective to gain useful information from it. It is done to draw conclusions from the given data. Different statistical tools are used to represent the data in organized structures. Different method in which data can be presented to solve Data Interpretation Questions: 1. Tables: Tables are the most convenient and versatile method to present data. Analyzing and drawing conclusions from tables is much easier than any other method. Tables are the fundamental method to represent data. In tables, the data is arranged in rows and columns which help us to scrutinize data efficiently. 2. Pie chart: A Pie chart is a pictorial representation of data as part of a circle. The circle presents the total value and the different parts of the circle present certain portions of the data. There are two types of pie chart: Normal and Exploded 3. Bar Graph: A bar graph is a way of representing data on the graph using X-axis and Y-axis. It is the most convenient way to present data. It is proven that using lengths in case of bar chart is a better indicator than pie charts where the data is categorized in terms of areas. 4. Line Graph: Line graph is the simplified version of the normal bar graph. It is simple to draw conclusions from Line Graph.
  • 2. 167Department of Analytical Skills 5. Mixed Graph: Pie Chart along with tabular data, bar graph along with tabular data. Some important tricks to solve data interpretation questions: 1. Memorize some fractional and percentage values. 2. Don’t waste time with lengthy calculations. Try to solve questions with approximation. 3. Use previous calculation if needed again. 4. Important topics to concentrate in data interpretation is Ratios, Percentages and Average. 5. Don’t assume anything, There are few questions which ask to find out some data which is not available. Always be alert enough to see whether the data given is enough to answer the question or not and do not answer the question based on assumptions. Example 1: Study the following table and answer the questions. Classification of 100 Students based on the Marks Obtained by them in Physics and Chemistry in an Examination. Subject Marks out of 50 40 and above 30 and above 20 and above 10 and above 0 and above Physics 9 32 80 92 100 Chemistry 4 21 66 81 100 Average (Aggregate) 7 27 73 87 100 I. What is the different between the number of students passed with 30 as cut-off marks in Chemistry and those passed with 30 as cut-off marks in aggregate? Solution: Required difference = (No. of students scoring 30 and above marks in Chemistry) – (Number of students scoring 30 and above marks in aggregate) = 27 – 21 = 6. II. If at least 60% marks in Physics are required for pursuing higher studies in Physics, how many students will be eligible to pursue higher studies in Physics? Solution:
  • 3. 168Department of Analytical Skills III. The percentage of number of students getting at least 60% marks in Chemistry over those getting at least 40% marks in aggregate, is approximately? Solution: Example 2: The following pie chart shows the amount of subscriptions generated for India Bonds from different categories of investors. Subscriptions Generated for India Bonds I. In the corporate sector, approximately how many degrees should be there in the central angle? Solution: Since 1% = 3.6 degrees Corporate Houses = 34% 34 x 3.6 = 122.40 II. If the investment by NRI’s are Rs 4,000 crore, then the investments by corporate houses and FII’s together is: Solution: Corporate Houses and FII’s together = 34 + 33 = 67% NRI = 11% Total investment by Corporate Houses and FII’s together = (67/11) x 4000 = 24, 363.6364 III. If the total investment other than by FII and corporate houses is Rs 335,000 crore, then the investment by NRI’s and Offshore funds will be (approximately)? Solution: Investment other than NRI and corporate houses is 33% = 335000. Also, investment by offshore funds and NRI’s is equal to 27%. Hence, 27 x 335,000/33 = 274, 090.909
  • 4. 169Department of Analytical Skills Example 3: The following bar graph shows the Income and Expenditures (in million US $) of five companies in the year 2001. The percent profit or loss of a company is given by Income and Expenditure (in million US $) of five companies in the year 2001 I. The companies M and N together had a percentage of profit/loss of? Solution: II. In 2001, what was the approximate percentage of profit/loss of all the five Companies taken together? Solution:
  • 5. 170Department of Analytical Skills III. Which company earned the maximum percentage profit in the year 2001? Solution: IV. For Company R, if the expenditure had increased by 20% in year 2001 from year 2000 and the company had earned profit of 10% in 2000, what was the Company’s income in 2000 (in million US $)? Solution: Example 4: The following line graph gives the percentage of the number of candidates who qualified an examination out of the total number of candidates who appeared for the examination over a period of seven years from 1994 to 2000. Percentage of Candidates Qualified to Appeared in an Examination Over the Years
  • 6. 171Department of Analytical Skills I. The difference between the percentages of candidates qualified to appear was maximum in which of the following pairs of years? Solution: The differences between the percentages of candidates qualified to appear for the give pairs of years are: For 1994 and 1995 = 50 – 30 = 20 For 1998 and 1999 = 80 – 80 = 0 For 1994 and 1997 = 50 – 30 = 20 For 1997 and 1998 = 80 – 50 = 30 For 1999 and 2000 = 80 – 60 = 20 Thus, the maximum difference is between the years 1997 and 1998. II. If the number of candidates qualified in 1998 was 21200, what was the number of candidates appeared in 1998? Solution: III. If the total number of candidates appeared in 1996 and 1997 together was 47400, then the total number of candidates qualified in these two years together was? Solution: The total number of candidates qualified in 1996 and 1997 together, cannot be determined until we know at least, the number of candidates appeared in any one of the two years 1996 or 1997 or the percentage of candidates qualified to appeared in 1996 and 1997 together. Hence, the data is inadequate IV. The total number of candidates qualified in 1999 and 2000 together was 33500 and the number of candidates appeared in 1999 was 26500. What was the number of candidates in 2000? Solution:
  • 7. 172Department of Analytical Skills Example 5: Study the following information carefully and answer the question given below: Pie chart shows the production of rice by 5 different factories and line chart shows the percentage of sale. Total production = 3600 kg I. In which of the following factory the sale of rice is the highest? Solution: Sale of rice by factory M = 3600 × 20% × 60% = 432 kg Sale of rice by factory N = 3600 × 15% × 80% = 432 kg Sale of rice by factory O = 3600 × 18% × 75% = 486 kg Sale of rice by factory P = 3600 × 25% × 88% = 792 kg Sale of rice by factory Q = 3600 × 22% × 75% = 594 kg Sale of rice of factory P is the highest. II. Rice sold by factory M and N together is how much percent more than the production of rice by factory M? Solution: Rice sold by factory M = 3600 × 20% × 60% = 432 kg Rice sold by factory N = 3600 × 15% × 80% = 432 kg Production of rice by factory M = 3600 × 20% = 720 kg % more = {[432 + 432 – 720] × 100} / 720 = (144 × 100) / 720= 20% III. If the cost price of rice is Rs 45 per kg and profit earned by factory Q on 1 kg rice is 20% of the cost price, find the total profit earned by factory Q. Solution: Rice sold by factory Q = 3600 × 22% × 75% = 594 kg Profit on 1 kg rice = 45 × 20% = Rs 9 Total profit = 9 × 594 = Rs 5346
  • 8. 173Department of Analytical Skills IV. What percent of total rice has been sold by all the factory? Solution: Sale of rice by factory M = 3600 × 20% × 60% = 432 kg Sale of rice by factory N = 3600 × 15% × 80% = 432 kg Sale of rice by factory O = 3600 × 18% × 75% = 486 kg Sale of rice by factory P = 3600 × 25% × 88% = 792 kg Sale of rice by factory Q = 3600 × 22% × 75% = 594 kg Total sale = 432 + 432 + 486 + 792 + 594 = 2736 kg Required % = (2736 × 100) / 3600 = 76% V. What is the ratio of rice sold by factory P and Q together to the rice sold by factory N and O together? Solution: Rice sold by factory P = 3600 × 25% × 88% = 792 kg Rice sold by factory Q = 3600 × 22% × 75% = 594 kg Rice sold by factory N = 3600 × 15% × 80% = 432 kg Rice sold by factory O = 3600 × 18% × 75% = 486 kg Required Ratio = 792 + 594 : 432 + 486 = 1386 : 918 = 77 : 51
  • 9. 174Department of Analytical Skills LEVEL – I Directions (1-3): Classification of 100 students based on the marks obtained by them in Physics and Chemistry in an examination. 1. If at least 60% marks in Physics are required for pursuing higher studies in Physics, how many students will be eligible to pursue higher studies in Physics? A. 27 B. 32 C. 34 D. 41 2. The percentage of the number of students getting at least 60% marks in Chemistry over those getting at least 40% marks in aggregate, is approximately: A. 21% B. 27% C. 29% D. 31% 3. If it is known the at least 23 students were eligible for a Symposium on Chemistry, the minimum qualifying marks in Chemistry for eligibility to Symposium would lie in the range: A. 40-50 B. 30-40 C. 20-30 D. Cannot be determined Directions (4-6): Study the following bar graph and answer the questions that follow: Total monthly income = Rs. 50,000 4. What amount is spent on food? A. Rs. 10,000 B. Rs. 15,000 C. Rs. 20,000 D. Rs. 30,000 5. How much more money is spent on clothing and housing together than on transportation? A. Rs. 1,000 B. Rs. 5,000 C. Rs. 2,000 D. Rs. 2,500 6. What percent of amount on food is spent as amount on education? A. 10% B. 40% C. 25% D. 20%
  • 10. 175Department of Analytical Skills Directions (7-9): Study the pie chart below and answer the questions that follow: The above pie chart shows the sales of four different types of articles in a shop. 7. What is the central angle of type A? A. 128 degrees B. 126 degrees C. 136 degrees D. 140 degrees 8. If the total sale is 1200, what is the sale of B? A. 120 B. 360 C. 260 D. 240 9. What is the difference between the central angle of A and D? A. 108 degrees B. 120 degrees C. 96 degrees D. 130 degrees Directions (10-14): The following table shows the number of boys and girls of different schools that have participated in a scholarship test over five years. 10. How many girls more participated in year 2004 as compared to 2003 for all schools taken together? A. 110 B. 370 C. 480 D. 210 11. The ratio of boys: girls for school B over the years 2001-2004 is? A. 17:34 B. 14:37 C. 37:10 D. 34:17 12. The percentage increase in participation of boys from school B in 2004 over those in 2001 is nearly? A. 28% B. 71% C. 72% D. 72% 13. The total number of participants in year 2003 is A. 2000 B. 1830 C. 1720 D. 1640
  • 11. 176Department of Analytical Skills 14. In year 2004 the number of participating girls is what percent of number of participating boys? A. 17:56 B. 56:17 C. 57:16 D. 16:57 Directions (15-17): These questions are based on the line graph below. (in Rs. lakhs) Total Cost = Manufacturing Cost + Advertising Cost 15. For which of the following cars is the manufacturing cost as a percentage of advertising cost the least? A. Xing B. City C. Lancer D. Zen 16. In a certain year, 30, 000 "City" cars, are produced, and are sold at Rs. 9.3 lacs/car. If 2% of the total profit is given as a bonus to the 2,040 engineers, the amount received by each engineer as bonus is (in Rs.) A. 5, 000 B. 50, 000 C. 5 lacs D. None of these 17. The company that manufactures Zen produces 500 Zen cars per day while the company that manufactures City produces 600 City per day. They sell them at Rs. 6 lacs/car and Rs. 8.4 lacs/car respectively. The profit made by the former is approximately what percentage of that of the latter? A. 100% B. 156% C. 250% D. None of these Directions (18-20): The bar graph given below shows the percentage distribution of the total expenditures of a company under various expense heads during 2003. Percentage Distribution of Total Expenditure of a Company
  • 12. 177Department of Analytical Skills 18. The expenditure on the interest on loans is by what percent more than the expenditure on transport? A. 5% B. 40% C. 20% D. 10% 19. If the interest on loans amounted to Rs. 2.45 crores then the total amount of expenditure on advertisement, taxes and research and development is? A. Rs. 7 crores B. Rs. 5.4 crores C. Rs. 4.2 crores D. Rs. 3 crores 20. The total amount of expenditures of the company is how many times of expenditure on research and development? A. 20 B. 27 C. 18 D. 8 LEVEL – II Directions (1-4): Study the following table carefully to answer these questions: Number of workers employed in six units of a factory over the years. 1. In the year 2000 the number of workers employed by unit 'C' is what percent of the total number of workers employed by all the units in the same year (rounded off to two places of decimal)? A. 16.39 B. 17.21 C. 16.88 D. None of these 2. For all the given years what is the difference between the average number of workers in units D and E? A. 37 B. 33 C. 32 (2/3) D. 37 (1/3) 3. In which year is the percentage increase/decrease in the number of workers employed the minimum for unit 'F'? A. 2003 B. 1999 C. 2002 D. 2000 4. What is the approximate ratio of the number of workers employed in all the units in 1998 to that in 1999? A. 13:14 B. 37:36 C. 10:9 D. 13:11
  • 13. 178Department of Analytical Skills Directions (5-7): Pie chart shows the percent of money spent by family on various item during 1999. Study the graph and answer these questions. 5. If the total amount spent was Rs. 46,000, how much money was spent on clothing and housing together? A. Rs. 11500 B. Rs. 1150 C. Rs. 10000 D. Rs. 15000 6. The ratio of the total amount of money spent on housing to that spent on education was A. 5:2 B. 2:5 C. 4:5 D. 5:4 7. If the total amount spent during the year 1998 was Rs.46000, the amount spent on food was: A. Rs. 12447 B. Rs. 15000 C. Rs. 6900 D. Rs. 3067 approx. Directions (8-10): These questions are based on the circle graph which shows the expenditure incurred in bringing out a book by a publisher. 8. What should be the central angle of the sector for transportation charges? A. 4o B. 14.4o C. 12.4o D. 8.4o 9. If the advertisement charges amount to Rs. 18,000, the total expenditure incurred in bringing out the book is Rs. A. 60,300 B. 63,000 C. 9,000 D. 1,00,000 10. If the author's royalties amount to Rs. 30,000, the binder's charges amount to Rs.
  • 14. 179Department of Analytical Skills A. 6,000 B. 10,500 C. 12,000 D. 15,000 Directions (11-15): Study the following graph to answer these questions: Percent profit earned by two companies A & B over the years. Profit = Income - Expenditure % Profit = Profit/Expenditure * 100 11. If the income of company A in 1998 was Rs. 1,42,500 what was its expenditure in that year? A. 1,05,000 B. 95,000 C. 99,500 D. 1,05,555 12. Expenditure of company B in 1999 was 90% of its expenditure in 1998. Income of company B in 1999 was what percent of its income in 1998? A. 130.5 B. 96 (2/3) C. 121.5 D. 93 (1/3) 13. If the expenditure of company A in 1997 was Rs. 70 lakhs and income of company A in 1997 was equal to its expenditure in 1998, what was the total income (in Rs. lakh) of the company A in 1997 & 1998 together? A. 175 B. 131.25 C. 218.75 D. Cannot be determined 14. Expenditure of company B in years 1996 and 1997 were in the ratio of 5:7 respectively. What was the respective ratio of their incomes? A. 10:13 B. 8:13 C. 13:14 D. 11:14 15. Total expenditure of companies A & B together in 2001 was Rs. 13.5 lakhs. What was the total income of the two companies (in Rs. lakh) in that year? A. 19.575 B. 20.25 C. 19.75 D. Cannot be determined
  • 15. 180Department of Analytical Skills Directions (16-19): The following questions are based on the stacked bar graph given below. Sales of various precious stones in India for the period of 1995-1996 to 1999-2000 16. What is the total sale of ruby as a percent of the total sales of precious stones for the given period? A. 17.3% B. 19.23% C. 23.1% D. None of these 17. By what percent is the average annual sale of Emerald for the given period more than the sales of Opal in 1998-1999? A. 120% B. 50% C. 25% D. 40% 18. For how many years is the sale of Bezel as a percentage of the total sales of precious stones less than that of Topaz? A. One B. Two C. Three D. Four 19. If the sales of Topaz increased from 1994-1995 to 1995-1996 by 25% and increased from 1999- 2000 to 2000-01 by 50%, then what is the difference between the sales of Topaz in 1994-95 and that in 2000-01? A. 50, 000 tonnes B. 100, 000 tonnes C. 140, 000 tonnes D. 160, 000 tonnes 20. Which of the given stones experienced highest percentage growth in its sale in any year over that of the previous year over theprevious 1996-97 to 1999-2000 A. Topaz B. Emerald C. Ruby D. Bezel