

Empfohlen
Empfohlen
Weitere ähnliche Inhalte
Was ist angesagt?
Was ist angesagt? (19)
Andere mochten auch
Andere mochten auch (20)
Ähnlich wie Tables for april 2015 release
Ähnlich wie Tables for april 2015 release (20)
Mehr von KerryAnn Snopek-Douglas
Mehr von KerryAnn Snopek-Douglas (20)
Kürzlich hochgeladen
Kürzlich hochgeladen (20)
Tables for april 2015 release
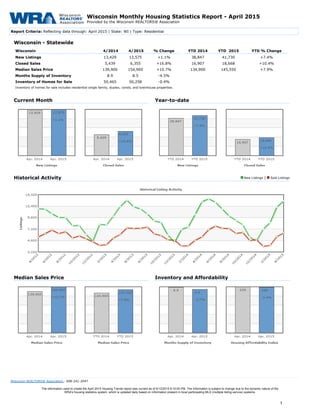
- 1. Wisconsin Monthly Housing Statistics Report - April 2015 Provided by the Wisconsin REALTORS® Association Report Criteria: Reflecting data through: April 2015 | State: WI | Type: Residential Wisconsin - Statewide Wisconsin 4/2014 4/2015 % Change YTD 2014 YTD 2015 YTD % Change New Listings 13,429 13,575 +1.1% 38,847 41,730 +7.4% Closed Sales 5,439 6,355 +16.8% 16,907 18,668 +10.4% Median Sales Price 139,900 154,900 +10.7% 134,900 145,550 +7.9% Months Supply of Inventory 8.9 8.5 -4.5% Inventory of Homes for Sale 50,465 50,258 -0.4% Inventory of homes for sale includes residential single family, duplex, condo, and townhouse properties. Current Month Year-to-date Historical Activity New Listings | Sold Listings Median Sales Price Inventory and Affordability Wisconsin REALTORS® Association · 608-241-2047 The information used to create the April 2015 Housing Trends report was current as of 5/13/2015 9:10:00 PM. The information is subject to change due to the dynamic nature of the WRA's housing statistics system, which is updated daily based on information present in local participating MLS (multiple listing service) systems. 1
- 2. Wisconsin Regional Report Provided by the Wisconsin REALTORS® Association Report Criteria: Reflecting data through: April 2015 | State: WI | Type: Residential Median Price Sales Region County 4/2015 4/2014 % Change 4/2015 4/2014 % Change Southeast Kenosha 137,250 122,500 +12.0% 184 180 +2.2% Southeast Milwaukee 134,900 115,000 +17.3% 843 839 +0.5% Southeast Ozaukee 235,000 219,950 +6.8% 110 88 +25.0% Southeast Racine 145,000 117,200 +23.7% 231 176 +31.2% Southeast Sheboygan 117,950 114,900 +2.7% 132 111 +18.9% Southeast Walworth 168,250 160,000 +5.2% 154 117 +31.6% Southeast Washington 195,000 169,900 +14.8% 161 142 +13.4% Southeast Waukesha 241,500 230,000 +5.0% 478 400 +19.5% Southeast Regional Total 169,150 145,000 +16.7% 2,293 2,053 +11.7% Median Price Sales Region County 4/2015 4/2014 % Change 4/2015 4/2014 % Change Milwaukee Milwaukee 134,900 115,000 +17.3% 843 839 +0.5% Milwaukee Ozaukee 235,000 219,950 +6.8% 110 88 +25.0% Milwaukee Washington 195,000 169,900 +14.8% 161 142 +13.4% Milwaukee Waukesha 241,500 230,000 +5.0% 478 400 +19.5% Milwaukee Regional Total 183,500 154,500 +18.8% 1,592 1,469 +8.4% Median Price Sales Region County 4/2015 4/2014 % Change 4/2015 4/2014 % Change South Central Columbia 152,000 138,000 +10.1% 66 73 -9.6% South Central Crawford 109,000 116,000 -6.0% 10 13 -23.1% South Central Dane 229,900 209,950 +9.5% 743 600 +23.8% South Central Dodge 119,000 125,555 -5.2% 81 69 +17.4% South Central Grant 122,500 102,500 +19.5% 32 38 -15.8% South Central Green 173,000 109,000 +58.7% 47 43 +9.3% South Central Iowa 134,900 120,000 +12.4% 19 23 -17.4% South Central Jefferson 154,450 137,500 +12.3% 80 81 -1.2% South Central Lafayette NA NA NA 9 9 0% South Central Richland 69,000 128,000 -46.1% 21 10 +110.0% South Central Rock 114,900 115,000 -0.1% 185 169 +9.5% South Central Sauk 163,600 155,000 +5.5% 77 67 +14.9% South Central Regional Total 185,000 169,000 +9.5% 1,370 1,195 +14.6% 2
- 3. Median Price Sales Region County 4/2015 4/2014 % Change 4/2015 4/2014 % Change West Buffalo NA NA NA 6 9 -33.3% West Chippewa 141,500 127,900 +10.6% 64 39 +64.1% West Dunn 157,500 120,000 +31.2% 51 45 +13.3% West Eau Claire 142,475 132,500 +7.5% 134 97 +38.1% West Jackson 107,500 141,250 -23.9% 17 18 -5.6% West La Crosse 135,000 133,500 +1.1% 104 88 +18.2% West Monroe 115,000 130,000 -11.5% 30 33 -9.1% West Pepin 124,000 NA NA 16 2 +700% West Pierce 165,000 156,750 +5.3% 32 36 -11.1% West St. Croix 189,900 186,400 +1.9% 119 89 +33.7% West Trempealeau 123,200 86,420 +42.6% 20 16 +25.0% West Vernon 165,000 87,500 +88.6% 19 20 -5.0% West Regional Total 152,000 135,000 +12.6% 612 492 +24.4% Median Price Sales Region County 4/2015 4/2014 % Change 4/2015 4/2014 % Change Northeast Brown 146,800 143,000 +2.7% 289 261 +10.7% Northeast Calumet 175,450 162,940 +7.7% 48 55 -12.7% Northeast Door 225,000 117,500 +91.5% 37 30 +23.3% Northeast Fond du Lac 113,000 122,000 -7.4% 87 81 +7.4% Northeast Green Lake 136,000 117,450 +15.8% 19 22 -13.6% Northeast Kewaunee 80,950 106,300 -23.8% 18 12 +50.0% Northeast Manitowoc 82,000 90,000 -8.9% 87 67 +29.9% Northeast Marinette 94,500 73,000 +29.5% 41 44 -6.8% Northeast Menominee NA NA NA NA 2 NA Northeast Oconto 110,000 117,000 -6.0% 47 37 +27.0% Northeast Outagamie 144,900 129,950 +11.5% 215 152 +41.4% Northeast Shawano 105,000 78,950 +33.0% 31 32 -3.1% Northeast Waupaca 125,950 111,000 +13.5% 50 49 +2.0% Northeast Winnebago 119,000 119,950 -0.8% 193 148 +30.4% Northeast Regional Total 132,000 122,000 +8.2% 1,162 992 +17.1% 3
- 4. Median Price Sales Region County 4/2015 4/2014 % Change 4/2015 4/2014 % Change Central Adams 90,825 75,900 +19.7% 41 33 +24.2% Central Clark 121,500 63,500 +91.3% 23 16 +43.8% Central Juneau 100,000 126,500 -20.9% 39 21 +85.7% Central Marathon 120,000 115,000 +4.3% 147 90 +63.3% Central Marquette 82,000 78,000 +5.1% 19 17 +11.8% Central Portage 119,550 121,000 -1.2% 60 52 +15.4% Central Waushara 97,500 79,500 +22.6% 27 28 -3.6% Central Wood 109,500 67,900 +61.3% 79 51 +54.9% Central Regional Total 115,000 99,950 +15.1% 435 308 +41.2% Median Price Sales Region County 4/2015 4/2014 % Change 4/2015 4/2014 % Change North Ashland 45,000 93,000 -51.6% 17 15 +13.3% North Barron 120,500 109,000 +10.6% 75 57 +31.6% North Bayfield 112,000 125,000 -10.4% 20 15 +33.3% North Burnett 160,950 99,000 +62.6% 28 38 -26.3% North Douglas 135,000 112,000 +20.5% 33 30 +10.0% North Florence NA NA NA 3 2 +50.0% North Forest NA NA NA 7 4 +75.0% North Iron NA NA NA 4 4 0% North Langlade 90,444 39,900 +126.7% 22 23 -4.3% North Lincoln 101,000 98,000 +3.1% 29 30 -3.3% North Oneida 163,500 152,500 +7.2% 48 36 +33.3% North Polk 137,750 116,000 +18.8% 46 44 +4.5% North Price 97,000 80,000 +21.2% 25 16 +56.2% North Rusk 85,500 128,750 -33.6% 16 10 +60.0% North Sawyer 160,000 142,500 +12.3% 33 14 +135.7% North Taylor 112,250 NA NA 12 9 +33.3% North Vilas 138,750 153,250 -9.5% 24 26 -7.7% North Washburn 146,250 165,000 -11.4% 30 13 +130.8% North Regional Total 125,450 109,000 +15.1% 472 386 +22.3% Statewide Median Price Statewide Sales 4/2015 4/2014 % Change 4/2015 4/2014 % Change 154,900 139,900 +10.7% 6,355 5,439 +16.8% Wisconsin REALTORS® Association · 608-241-2047 4
- 5. Wisconsin Regional Report Provided by the Wisconsin REALTORS® Association Report Criteria: Reflecting data through: April 2015 | State: WI | Type: Residential Median Price Sales Region County YTD 2015 YTD 2014 % Change YTD 2015 YTD 2014 % Change Southeast Kenosha 133,200 110,000 +21.1% 559 573 -2.4% Southeast Milwaukee 120,000 107,000 +12.1% 2,707 2,625 +3.1% Southeast Ozaukee 233,000 215,000 +8.4% 311 281 +10.7% Southeast Racine 135,750 105,900 +28.2% 666 567 +17.5% Southeast Sheboygan 116,000 110,000 +5.5% 357 356 +0.3% Southeast Walworth 166,450 149,950 +11.0% 450 364 +23.6% Southeast Washington 194,500 170,000 +14.4% 448 434 +3.2% Southeast Waukesha 237,000 223,025 +6.3% 1,369 1,176 +16.4% Southeast Regional Total 155,250 139,000 +11.7% 6,867 6,376 +7.7% Median Price Sales Region County YTD 2015 YTD 2014 % Change YTD 2015 YTD 2014 % Change Milwaukee Milwaukee 120,000 107,000 +12.1% 2,707 2,625 +3.1% Milwaukee Ozaukee 233,000 215,000 +8.4% 311 281 +10.7% Milwaukee Washington 194,500 170,000 +14.4% 448 434 +3.2% Milwaukee Waukesha 237,000 223,025 +6.3% 1,369 1,176 +16.4% Milwaukee Regional Total 166,000 150,000 +10.7% 4,835 4,516 +7.1% Median Price Sales Region County YTD 2015 YTD 2014 % Change YTD 2015 YTD 2014 % Change South Central Columbia 145,000 130,700 +10.9% 193 200 -3.5% South Central Crawford 83,000 105,000 -21.0% 29 39 -25.6% South Central Dane 222,000 203,952 +8.8% 2,038 1,738 +17.3% South Central Dodge 127,250 115,750 +9.9% 220 238 -7.6% South Central Grant 109,000 110,000 -0.9% 80 99 -19.2% South Central Green 150,000 125,000 +20.0% 137 107 +28.0% South Central Iowa 130,000 121,500 +7.0% 62 78 -20.5% South Central Jefferson 149,000 136,500 +9.2% 266 227 +17.2% South Central Lafayette 88,750 65,762 +35.0% 30 28 +7.1% South Central Richland 71,750 110,400 -35.0% 46 33 +39.4% South Central Rock 115,000 104,000 +10.6% 576 529 +8.9% South Central Sauk 149,000 140,000 +6.4% 202 190 +6.3% South Central Regional Total 176,750 163,000 +8.4% 3,879 3,506 +10.6% 5
- 6. Median Price Sales Region County YTD 2015 YTD 2014 % Change YTD 2015 YTD 2014 % Change West Buffalo 100,000 89,950 +11.2% 17 24 -29.2% West Chippewa 134,000 125,750 +6.6% 173 174 -0.6% West Dunn 127,000 109,000 +16.5% 132 119 +10.9% West Eau Claire 148,272 134,900 +9.9% 397 283 +40.3% West Jackson 95,500 120,000 -20.4% 56 39 +43.6% West La Crosse 144,450 138,250 +4.5% 342 288 +18.8% West Monroe 111,000 122,500 -9.4% 110 100 +10.0% West Pepin 100,000 90,000 +11.1% 35 11 +218.2% West Pierce 165,000 139,950 +17.9% 100 112 -10.7% West St. Croix 189,000 180,200 +4.9% 349 316 +10.4% West Trempealeau 122,500 85,000 +44.1% 64 44 +45.5% West Vernon 122,000 91,750 +33.0% 57 48 +18.8% West Regional Total 147,000 136,450 +7.7% 1,832 1,558 +17.6% Median Price Sales Region County YTD 2015 YTD 2014 % Change YTD 2015 YTD 2014 % Change Northeast Brown 143,325 141,200 +1.5% 810 770 +5.2% Northeast Calumet 159,500 144,500 +10.4% 156 149 +4.7% Northeast Door 175,500 143,000 +22.7% 108 102 +5.9% Northeast Fond du Lac 105,900 106,000 -0.1% 287 280 +2.5% Northeast Green Lake 118,000 115,000 +2.6% 56 52 +7.7% Northeast Kewaunee 86,500 108,250 -20.1% 59 40 +47.5% Northeast Manitowoc 82,500 85,000 -2.9% 255 206 +23.8% Northeast Marinette 80,685 75,000 +7.6% 122 105 +16.2% Northeast Menominee NA NA NA 7 4 +75.0% Northeast Oconto 100,000 92,700 +7.9% 124 117 +6.0% Northeast Outagamie 138,000 127,000 +8.7% 613 540 +13.5% Northeast Shawano 93,700 75,000 +24.9% 93 89 +4.5% Northeast Waupaca 111,000 97,250 +14.1% 157 156 +0.6% Northeast Winnebago 120,700 114,000 +5.9% 532 478 +11.3% Northeast Regional Total 125,000 120,000 +4.2% 3,379 3,088 +9.4% 6
- 7. Median Price Sales Region County YTD 2015 YTD 2014 % Change YTD 2015 YTD 2014 % Change Central Adams 99,950 80,000 +24.9% 108 101 +6.9% Central Clark 100,500 55,000 +82.7% 68 57 +19.3% Central Juneau 76,500 65,875 +16.1% 99 78 +26.9% Central Marathon 120,000 115,000 +4.3% 383 347 +10.4% Central Marquette 81,950 75,000 +9.3% 68 61 +11.5% Central Portage 130,000 129,000 +0.8% 168 147 +14.3% Central Waushara 97,500 95,000 +2.6% 70 75 -6.7% Central Wood 95,600 79,900 +19.6% 207 161 +28.6% Central Regional Total 110,000 99,000 +11.1% 1,171 1,027 +14.0% Median Price Sales Region County YTD 2015 YTD 2014 % Change YTD 2015 YTD 2014 % Change North Ashland 59,500 84,700 -29.8% 40 32 +25.0% North Barron 104,900 112,500 -6.8% 227 174 +30.5% North Bayfield 105,000 109,000 -3.7% 62 44 +40.9% North Burnett 138,000 107,000 +29.0% 131 124 +5.6% North Douglas 112,000 113,000 -0.9% 113 102 +10.8% North Florence NA NA NA 4 7 -42.9% North Forest 75,000 85,000 -11.8% 23 16 +43.8% North Iron 112,500 142,275 -20.9% 18 17 +5.9% North Langlade 67,000 49,900 +34.3% 83 63 +31.7% North Lincoln 92,750 90,000 +3.1% 84 84 0% North Oneida 143,000 131,750 +8.5% 139 142 -2.1% North Polk 121,950 105,000 +16.1% 190 205 -7.3% North Price 96,500 89,000 +8.4% 48 65 -26.2% North Rusk 79,900 84,750 -5.7% 41 24 +70.8% North Sawyer 137,000 150,182 -8.8% 84 62 +35.5% North Taylor 120,000 90,000 +33.3% 29 23 +26.1% North Vilas 150,000 160,000 -6.2% 96 74 +29.7% North Washburn 117,450 135,000 -13.0% 94 64 +46.9% North Regional Total 111,500 110,000 +1.4% 1,506 1,322 +13.9% Statewide Median Price Statewide Sales YTD 2015 YTD 2014 % Change YTD 2015 YTD 2014 % Change 145,550 134,900 +7.9% 18,668 16,907 +10.4% Wisconsin REALTORS® Association · 608-241-2047 7