
Empfohlen
Empfohlen
Weitere ähnliche Inhalte
Was ist angesagt?
Was ist angesagt? (20)
Ähnlich wie Suloooooo
Ähnlich wie Suloooooo (20)
Kürzlich hochgeladen
Kürzlich hochgeladen (20)
Suloooooo
- 1. 1 I. Introduction Education gives us knowledge of the world around us and changes individuals into someone better. It develops in us a perspective of looking at life. However, there are few students who sometimes attend the class irregularly. In fact, some students attend classes based only on the subject they like. Absenteeism in school is the habit of staying away from school without providing a genuine or any reason for not attending classes. Also it is one of the indiscipline aspects in schools. Abosi and Kandjii-Murangi (1995) say the state of indiscipline in a school may be confined to some undesirable and aberrant behaviour such as disobedience, drug abuse, and absenteeism, cheating especially in examinations, continual lateness and soon. As I consider absenteeism to be an aspect of indiscipline but also being withdrawal behaviour in students, there is need to explore the situation as well as the personal factors that compel junior secondary school students to display this behaviour. Marburger (2001) states that the difficulty inferring the effect of absenteeism on performance because, once a student is absent in a class, he or she may miss the opportunity of learning other techniques. He found out that missing in class progress the likelihood of missing examination material covered that day compared to the student who were present in the class. Therefore, we feel that this problem is very serious. As such we take responsibility to investigate and find a solution to this problem from continuing to happen. At the sometimes, we can know the accurate information about these problems and can be able to cope with this problem from the root.
- 2. 2 Because of absenteeism has a complex nature, the consequences of high level school absenteeism can be detrimental for students. In the other words, the absenteeism among high school students can lead to more negative effect such as low academic performance and many social problems. In terms of the relationship between student absenteeism and academic achievement, Epstein and Sheldon (2002) stated that student with absenteeism miss opportunities to learn the material that enables them to succeed later in school and; fall behind their classmates in academic achievement. In this notion, previous studies have revealed that student absenteeism relates to academic failure and academic perform 1.1 Background of the Study In the secondary school level, there are many factors that directly and indirectly influence student achievement. Therefore, studies have been conducted in many areas including teaching approaches, learning styles, curriculum, and teacher training in order to improve secondary education quality and the academic achievement of students while trying to develop new approaches and applications based on these new approaches. Student attendance is one variable that has a significant impact on student achievement. The research on the relationship between academic achievement and school attendance proves the relationship between course or graduation grades or standardized test scores and school or course attendance (Lamdin, 1996; Barrington & Hendricks, 1989; Rood, 1989; Alexander, Entwisle & Horsey, 1997; Nichols, 2003; Roby, 2004; Sheldon, 2007; Gottfried, 2010). Based on these results, some researchers suggest that attendance level is
- 3. 3 a determinant of academic success as well as a direct indicator (Phillips, 1997; Lehr, Sinclair & Christenson, 2004; Sheldon, 2007). Vocational and technical secondary education attendance rate increased from 1.4% to 4.1% (ERG, 2010; 2011). It is seen that the absenteeism rate in secondary education is much higher than in other stages of the educational system. Absenteeism interrupts the learning process. The educational system is founded on the assumption that students will attend school (Balfanz & Byrnes, 2012). For example in Turkey, students in upper secondary education are obliged to attend according to the Ministry of Education Secondary Education Institutions, Article 40, Passing and Exam Regulation. Students’ success depends on complete participation in all classes. As seen, legal texts support this assumption. Direct and indirect costs of absenteeism are extremely high to the individuals, schools, families and communities. Meanwhile, absenteeism in school negatively affects student learning experience and academic achievement. Absenteeism reduces the success because students miss their education time. This also results in loss of other students’ time since teachers must use additional time to compensate, which leads to lose teaching time for all students (Rood, 1989; Williams, 2001; Eastman, Cooney, O'Connor & Small, 2007). This effect is observed significantly more in progressive interconnected courses such as mathematics. Students who miss certain classes have difficulty learning other subjects and are forced to expend more effort.
- 4. 4 Moreover, as absenteeism increases, students are inclined to experience psychological problems such as depression or behavioral disorders. They may also exhibit behavioral patterns such as becoming involved in violence inside and outside of the school, teenage pregnancy, quitting school and acquiring harmful habits (Gottfried, 2009; Eastman et al., 2007; Lannegrand-Willems et al., 2012; Sinha, 2007; Williams, 2001; Robinson, 2009; Gentle-Genitty, 2008; Jeter, 2011; Casserly, Carpenter & Halcon, 2001). In other words, absenteeism for young people is considered as a predictor of academic failure and leads to many other risk factors. If no measures are taken, absenteeism may be the beginning of a process ranging from academic failure to dropping out of school. 1.2 Problem Statement Student absenteeism is a serious issue in public education. Concerted efforts have been expended aimed at engaging students and promoting active learning, but schools are still full of “clock-watchers” Many high school students regularly skip classes and, according to some inside reports, “the hallways are virtually empty some Friday afternoons. When students fall behind in their learning, they lose interest and fail (Pehlivan, 2006). In addition, students feel an increasing sense of alienation toward their classmates, teachers and their school (Lannegrand-Willems, Cosnefroy, & Lecigne, 2012). Also absent students can set a bad example and encourage absenteeism among other students (Pehlivan, 2006). Absenteeism is not only an indicator of low academic achievement but
- 5. 5 also a strong indicator of diminished social and life success (Williams, 2010). Absenteeism makes it difficult to create a solid foundation in terms of discipline and sense of responsibility. Therefore, it leads to problems in work and discipline habits in future work life (Pehlivan, 2006). This leads to potential consequences, such as unemployment or low income and inability to work at a regular job (Eastman et al., 2007; Gentle-Genitty, 2008). In addition, low attendance rates of students not only predict the academic success but also predict high risk factors for future education (Connell, Spencer & Aber, 1994; Chen & Stevenson, 1995; Nichols, 2003; Lehr et al., 2004). Therefore, the continuous increase in absenteeism is among the most important problems in secondary schools today (Martin, 1991, DeKalb, 1999; Rood, 1989). These findings, derived from administrative records of secondary education, reveal that there is a rapid increase at absenteeism at this stage. Data related to absenteeism shared by the Ministry of Education shows that there is a rapid increase in absenteeism at 2009-2010 compared to 2008-2009. The ratio of students absent more than 20 days to all registered students in general secondary education increased from 1.1% in 2008-2009 to 4% in 2009-2010. If no solutions to the problem of absenteeism are sought for the school, authorities will no longer have a say in the goings on in schools, the students will rule the roost and drive educational institutions to disarray. The quality of education obtained in schools will also lose value, making it very difficult for the countries people to compete globally. Individuals who engage in the practice will grow up to be irresponsible and rebellious and without regard for order or authority.
- 6. 6 1.3 Purpose of the Study The purpose of this proposal is to give a possible ways to Prevent the Rapid Increase of Occurrence of Absenteeism in SHDS. In this study, the schools, parents and teachers will be able to make a possible solution in this issue. 1.4 Significance of the Study This study is significant to the following: a. Teachers. The result of this study will remind the teachers of their responsibilities as facilitators of learning in the classroom. The result of this study will help them revisit their content and pedagogical knowledge to ensure that those students who are under their care will surely come to their classes. b. Students. This study is a beacon of light especially for those students who have always been absent in the class. The impact of their actions as cited in this study will make them aware of their parents’ struggles and difficulties. c. Parents. This study will make the parents aware of the negative impact of their students’ actions especially when their children do not come to school. Nevertheless, parents will be reminded also of their responsibilities as partners of teachers in disciplining their children. d. School Administrators. As academic leaders in school, it is the prime duty of the administrators to design mechanisms to aid those who are constantly skipping classes. This study will serve as their guide in crafting good plans to mitigate absenteeism in school.
- 7. 7 1.5 Research Questions The proposal wants to answer these following questions: 1. What are the factors that contribute to students’ absenteeism? 2. What is the frequency of students’ absenteeism in SHDS? 3. What can teachers do to mitigate this perennial problem? 1.6 Research Hypotheses in Null Form Absenteeism in school has a big impact to the academic performance of students’. They cannot catch-up with the activities given by their different subjects and teachers. Because of that, their future will be affected. That is why I choose the topic “ Ways to Prevent The Rapid Increase of Occurrence of Absenteeism in SHDS because I want to know and to give some possible solutions to lessen this issue. 1.7 Identification of Variables This proposal talks about Ways to Prevent the Rapid Increase of Occurrence of Absenteeism in SHDS. This means, that in implementing possible ways to Prevent the Rapid Increase of Absenteeism will help students to achieve their goals. Thus, the independent variable is the Absenteeism while the dependent variable is the Occurrence. 1.9 Assumptions and Limitations The proposal is mainly about the students’ absenteeism. It will focus on identifying teacher mechanisms in order to lessen the problems on absenteeism among the students of Sacred Heart Dioceasan School., Molave, Zamboanga del Sur. Thus, selected students will be used in this study.
- 8. 8 This proposal is limited only to the students’ of Sacred Heart Diocesan School. The time is also short as it covers only a span of 2 months which is not enough to completely finish the research.
- 9. 9 II. Review of Related Literature One major barrier to learning faced by students and teachers in American schools today is a lack of consistent attendance in classrooms. In fact, the United States Department of Education (1994) has cited absenteeism as the most important factor linked to performance differences among students, and absenteeism has recently been identified as being at crisis proportion (Kearney, 2003). Although many schools realize the importance of this issue, educational researchers have not consistently given this topic the attention it deserves (Corville-Smith, 1995). Additionally, while some attempts to increase attendance rates have been successful, the methodologies used have had notable disadvantages, 1999; Lamdin, 1996). Researchers have attacked this problem from a number of directions. For examples interventions have been community-based (McPartland & Nettles, 1991; Reid & Bailey-Dempsey, 1995), familybased (Copeland, Brown, & Hall, 1974; Volkman, 1996), and school-based (Gottfredson, Jones, & Gore, 2002; Noonan & Thibeault, 1974). The intent of this paper is to summarize existing research on improving attendance rates in schools and offer suggestions for school psychologists on how they can become involved in formulating interventions to help schools deal with problems of attendance. Absenteeism Truancy has been labeled one of the top 10 major problems in American schools, and rates of absenteeism have reached as high as 30% in some cities. In New York City, an estimated 150,000 out of 1,000,000 students are absent daily (DeKalb, 1999). Similarly, the Los Angeles Unified School District reports that 10% of its students are absent daily, and only half return to school with written Correspondence should be addressed to Steven G. Little; Department of Educational and School
- 10. 10 Psychology; Benerd School of Education; University of the Pacific; 3601 Pacific Avenue; Stockton, CA 95211. Electronic mail may be sent via Internet to slittle@uop.edu. The California School Psychologist, Vol. 8, pp. 127-139, 2003 Copyright 2003 California Association of School Psychologists 128 The California School Psychologist, 2003, Vol. 8 excuses (DeKalb). Although school officials are unsure as to the proportion of legitimate verses illegitimate absences, nationwide estimates have ranged from 1-22% for illegitimate absences (Guevermont, 1986; Neilsen & Gerber, 1979). These studies may actually underestimate non-illness related absences due to the large margin of error likely to be found in self-report data of this nature. It is quite possible that the proportion of illegitimate absences has changed since these data were reported; however, no recent estimates are available. Additionally, the proportion of illegitimate absences may vary substantially among school districts in different parts of the country. In the major metropolitan area of New York, for example, attendance rates for the boroughs of Brooklyn and Queens ranged between 86% and 96% for the 1998-1999 school year. The mean rate of attendance in Brooklyn’s elementary schools was 90.63% (SD = 2.15), and for elementary schools in Queens the mean rate of attendance was 92.36% (SD = 1.96). By way of comparison, New York State’s Nassau and Suffolk Counties on Long Island had elementary school attendance rates ranging between 88% and 99% for the 1997-98 school year. The mean attendance rate for elementary schools in Nassau County was 95.81 (SD = 1.30), and Suffolk County’s mean rate of attendance was 95.33 (SD = 1.32) for elementary schools. Within the state of New York, attendance rates for different
- 11. 11 regions appear to vary substantially (New York State Department of Education, personal communication, May 18, 2000). It is possible that the proportion of illegitimate absences varies, as well. DeLeonibus (1978) estimated an attendance rate of 96% as adequate, given 7 days of absence per student per year as based on norms for adults in the workplace. Although attendance rates from other parts of the country may differ, it is possible that DeLeonibus’s criterion is too stringent an expectation for school children. For example, only one of a combined 386 elementary schools in Brooklyn and Queens surveyed by the authors met DeLeonibus’s criterion. The means for suburban districts on Long Island were quite close to the 96% criterion; however, the majority of schools on Long Island (60.8%) also fell below this benchmark. The magnitude of the attendance problem may be further illustrated with an example: If we consider a school with an attendance rate of 90%, this means that one of every 10 children may be absent on any given school day. Given class sizes of 25-30 students per class, this translates to two or three children missing per school day. The consequences of poor attendance can be far reaching. Neill (1979) conducted a survey of 1414 members of the American Association of School Administrators to explore their opinions concerning the importance of attendance and perceived consequences of poor attendance. Administrators were concerned that chronic lack of school attendance could lead to permanent intellectual damage to students, as gaps in students’ knowledge bases would be likely to arise. When students do not achieve their intellectual potential they limit career choices. Additionally, children who have high rates of absenteeism are more likely to drop out of school before completing high school (DeRosier, Kupersmidt, & Patterson, 1994; Gerics &
- 12. 12 Westheimer, 1988; Hersov, 1960; Neilson & Gerber, 1979). Given the positive correlation between academic achievement and monetary income (Greene, 1963; Reid, 1984), chronic absentees may be less able to sustain themselves or a family as they enter young adulthood. Absenteeism has also been found to be a predictor of future criminality, alcoholism, and occupational difficulty (Hersov & Berg, 1980). Administrators that were surveyed in Neill’s (1979) study were also concerned about potential effects on their schools from high degrees of truancy. Schools are, to some degree, economically dependent on attendance rates. Some districts even develop specific formulas using attendance as an indicator of overall school functioning (Epstein & Sheldon, 2002). Absenteeism was seen as contributing to the overall lowering of academic standards of a school. Administrators were concerned about increases in paperwork, and about the extra time teachers needed to spend working with students who 129 were absent. Time spent reviewing material was viewed as taking away from the learning time of the students who were present. Administrators felt high degrees of absenteeism lead teachers to become frustrated, and morale problems are more likely to be experienced when this occurs. Another concern was that high rates of absenteeism could have a negative effect on the school’s relationship with the community as a whole, as the school institution may ultimately be viewed as burdensome rather than as a resource to assist children in becoming educated and responsible adults. Administrators were also concerned about the reduction in monetary state aid for the school resulting from absenteeism. Overall, administrators agreed (95%) that truancy was a major difficulty in their respective school districts.
- 13. 13 Researchers have consistently found grades, achievement tests, and standardized tests to be positively correlated with individual attendance records. For example, Levanto (1975) found class ranks and IQ scores significantly correlated with rates of attendance. Lamdin (1996) compared attendance rates with California Achievement Test scores, reading grade level scores, and math grade level scores. Even while holding teacher/pupil ratio and socioeconomic status constant, attendance rates were positively correlated with all three scores. Additionally, Moos and Moos (1978) examined student absenteeism rate and average class grade, as well as social classroom climate. They found a -.45 correlation between rate of absenteeism and classroom grades. School absenteeism has been a persistent problem for educators and researchers alike. The long-term consequences can be substantial, and decades of research have been dedicated to understanding the ethology of, and exploring intervention possibilities for absenteeism. The data presented in this section are by no means comprehensive. Recent data are sparse and an analysis of individual attendance patterns, and subsequent effects, is needed. For example, an attendance rate of 90% for a population probably represents some students who are absent a lot and some students who are infrequently absent, rather than each student being absent 10%. It would be more informative to provide information on the percentage of students who exceed a specific level than school district averages. Future research along these lines is highly recommended. Mediating Factors School absenteeism appears to be related to a number of diverse factors. Recent studies have suggested that factors from three major domains contribute to higher rates of absenteeism (CorvilleSmith, Ryan, Adams, & Dalicandro, 1998; Southworth, 1992). Both of these studies have categorized mediating
- 14. 14 factors in terms of school-related variables, family environment, and personal characteristics of the student. Table 1 summarizes factors related to school absenteeism School Environment. A number of studies have examined elements specifically related to schools. Eaton (1979), for example, found relationships between teachers and students as the most significant factor related to absenteeism. Other studies have supported this notion, suggesting that conflict in teacher/student relationships contributes to absenteeism (Bealing, 1990; Harte, 1994). Corville-Smith and colleagues (1998) found evidence that a student’s negative perception of school and school personnel may be a predictor of future absenteeism. Moos and Moos (1978) found similar results citing classroom environment as a major factor involved in absenteeism. Specifically, their study showed that classes with high absenteeism rates were perceived by students as high in competition and teacher control, and low in teacher support. This means that the overall climates of these classrooms were viewed as more competitive among classmates, there were more stringent rules and grading policies, and the teacher was perceived as less supportive of students’ individual needs. Neilson and Gerber (1979) conducted a study on truancy in junior high school. They examined chronic absenteeism from the perspective of the truant, conducting structured interviews with 33 persistent truants. When asked, 70% of truants.
- 15. 15 2.1 Review of literature per Research Question The study was carried out by Baker, Sigmon and Nugent in the United States of America in 2001 relatesto the three research questions in this study about the rate, the causes and solutions to the problem of absenteeism. The researchers’ main focus was more experimental though , as their emphasis was to include disciplinary measures on absenteeism, by using the Office of Juvenile Justice and Delinquency Prevention (OJJDP). The study they carried out was on truancy defined as ‘unexcused absences from school or class without proper approval of appropriate school officials’ (Baker, et al 2001).They carried out descriptive long-term studies in schools in three cities for more than ten years. The data they collected was from authorities who monitor attendance in schools, namely, the school attendance clerks and other school authorities. These were deemed the programme implementers. One aspect of the research study that struck as uncanny is the variables that have been brought into consideration are almost similar to the ones pertaining to the Botswana situation. These variables are family factors, school factors, economic influences and student factors all encompassed in the community factors. What the researchers found out was that high rates of absences were in public schools in the inner city and that the rates of absenteeism related with poverty. They got to the conclusion that poverty was a factor, from the premise that in public schools the students are fed as opposed to bringing their own lunch. The study found out that absenteeism was not gender stereotyped though, as both the boys and the girls, more especially around the age of fifteen, occasionally played
- 16. 16 truant. In the conclusion they came up with, they viewed truancy as leading to juvenile delinquency, hence the role of the OJJDP. The juvenile system served in cases where the truancy is chronic or persistent by making “sanctions for parents and youth for continued truancy or failure to complete the diversion programmes successfully” (Baker, et al 2001). A study called ‘Increasing Student Attendance’ was conducted in 2004 by Jennifer Railsback. Ideally, as would this study, Railsback employed interviews and surveys administered to students to obtain answers. The school staff also engaged in action research and had focus groups with the concerned students. The idea of action research would not be ideal in this case as there are several schools under survey. In the Railsback study there was the use of external organisations for conducting surveys. Data was obtained from the records kept by the School Success Profile (SSP). The SSP is an organisation that is government based, endorsed by the National Dropout Prevention Centre in America. Since such centres do not exist in Botswana, only individual based research can be done to conduct this study. The SSP gives information on the feelings and attitudes of students towards their schools, school authorities, rules that govern them and most importantly about their attendance. On dealing with issues that relate to the research question at hand that says “What are the causes of absenteeism in students at Junior Secondary School?” Railsback (2004) puts forward the idea that before deciding what strategies to use to increase attendance, it could be beneficial to look at the reasons why students do not attend school as well as why it is difficult to retain them in school. In the study she identified several factors as family background and relationships,
- 17. 17 past school performance, personal characteristics and neighbourhood characteristics as causes of absenteeism/failure to attend school. For the study to address the question “What do the teachers and the schools’ administrative authorities view as possible solutions to the problem of absenteeism?” the author cited ensuring who was to blame for the students’ truancy and dealing with whoever was to blame. If the students were the culprits then ample counselling be given to the students so as to change their attitudes and ultimately their behaviour and if it was the school that was to blame for the students’ absenteeism the have a welcoming safe academically challenging and personalised environment that will support the students’ learning. The ways in which to carry this out were mentioned as having counselling sessions with the students to allow them to verbalise their feelings and concerns, and to identify aspects of school that they enjoyed. Subsequently the school would reward the students for good attendance. The school would also cultivate caring relationships and mentoring which would make the student feel good about attending school. 2.2 Summary of the Review of Literature per Research Question The Baker and the others’ study were carried out over a very long period as compared to this study. Discrepancies are bound to be present when there is extended monitoring and when there is only a short time given for research. Although having covered a lot of factors that relate to the Botswana situation their study has a part that is arguable; the researchers cite a number of consequent behaviours that they purport to be resulting from absenteeism in schools. They alluded to reasons such as substance abuse,
- 18. 18 teenage pregnancy, marital problems, adult criminality and incarceration. My point of view is that the above mentioned problems are too far-fetched as they include so many factors leading to them. For instance a girl’s pregnancy could depend on her attitude towards the opposite sex, her lack of information regarding sexual matters, her recklessness, peer pressure, lack of parental control; just to mention a few. I therefore fail to see the correlation with school absenteeism. In the Railsback study, the author noted that ‘although the importance of attendance is well understood , effective strategies for increasing it are not so definitive’ (Railsback,2004). In agreement with my study, Railsback pointed out that the first step for the schools to deal with this issue was to determine the reasons for absenteeism. On the overall she identified several strategies that are used or can be used, but she was against the idea that they be used in isolation, rather apply a combination of them to be able to curb absenteeism. My view is that utilising too many strategies all at once needs a lot of time and lots of personnel employed just for that, with the current layout of the schools in our country where the economy cannot sustain even the teachers themselves, such interventions are still implausible. The Railsback study also focussed on the students alone to give the entire information, all the stakeholders must have a chance to air their views, which is why the study at hand would include the teachers, Head of Houses, Deputy School Heads as well as the School Heads.
- 19. 19 III. Methodology 3.1 Introduction This chapter gives an outline of research methods that were followed in the study. The researcher explains how the necessary data and information to address the research objectives and questions was collected, presented and analysed. It provides information on the participants, who the participants were and how they were sampled. Binary questionnaires were used in collecting the data from the senior high students. The researcher describes there research design that was chosen for the purpose of this study and the reasons for this choice. The instrument that was used for data collection is also described further and the procedures that were followed to carry out this study are included. The researcher also discusses the methods used to analyze the data. 3.2 Participants The participants are the selected students’ of SHDS. From Grade 7 up to Grade 12. Two for the Grade 7, Two for the Grade 8, Three for Grade 9, Four for Grade 10, Four for Grade 11, and Five for Grade 12. And it has 20 participants at all. I also asked the Non Academic Head of the school Ms. Juliet R. Lungay for the total average of absenteeism in school throughout the year because she had the list of every student who will be absent.
- 20. 20
- 21. 21 Name:(optional)__________________________Age:____ Grade Level:_______________ Section:_____________ Directions: Please answer the following questions honestly. Put a check mark ( ) if your answer is YES or NO. Questions YES NO 1. Are you always absent in school? 2. Does your parents aware when you absent? 3. Are the requirements of your different subjects are the reason why you are absent? 4. Did your classmates bully you? That’s why you are absent? 5. Are the schools’ rules and regulations are the reason why you are absent? 6. Does the teacher show a good behaviour while teaching? 7. Are you comfortable in your classroom while studying? 8. Are the lack of motivation is the reason why you are absent? 9. Does your parents have concerned on your studies? 10. Are you able to catch-up the previous lessons that you’ve miss? 3.5 Procedures This research proposal undergoes certain process before the data was finalized and interpreted. 3.5 Procedures
- 22. 22 The first task of doing a research is to choose a topic. The topic the researcher chose in this proposal is based on the current issue the society faces nowadays. After figuring out the topic, the researcher then gathers data and information about the topic. There are theories related to the topic where this research is also based into. One of it is the general equilibrium theory of economics which is a state where economic forces such as supply and demand are balanced and in the absence of external influences the (equilibrium) values of economic variables will not change. A state of disequilibrium is what the Philippine economy is now in, despite all the Department of Finance and the National Economic and Development Authority arguments to the contrary. TRAIN came charging into the picture on Jan. 1, 2018, and disequilibrium, began to infect the economy. Workers and consumers soon started to protest the price upsurges—of fares, electricity, food and services especially—that were bound to reduce the purchasing power of their incomes. After thorough examination of the theory and the observation of other studies related to the topic, the researcher then constructed a title to focus the direction of the study. Next, the researcher began working the research using survey research type. Survey research was done using pre-coded closed-ended questionnaire which is answerable by ‘‘yes or no’’. The researcher used this type of research because it is best served to answer the research questions. Survey research was done using pre-coded closed-ended questionnaire which is answerable by ‘‘yes or no’’. The researcher used this type of research because it is best served to answer the research questions.
- 23. 23 After describing the type of research used, the researcher chose the population where the participants can be selected. The population is the consumers. The consumers then grouped and put into sampling frame; business practitioners, workers, employees, professionals, and ordinary consumers. 4 sample respondents can be drawn from each sampling frame, total of 20 overall respondents. The respondents were given survey questionnaires for them to answer. Data collection was done by administering questionnaires directly to the chosen sample. 20 copies of the questionnaire given out were successfully completed and returned. To process the data collected, first encode the data into numeric format. Second, transfer the information from questionnaires to computer files for processing. Third, measuring the data using descriptive statistics; mean, median, and mode, and measures of central tendencies. In analysing the data, the researcher used statistical techniques; charts and graphs. 3.6 Design A survey research design was used to determine the people’s point of view if they are in favour or not with the proposed dissolution of the TRAIN Law. Survey research design is usually done by doing structured interview or self-administered questionnaires given to sample respondents of the population. In this research, the researcher used the survey questionnaires to gather data from respondents. 3.7 Data Analysis
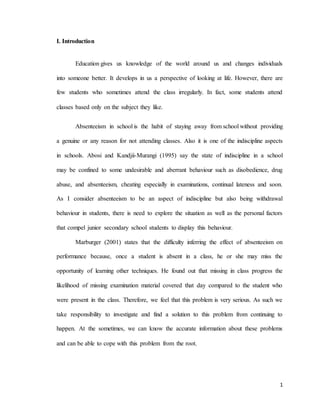
- 24. 24 The data collected from the field were measured. The response options in the instrument are weighted as shown below: Table 1. POINTS Yes NO 1 POINT 0 POINT Table 2. RESPONDENT’S POINTS Respondent Points % Respondent Points % 1 5 50 11 9 90 2 9 90 12 9 90 3 9 90 13 9 90 4 8 80 14 6 60 5 10 100 15 3 30 6 9 90 16 6 60 7 4 40 17 9 90 8 10 100 18 10 100 9 2 20 19 10 100 10 9 90 20 9 90 Pie Chart I.
- 25. 25 The number of respondents who answered yes/no in each question in the questionnaire was shown in the table below: Table 2. TOTAL NUMBER OF RESPONDENTS ANSWERED YES/NO YES NO Question #1 20 0 Question #2 14 6 Question #3 12 8 Question #4 15 5 Question #5 16 4 Question #6 14 6 Question #7 18 2 Question #8 13 7 Question #9 18 2 Question #10 19 1 Total 159 41 Score (9-10) 65% Score (0-8) 35% Respondent'sPoints
- 26. 26 Percentage 79.50% 20.50% Pie Chart II. The table below contains the information required to compute for the mean and variance for YES answer. 79.50% 21.50% Respondent'sResponse Yes No
- 27. 27 Table 3. CALCULATIONS OF VARIANCE N (Question) X (Respondents) Group Mean (M) ( Xi- m) Variance ( Xi – m) 2 N1 20 4.1 16.81 N2 14 1.9 3.61 N3 12 3. 9 15.21 N4 15 0. 9 0.81 N5 16 0.1 0.01 N6 14 1. 9 3.61 N7 18 2.1 4.41 N8 13 2. 9 8.41 N9 18 2.1 4.41 N10 19 3.1 9.61 Sum = 159 Sum = 24 Sum = 66. 9 Mean= 6.69 ( sum / 10) Mean (m) = 15. 9 ( sum / 10) Mean = 2.4 ( sum / 10) SD = 2. 59 The table below contains the information required to compute for the mean and variance for YES answer.
- 28. 28 Table 4. CALCULATIONS OF Z-SCORE N (Question) X (Respondents) Group Mean (M) ( Xi- m) Variance ( Xi – m)2/SD N1 20 4.1 1.58 N2 14 1.9 -0.73 N3 12 3. 9 -1.51 N4 15 0. 9 -0.35 N5 16 0.1 0.04 N6 14 1. 9 -0.73 N7 18 2.1 0.81 N8 13 2. 9 -1.12 N9 18 2.1 0.81 N10 19 3.1 1.20 Sum = 159 Sum = 24 Mean (m) = 15. 9 ( sum / 10) Mean = 2.4 ( sum / 10) The table below contains the information required to compute for the mean and variance for NO answer.
- 29. 29 Table 5. CALCULATIONS OF VARIANCE N (Question) X (Respondents) Group Mean (M) ( Xi- m) Variance ( Xi – m) 2 N1 0 4.1 16.81 N2 6 1.9 3.61 N3 8 3. 9 15.21 N4 5 0. 9 0.81 N5 4 0.1 0.01 N6 6 1. 9 3.61 N7 2 2.1 4.41 N8 7 2. 9 8.41 N9 2 2.1 4.41 N10 1 3.1 9.61 Sum = 41 Sum = 24 Sum = 66. 9 Mean= 6.69 ( sum / 10) Mean (m) = 4.1 ( sum / 10) Mean = 2.4 ( sum / 10) SD = 2. 59 The table below contains the information required to compute for the mean and variance for NO answer.
- 30. 30 Table 6. CALCULATIONS OF Z-SCORE N (Question) X (Respondents) Group Mean (M) ( Xi- m) Variance ( Xi – m)2/SD N1 0 4.1 -1.58 N2 6 1.9 0.73 N3 8 3. 9 1.51 N4 5 0. 9 0.35 N5 4 0.1 -0.04 N6 6 1. 9 0.73 N7 2 2.1 -0.81 N8 7 2. 9 -1.12 N9 2 2.1 -0.81 N10 1 3.1 -1.20 Sum = 41 Sum = 24 Mean (m) = 4.1 ( sum / 10) Mean = 2.4 ( sum / 10) Conclusion
- 31. 31 Table 1 presented the points assigned in every yes answer, and in Table 2, the points of every respondent is presented. When a respondent has total points of 9-10, then he/she is in favour of the dissolution of the law and believed that it is not beneficial to the economy and to the people. So, there are 9 respondents who has a total points of 9 and 4 respondents has 4 points, overall 13 respondents while the respondents who has 8 below points, are only 7. Therefore, there are 65% of the sample respondents who scored beyond 8 are believed that they completely in favour of the dissolution of the law. On the other hand, in the pie chart (Respondent’s Response) above, it presents the percentage of the respondents who answered yes or no in the 10 questions in the survey questionnaire. From the result, I conclude that there is higher percentage of people who are not satisfied with the TRAIN Law and agreed the proposed dissolution of the law. In addition, they are the people who said that the law causes much bad effects to the people’s lives economically and financially. It only a cause the poor becomes poorer, therefore, reflects to the economy’s state. Reference
- 32. 32 https://www.dof.gov.ph/index.php/ra-10963-train-law-and-veto-message-of-the- president/ https://www.pwc.com/ph/en/tax-alerts/assets/pwcph_tax-alert-34.pdf http://www.dof.gov.ph/taxreform/ Inc., Primer Media. "TRAIN Package One: A Need-To-Know Guide to Republic Act 10963". "Package One - Lowering the Personal Income Tax • #TaxReformNow". http://www.dof.gov.ph/taxreform/ "TRAIN law raises gov't revenue by 16.4% in Q1". "NEDA: June's 5.2% inflation 'unexpected' - Philstar.com". philstar.com. "Makabayan bloc asks SC to strike down tax reform law". Jr., Nestor P. Burgos. "3 senators call for suspension of Train law". Esguerra, Anthony Q. "Bam Aquino rallies support for passage of TRAIN law amendment". "About the Tax Reform - What is TRAIN? • #TaxReformNow". "About the Tax Reform - Impact of the Tax Reform • #TaxReformNow". "PRRD certifies tax reform bill as urgent • #TaxReformNow". Department of Finance. Retrieved 22 December 2017.
- 33. 33 "Tax Alert No. 8 - House Bill on Tax Reform for Acceleration and Inclusion" (PDF). PwC. Retrieved 22 December 2017. Dizon, Nikko (31 May 2017). "House passes Duterte's tax reform package on final reading". Philippine Daily Inquirer. Retrieved 22 December 2017. Romero, Paolo (29 November 2017). "Senate rushes to approve tax reform bill". The Philippine Star. Retrieved 22 December 2017. Lingao, Amanda; Lardizabal, Cecille (29 November 2017). "Senate OKs tax reform bill on final reading". CNN Philippines. Retrieved 22 December 2017. "Senate approves tax reform bill on 3rd reading". The Manila Times. 28 November 2017. Retrieved 22 December 2017. Dela Cruz, Jovee Marie; Fernandez, Butch (11 December 2017). "TRAIN passes with Senate having its way in bicam". Business Mirror. Retrieved 22 December 2017. Dalangin-Fernandez, Lira (13 December 2017). "House, Senate ratify TRAIN tax bill". InterAksyon. Retrieved 22 December 2017. Juris, The Corpus (19 December 2017). "R.A. No. 10963: Tax Reform for Acceleration and Inclusion (TRAIN)". "Package One - Complementary Measures • #TaxReformNow". "Package One - Simplified Value-Added Tax (VAT) system • #TaxReformNow". "'TRAIN' advocates and supporters are insensitive to the cries of the poor". Manila Bulletin News. Retrieved 2018-07-15.
- 34. 34 Jr., Nestor P. Burgos. "3 senators call for suspension of Train law". Retrieved 2018-07- 09. Esguerra, Anthony Q. "Bam Aquino rallies support for passage of TRAIN law amendment". Retrieved 2018-07-09