1. ANALYTICAL CHALLENGES IN
EXTRACTABLE STUDIES OF IV BAGS
PART 2: HR-LC-MS AND ICP-MS ANALYSIS
DUJUAN LU¹, KENNETH WONG¹, KATE COMSTOCK², EKONG BASSEY², JING KONG¹, DANNY HOWER¹, JOHN SCHMELZEL², AND KELLY BERTRAND¹
1
SGS LIFE SCIENCE SERVICES, 2
THERMO FISHER SCIENTIFIC
SGS
CONCLUSION
• This study demonstrated a comprehensive extractable
analysis workflow utilizing multiple techniques: HR-LC-
MS, GC-MS, and ICP-MS, and data processing software
Compound Discoverer 2.0 with database searching.
• The LC-MS analysis was conducted using high resolution
MS (full MS/HCD MS2) with rapid polarity switching in
a single run, and the data was processed using CD 2.0
software which is capable of multiple database search.
This workflow increased the confidence and throughput
of routine extractable & leachable analysis.
REFERENCES
1. PQRI Recommendations to the FDA 2006. http://pqri.org
2. BPOG Standardized Extractables Testing Protocol for
Single-Use Systems in Biomanufacturing. Nov. 2014
HR-LC-MS ANALYSIS
Liquid Chromatography
The extracts solutions were analyzed directly by LC-MS. LC
separations were carried out on the Thermo Ultimate™ 3000
RS UHPLC system consisting of: DGP-3000RS pump, WPS-
3000RS sampler, TCC-3000RS column compartment and
DAD-3000RS UV detector. Column: Thermo Hypersil C18,
2.1x150 mm 1.9 μm Column Temp: 50ºC LC Mobile phase:
A: H2O/0.05% acetic acid/5 mM ammonium acetate, B:
Acetonitrile/0.05% acetic acid/5 mM ammonium acetate.
Mass Spectrometry
MS analyses were carried out on the Thermo Scientific
Q Exactive Plus mass spectrometer using electrospray
ionization (ESI). High resolution full scan MS and top 3 MS/
MS data were collected in a data-dependent fashion at a
resolving power of 70,000 and 17,500 (FWHM m/z 200) with
polarity switching. The scan range was m/z120-1600. Stepped
NCE (Normalized Collision Energy) setting was: 30, 45, 60.
HR-LC-MS RESULT
High Resolution MS Screening with polarity switching
The full scan and MS/MS data were acquired with polarity
switching at high resolution 70K and 17.5 K. The rapid polarity
switching enables the detection of structurally diversified
compounds, eliminates the need for duplicate injections for
initial screening, and provided complete extractable profile
and increased the analysis throughput. (Figure 1 and Figure 2)
Data Processing
The HRAM data was processed with Compound Discoverer
2.0 (CD 2.0), a small molecule structure analysis software
(Thermo Fisher Scientific). Through its flexible node-based
workflow (Figure 3) which can be setup following the
building in wizard, the CD 2.0 detected compounds with
composition predictions, followed automatically online library
search against ChemSpider and mzCloud, and local E&L
compound database search.
FIGURE 4: COMPOUND DISCOVERER 2.0 RESULT VIEW
FIGURE 1: MS BASE PEAK CHROMATOGRAM OF IPA/H2O EXTRACT (+/-)
PEAK ID RT
MEASURED
(M+H)+
CALCULATED
(M+H)+
ELEMENTAL COM-
POSITION
ERROR
(PPM)
1 9.8 291.1799 291.1802 C14H26O6 -1.2
2 10.8 327.2164 327.2166 C18H30O5 -0.7
3 13.1 279.1588 279.1591 C16H22O4 -1
4 15.3 347.2425 347.2428 C18H34O6 -0.9
5 17.3 379.2109 379.2115 C21H30O6 -1.6
6 17.6
726.4781
(M+NH4)+
726.4787
(M+NH4)+
C39H64O11 -0.7
7 19.3
454.2796
(M+NH4)+
454.2799
(M+NH4)+
C24H36O7 -0.6
8 19.7
454.2795
(M+NH4)+
454.2799
(M+NH4)+
C24H36O7 -0.9
9 20.9 407.2788 407.2792 C24H38O5* -1.0
10 21.6 423.2738 423.2741 C24H38O6* -0.8
11 21.7 405.2635 405.2636 C24H36O5* -0.2
12 22.2 389.2684 389.2686 C24H36O4* -0.7
13 22.8
1034.6774
(M+NH4)+
1034.6774
(M+NH4)+
C57H92O15 -0.1
14 24.0 407.2788 407.2792 C24H38O5* -1.0
15 25.3
1020.6978
(M+NH4)+
1020.6982
(M+NH4)+
C57H94O14 -0.4
16 25.9 377.2682 377.2686 C23H36O4 -1.1
17 26.7 391.2839 391.2843 C24H38O4 -1.0
18 28.3
1006.7188
(M+NH4)+
1006.7189
(M+NH4)+
C57H96O13 -0.1
19 30.9 447.3465 447.3469 C28H46O4* -0.9
20 31.5 447.3466 447.3469 C28H46O4* -0.7
ELEMENT IV DI IV ACID ELEMENT IV DI
IV
ACID
ELEMENT IV DI
IV
ACID
66Zn 65.32 81.14 60Ni ND ND 157Gd ND ND
44Ca 20.49 23.90 73Ge ND ND 159Tb ND ND
24Mg 1.48 3.38 78Se ND ND 163Dy ND ND
23Na 1.06 0.74 85Rb ND ND 165Ho ND ND
48Ti 0.04 0.06 89Y ND ND 166Er ND ND
88Sr 0.02 0.03 90Zr ND ND 169Tm ND ND
137Ba 0.02 0.01 93Nb ND ND 172Yb ND ND
63Cu 0.01 0.03 95Mo ND ND 175Lu ND ND
55Mn ND 0.01 101Ru ND ND 178Hf ND ND
75As ND ND 103Rh ND ND 181Ta ND ND
111Cd ND ND 105Pd ND ND 182W ND ND
202Hg ND ND 107Ag ND ND 185Re ND ND
208Pb ND ND 115In ND ND 189Os ND ND
7Li ND ND 118Sn ND ND 193Ir ND ND
9Be ND ND 121Sb ND ND 195Pt ND ND
11B ND ND 125Te ND ND 197Au ND ND
27Al ND ND 133Cs ND ND 205Tl ND ND
39K ND ND 139La ND ND 209Bi ND ND
45Sc ND ND 140Ce ND ND 232Th ND ND
51V ND ND 141Pr ND ND 238U ND ND
52Cr ND ND 146Nd ND ND
56Fe ND ND 147Sm ND ND
59Co ND ND 153Eu ND ND
ICP-MS ANALYSES
The ICP-MS samples were prepared by filling the IV
bags with 250 ml of 1% nitric acid and 250 ml DI water
respectively. The filled bags were kept at RT for 24 hours. The
analyses were conducted on Thermo Scientific* iCAP Q ICP-
MS with He KED (Kinetic Energy Discrimination) interference
reduction mode setting. The iCAP Q was set up using Helium
gas in the collision cell in KED mode.
TABLE 3: ICP-MS RESULT (PPB)
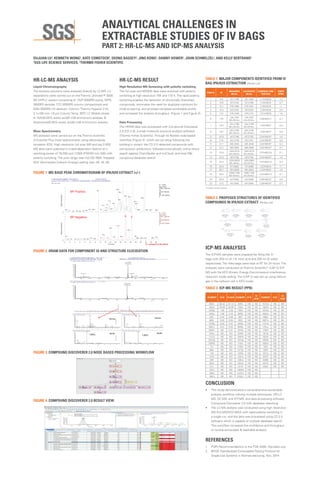
TABLE 2: PROPOSED STRUCTURES OF IDENTIFIED
COMPOUNDS IN IPA/H2O EXTRACT (Partial List)
TABLE 1: MAJOR COMPONENTS IDENTIFIED FROM IV
BAG IPA/H2O EXTRACTION (Partial List)
FIGURE 2: HRAM DATA FOR COMPONENT ID AND STRUCTURE ELUCIDATION
FIGURE 3: COMPOUND DISCOVERER 2.0 NODE BASED PROCESSING WORKFLOW
*multiple isomers present