1. Bike share in san José: who will use It, how much money people
will pay for it, and what they will use it for
Kenneth Rosales and Dr. Rachel O’Malley
Department of Environmental Studies, San Jose State University, One Washington Square, San Jose, CA 95192-0101
In the Bay Area, 36.4% of Greenhouse gases come from transportation, thus significantly
contributing to global climate change. In response to this issue, the cites of San Francisco,
Redwood City, Palo Alto, Mountain View, and San Jose will implement a pilot bike share
program funded by the Metropolitan Commission, Bay Area Air Quality Management
District, and Valley Transportation Authority in the summer of 2012.
One hundred and fifteen (115) surveys were conducted throughout the principal areas
where the bike share program kiosk stations will be disseminated to find out if a significant
correlation between participants' age and their willingness to pay . The average age and
willingness to pay, information about whether they will use bike share or not, why they
wouldn’t use bike share, and what they would use bike share for were also acquired.
No significant correlations between people’s age and willingness to pay were found
because of an imbalanced distribution of young people over older individuals surveyed.
However, most people who would use bike share would use it to run errands, and those
who would not use bike share would rather use another mode of transportation. Most
survey participants would use bike share at Diridon Station over any other area and would
on average, pay much more compared to Washington D.C. or Boston, Massachusetts.
Therefore, San Jose’s bike share vendor should be a non-profit organization that survives
through low costs from in-kind sponsorships, subsidies, subscriptions, and local affiliates.
Materials:
• 120 printed surveys, 40 for each region
• Two clipboards
• Five pens
• Three quarters
Design:
• With the help of two colleagues, San Jose Diridon Station, San Jose City
Hall, and San Jose State University were surveyed (Figure 1).
• Participants/groups were randomly surveyed with the flip of a quarter.
• A landing on heads resulted in a “yes” and tails resulted in “no”
• Participants were educated on what bike share is, where the stations
will be located, and how the paying system works before filling out each
survey.
The regression analysis performed between people’s willingness to pay and
their age showed no significant correlations (Figure 2). All p-values resulted
in scores over .05 value and all squared multiple R numbers were well below
.05. Although there were no significant correlations between age and the
willingness to pay, several other figures had arisen. The number of people
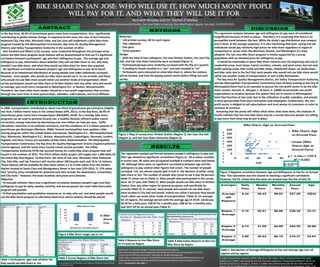
surveyed, 115, are almost exactly split in half in the decision of either using
bike share or not. The number of people who chose to use it was 58 persons
while 57 chose not to (Table 1). Most people who participated in the survey
were 18- 27 year olds (Table 1). Most people would use bike share in Diridon
Station than any other region for general purposes and specifically for
errands (Table 3). In contrast, most people who would not use bike share
were located in City Hall and would mainly not utilize it because they would
much rather use some other mode of transportation (Table 4). On average,
for all regions, the average person with the average age of 29.44 would pay
$6.44 for a daily pass, $28.43 for a weekly pass, $88.62 for a monthly pass,
and $227.29 for an annual pass (Table 5) .
Table 1 Participants’ ages and whether the
they would use bike share or not
Figure 3 Bike Share usage- yes or no
Table 3 Reasons to Use Bike Share
for Errands by Region
Table 4 Alternative Reasons to Not Use
Bike Share by Region
Table 5 Distribution of Average Willingness to Pay and Average Age over all
regions and by regions.
Figure 2 Negative correlation between Age and Willingness to Pay for an Annual
Pass. This calculation was the closest to reaching a significant correlation.
However, the R2 shows that few plots are located near the line of best fit.
Figure 1 Map of survey area: Diridon Station (Region 1), San Jose City Hall
(Region 2), and San Jose State University (Region 3).
In 2008, transportation contributed to about one-third of greenhouse gas emissions (slightly
less than 7 billion metric tons) in the United States (EPA, 2011). In the Bay Area, 36.4% of
Greenhouse gases come from transportation (BAAQMD, 2010). As a remedy, bike share
programs can be used to promote bicycle use; a healthy lifestyle; efficient public transit
connection; energy reduction by decreasing over one million car trips per year; traffic
alleviation; reduction in air pollution emissions, and the avoidance of 3.5 million pounds of
greenhouse gas discharges (Martens, 2006). Several municipalities have applied a bike
sharing program within the United States and beyond. Washington D.C., Minneapolis/Saint
Paul, Minnesota, Washington D.C., Boston, Massachusetts, Copenhagen, Denmark, London,
England, and Paris, France are examples of bike share implementation. The Metropolitan
Transportation Commission, the Bay Area Air Quality Management District (regional pollution
control agency), and the Santa Clara County transit service provider, the Valley
Transportation Authority (VTA) has secured money for a pilot bike share program that will
launch in the summer of 2012. The $70.9 million dollar project will supply over 1,000 bikes for
the entire Bay Area Region. Furthermore, the cities of San Jose, Mountain View, Redwood
City, Palo Alto, and San Francisco will receive about 100 bicycles each and 10 to 12 stations.
These stations will be available for bike share within a 1 to 3 mile radius from the Diridon
Station located at Santa Clara and Montgomery Street in San Jose (VTA 2010, 7). VTA states
that “priority areas considered for potential pod sites include the downtowns, universities,
and City Halls.” However, the exact locations and prices are unknown. ,
Objective:
• To evaluate whether there was a significant correlation between people’s ages and their
willingness to pay for daily, weekly, monthly, and annual passes San Jose’s Bike Share pilot
program will provide.
• To find quantitative and qualitative measures as to why, why not, and what people would
use the Bike Share program to ultimately determine where stations should be placed.
Table 2 Survey Regions of Bike Share Use
The regression analyses between age and willingness to pay were all considered
insignificant because of their p-values. Therefore, it is surprising that there is no
perceptible trend between the two. While the study’s age distribution was unequal
and in favor of the younger populace, it is also interesting that both young and old
individuals would pay relatively high prices for bike share regardless of region in
comparison to prices cities like Montreal, Boston, and Washington D.C have
adopted. The San Jose Bike Share program is mostly supported by a young
population with an elevated price for willingness to pay.
It would be reasonable to place Bike Share stations near the beginning and end of
residential areas, local shops, transit corridors, schools, and work areas, but not near
public parking areas, bike rental and bike shops, skateboard shops, car dealerships,
and bike racks due to the fact that most people who would not use bike share would
rather use another mode of transportation or own a bike themselves.
The Bay Area Air Quality Management District, the Valley Transportation Authority,
and the Metropolitan Transportation Commission have all been looking at the City of
Minneapolis/Saint Paul as an example to pursue the non-profit sector to be the bike
share vendor. Dossett, B., Munger, J., & Bono, K. (2008) recommends non-profit
organizations as vendors because the system they set in motion in Minneapolis/
Saint Paul function at low costs due to the utilization of public subsidies, and private
in-kind sponsorships from local contractors and employees. Furthermore, the non-
profit sector is obliged to sell subscriptions and must please its customers in order to
continue its business.
Assuming that the prices will reflect what other cities have done, the analyses of
results indicate that San Jose bike share may be a success because people are willing
to pay more than what may be put in place.
3) Valley Transportation Authority, (2010). Bike Share Pilot Project Phase 1 Implementation Plan Draft
4) Martens, K. (2007). Promoting bike-and-ride: the dutch experience. Transportation Research Part A, 41,
326-338. 5) Dossett, B., Munger, J., & Bono, K. (2008). Non‐profit business plan for twin cities bike shareAcknowledgements: Felix Rosales, Austin Roberts, Chad Inman, Jessica Johnson,
and Eduardo Pereira
References: 1) "Climate Change." Environmental Protection Agency.
http://www.epa.gov/climatechange/basicinfo.html#emissions (accessed September 9, 2011)..
2) Bay Area Air Pollution Summaries” Bay Area Air Quality Management
District.http://www.baaqmd.gov/~/media/Files/Communications%20and%20Outreach/Annual
%20Bay%20Area%20Air%20Quality%20Summaries/pollsum09.ashx (accessed September 9,
2011). Continued to the right ->