SlideShare ist ein Scribd-Unternehmen logo
1 von 31
Downloaden Sie, um offline zu lesen
The Science of Climate Change December 2022
1 of 31
The Science of Climate Change
December 2022 keith.shotbolt@hotmail.co.uk
Earth is a water planet: three-quarters of the surface is covered by water,
and water-rich clouds fill the sky. (NASA.)
Contents
Conclusions 2
1. Introduction 3
2. Composition of the Earth’s Atmosphere 4
3. The Water Molecule and its Associated Latent Heat 5
4. Radiation and the Greenhouse Effect 6
5. Evaporation and Condensation of the Water Cycle 7
5.1 The Water Cycle – by NASA 8
5.2 Universities of San Diego and Arizona on the Water Cycle 9
6. Observations of Temperature Change 10
7. The US National Snow and Ice Data Center (NSIDC - US spelling) 12
7.1 Increased Arctic Ice since the Low Point of September 2012. 13
8. Southern Hemisphere Glaciers 14
9. Atmospheric Content of CO2, 1957-2020. 15
9.1 Carbon Dioxide Concentration over Geologic Time 16
10. Global Atmospheric Circulation 17
11. Scientific Papers on the Effects of Vast Mid-continent Areas of Irrigation 18
12. World Population and Freshwater Withdrawals for Agriculture 21
13. Dams of the World and Paddy Fields 23
14. Centre-pivot Irrigation Systems 26
15. Media Reports of World Crop Irrigation 27
16. Latent Heat of Evaporation of Water used for World Irrigation 28
Appendix - IPCC Reports on Water Vapour and associated Latent Heat. 29
The Science of Climate Change December 2022
2 of 31
Conclusions (based on details contained in the Study Report attached below).
1. Records in Hawaii and at the South Pole show that the atmospheric concentration of carbon dioxide
(CO2) has increased worldwide from 0.031% to 0.042% over the last 60 years.
According to satellite observations by NASA and ESA:
(a) There has been no significant change in Antarctic Sea ice extent over the last 50 years,
(b) From a low point of 3.6 x 10⁶ km2 in September 2012, Arctic Sea ice extent has increased to 4.9 x 10⁶
km2 (+36%) in the last two Septembers while CO2 concentration has increased by 5.6%.
(c) Records show that Southern Hemisphere glaciers increased in length in Chile (1950 to 2016) and New
Zealand (1983 to 2008).
World temperature change records by IPCC (2007), NASA (2017) and NOAA (2021) show increases of 1.5
degrees C in high Northern latitudes, and slight decreases below latitude 45 degrees South.
Little or no climate change can be attributed to increased atmospheric CO2, but the evidence points to
increased atmospheric water vapour arising from increased crop irrigation.
2. The Main Sections of all six Reports by the Intergovernmental Panel on Climate Change, (IPCC, dated
1990, 95, 2001, 07, 13 & 21) state that “water vapour is the most important and strongest greenhouse
gas”- reducing the thermal infrared (long-wave) flux leaving the atmosphere-surface system.
3. IPCC Report AR4 2007, Chapter 1, Historical Overview of Climate Change Science, page 5, states that
"Energy (solar) is required to evaporate water from the sea or land surface, and this energy, called
LATENT HEAT, is released when water vapour condenses in clouds.”
4. In 2010, the UN Food and Agriculture Organisation (FAO) noted that humans withdrew 2,750 billion
tonnes of freshwater for Agriculture (90% applied in the Northern Hemisphere) and 300 billion tonnes of
freshwater evaporated to atmosphere from Dam Reservoirs.
World human population increased from 2.3 billion in 1940 to 7 billion in 2010. Freshwater withdrawn
for agriculture (irrigation) increased by 205% and evaporation from reservoirs increased by 500%. The
increases were needed to provide food and water for the ever-increasing population (now 8 billion).
5. Every year, at least 2,700 billion tonnes of water vapour enter the atmosphere by evapotranspiration
from irrigated farms and vineyards. The phase change (liquid to gas) absorbs radiant heat energy from
the sun as LATENT HEAT- equivalent to more than 10 times the amount of energy used by humans for
all other activities. This heat is released when the vapour condenses.
6. The Appendix here contains extracts from IPCC Reports 1990, 1995 and 2001 giving details of the
release of latent heat (quote) “as water vapour condenses in the warm, poleward moving, ascending
air” and “increasing precipitation in the mid- and high latitudes of the Northern Hemisphere.”
7. There is no doubt that the increased atmospheric content of water vapour from crop irrigation has
caused both:
a) an increased greenhouse effect (radiative forcing effect) when uncondensed - thus reducing summer
night-time cooling and increasing the possibility of heat waves and forest fires, and
b) an increased upward or poleward transfer of latent heat that is released when it condenses - thus
increasing storms & floods, or melting polar ice, glaciers & permafrost.
The Science of Climate Change December 2022
3 of 31
The Science of Climate Change
December 2022 keith.shotbolt@hotmail.co.uk
1. Introduction Heat energy is transferred from a hot object to a cooler object.
The 3 methods of heat transfer are Conduction, Convection and Radiation.
Photo by NASA showing Earth’s surface dominated by water and clouds (condensed water vapour).
Heat arriving from the Sun by radiation at a given latitude varies during the year, largely due to the
rotational axis of the Earth being tilted 23.5 degrees to the plane of its orbit. Total radiant energy arriving
from the Sun has been estimated at 3,400,000 exajoules per year by Paul Breeze, in Power Generation
Technologies [Third Edition], 2019, and 120,000 terawatts or 3,780,000 exajoules, by Eric J. Chaisson in
his 2008 paper entitled ‘Long Term Global Heating from Energy Usage’.
According to bp’s Statistical Review of World Energy, the total energy used by humans for all their
activities in 2019 was 583.9 exajoules (just 0.017% of the energy arriving from the Sun). The above-
mentioned 2008 paper concludes that this quantity has a negligible effect on Earth’s climate.
Changes that could cause variation to climate are:
(i) an increase in the atmospheric gases that absorb and re-emit long wave radiation. The result of
reducing long wave radiation back into space is called ‘The Greenhouse Effect’, and
(ii) an increase in the evaporation and condensation processes of ‘The Water Cycle’, in which global
atmospheric circulation transports water vapour and associated latent heat towards the poles.
The Science of Climate Change December 2022
4 of 31
2. Composition of Earth’s Atmosphere
https://en.wikipedia.org/wiki/Atmosphere_of_Earth
https://legacy.climate.ncsu.edu/edu/Composition
Quote: The atmosphere is composed of a mix of several different gases in differing amounts. The
permanent gases whose percentages do not change from day to day are nitrogen, oxygen and
argon. Nitrogen accounts for 78% of the atmosphere, oxygen 21% and argon 0.9%. Gases like carbon
dioxide, nitrous oxides, methane, and ozone are trace gases that account for about a tenth of one
percent (0.1%) of the atmosphere.
Water vapor (US spelling) is unique in that its concentration varies from 0 to 4% of the atmosphere
depending on where you are and what time of the day it is. In the cold, dry artic regions water vapor
usually accounts for less than 1% of the atmosphere, while in humid, tropical regions water vapor can
account for almost 4% of the atmosphere (nearly 100 times the concentration of CO2).
Water vapor is very important in predicting weather.
2.1 Atmospheric Transport (Winds)
https://www.encyclopedia.com/earth-and-environment/atmosphere-and-weather/weather-and-climate-terms-
and-concepts/advection-earth-sciences
Advection
Quote: Advection is a lateral or horizontal transfer of mass, heat, or other property. Winds that blow
across Earth's surface represent advectional movements of air. Convection tends to describe more
vertical movements.
Differential pressures and temperatures drive the mass movement of air seeking equilibrium (the
lowest energy state). Advective winds move from areas of higher temperature toward areas of lower
temperature and can cover many thousands of kilometres.
The Science of Climate Change December 2022
5 of 31
3. The Water Vapour Molecule and its Associated Latent Heat
https://www.briangwilliams.us/weather-change/latent-heat-and-adiabatic-cooling-and-warming.html
Quote: Water absorbs heat when it evaporates. This heat supplies the energy needed to break the
hydrogen bonds that hold molecules together as a liquid. Because it is used to break the hydrogen
bonds between individual molecules, this heat does not raise the temperature of the liquid water. It is
known as latent heat, because it appears to be hidden.
Heat energy that is absorbed when water evaporates is released when the hydrogen bonds form once
again and the water vapor condenses into liquid. Water vapor condenses when the air containing it
becomes saturated.
(Unquote) The diagram above shows the arrangements of water molecules in the three phases of solid,
liquid and gas. In the liquid phase at the centre, the molecules are aligned by the hydrogen bonds
between the positive charges on the hydrogen atoms and the negative charges on the oxygen atoms.
When heat is added to the liquid phase, a certain quantity (called the latent heat of vaporisation) is
needed to break the hydrogen bonds to form the gas phase with separated molecules. Heat added to
cause ice to change to liquid water is called the latent heat of fusion.
Radiation from the sun causes evaporation of water from the oceans. It also causes evaporation of
water from lakes, reservoirs, rivers and wet lands. Plants transpire under the radiant heat from the sun.
99% of the water absorbed by plant roots is transpired to atmosphere. The combined transition to
vapour from wet land containing plants is called evapotranspiration – see Section 16.
The release of latent heat when water vapour condenses is responsible for (i) thunderstorms and
tropical cyclones in the intertropical zone, and (ii) the transfer of heat energy towards the poles by the
Ferrel Cells of global atmospheric circulation – see Section 10.
If there was no transfer of latent heat by water vapour, the equator would be much hotter and the
poles much colder than they are. The latent heat property of water makes the world inhabitable.
The Science of Climate Change December 2022
6 of 31
4. Radiation and the ‘Greenhouse Effect’.
In 1988, Dr James Hansen of NASA Goddard Institute for Space Studies (GISS) told a US Congressional
Committee that ‘it was 99 percent certain that the warming trend (of climate) was not a natural
variation, but was caused by a build-up of CO2 and other artificial gases in the atmosphere.’
IPCC Report AR1 1990 The diagram below of the ‘Greenhouse Effect’ is from the Intergovernmental
Panel on Climate Change (IPCC) Report, Policymakers Summary, page 22 of 414.
IPCC AR1 1990 Chapter 1. Greenhouse Gases and Aerosols. Page 7 (or 55 of 414) quote: Tropospheric
Water Vapour is the single most important greenhouse gas… Author’s Note: According to 1990 data from
the UN Food & Agriculture Organisation (FAO), around 2,500 billion tonnes of freshwater were distributed
over crops sown in semi-arid and desert land during Spring and Summer. The atmospheric content of water
vapour over irrigated fields is greatly increased by evapotranspiration – explained fully in Section 16 below.
IPCC AR2 1995 Chapter 3. Observed Climate Variability and Change
161 (page 175 of 588) 3.3.7. Water vapour is the most abundant greenhouse gas and makes the largest
contribution to the natural greenhouse effect.
IPCC AR3 2001 Chapter 1: The Climate System: An Overview
88 (page 99 of 893) The most variable component of the atmosphere is water in its various phases such as
vapour, cloud droplets, and ice crystals. Water vapour is the strongest greenhouse gas. For these reasons,
and because the transition between the various phases absorbs and releases much (latent heat) energy,
water vapour is central to the climate and its variability and change.
2010
Following more computer-modelling of climate effects, NASA GISS staff published the above paper,
which reduced their emphasis on the role of CO2, and concluded, quote: “water vapour is the dominant
contributor (~50% of the effect), followed by clouds (~25%) and CO2 (20%).”
IPCC Report 2013 FAQ 8.1 states: “The contribution of water vapour to the natural greenhouse
effect relative to that of carbon dioxide (CO2) depends on the accounting method, but can be considered
to be approximately two to three times greater.”
The Science of Climate Change December 2022
7 of 31
5. Evaporation and Condensation of the ‘Water Cycle’.
Water vapour evaporating from the sea, lake, or wet/irrigated land contains latent heat energy due to
the phase change from liquid to gaseous phase. The vapour is unseen until it reaches cooler
atmospheric conditions, where it condenses to form clouds and rain or snow.
In the left-side diagram, winds move water vapour laterally from over sea to cooler conditions on land,
especially over hills and mountains. The lateral movement can extend to more than 1000 km, depending
on the wind speed. This is a relatively gentle process that can happen all-year-round in temperate
climates like the UK. On condensation, the latent heat is gradually released to the surrounding air.
In the right-side diagram, there is more vertical movement of the humid air, and cumulus clouds can
build-up over the sea or over wet/irrigated land to a height of 3km to 6km. Updraughts due to the warm
humid air rising higher eventually reach much cooler air at 6km to 12km height, and down-draughts are
formed after condensation and release of latent heat energy. The up and down air movements generate
electrical charge in the clouds, which then discharges as lightning. The rapid expansion and contraction
of the air from the heat of the lightning flash generates thunder.
In the tropics, thunderstorms are common all-year-round, but occur mainly during the summer in
temperate regions.
Hurricanes and typhoons can form only when the ocean or sea temperature is more than 27oC. At this
temperature, sufficient water vapour rises into the atmosphere with associated latent heat that on
condensation releases the energy required to sustain the swirling motion. The swirling of the cyclone is
generated by the Coriolis effect near the tropics, where the Earth’s rotational speed is greatest.
Tropical cyclones have been noted to sustain over wet land. Wikipedia describes this ‘Brown Ocean
effect’ in detail, and states: “A 2013 NASA Study found that, from 1979-2008, 45 of 227 tropical storms
either gained or maintained strength after making landfall. The press release stated, "The land
essentially mimics the moisture-rich environment of the ocean, where the storm originated.”
Crop irrigation can create wet land conditions that are sufficient to sustain tropical cyclones, but are
more likely to develop other severe weather systems, such as thunderstorms and tornadoes.
The Science of Climate Change December 2022
8 of 31
https://earthobservatory.nasa.gov/features/Water
5.1 The Water Cycle - by NASA
By Steve Graham, Claire Parkinson, and Mous Chahine
Design by Robert Simmon October 1, 2010
Viewed from space, one of the most striking features of our home planet is the water, in both liquid and
frozen forms, that covers approximately 75% of the Earth’s surface. Geologic evidence suggests that
large amounts of water have likely flowed on Earth for the past 3.8 billion years—most of its existence.
Believed to have initially arrived on the surface through the emissions of ancient volcanoes, water is a
vital substance that sets the Earth apart from the rest of the planets in our solar system. In particular,
water appears to be a necessary ingredient for the development and nourishment of life.
Note that Earth is a water planet: three-quarters of the surface is covered by water, and water-rich
clouds fill the sky.
Water, Water, Everywhere
Water is practically everywhere on Earth. Moreover, it is the only known substance that can naturally
exist as a gas, a liquid, and solid within the relatively small range of air temperatures and pressures
found at the Earth’s surface.
Despite its small amount relative to the oceans, water vapor (US spelling) has a huge influence on the
planet. Water vapor is a powerful greenhouse gas, and it is a major driver of the Earth’s weather and
climate as it travels around the globe, transporting latent heat with it.
Latent heat is heat obtained by water molecules as they transition from liquid or solid to vapor; the heat
is released when the molecules condense from vapor back to liquid or solid form, creating cloud
droplets and various forms of precipitation.
For human needs, the amount of freshwater on Earth—for drinking and agriculture—is particularly
important. Freshwater exists in lakes, rivers, reservoirs, groundwater, and frozen as snow and ice.
A Multi-Phased Journey
The water, or hydrologic, cycle describes the pilgrimage of water as water molecules make their way
from the Earth’s surface to the atmosphere and back again, in some cases to below the surface. This
gigantic system, powered by energy from the Sun, is a continuous exchange of moisture between the
oceans, the atmosphere, and the land.
While evaporation from the oceans is the primary vehicle for driving the surface-to-atmosphere portion
of the hydrologic cycle, plant transpiration on land is also significant. For example, a cornfield 1 acre in
size can transpire as much as 4,000 gallons of water every day.
After the water vapor enters the lower atmosphere, air currents may carry it laterally for thousands of
kilometres, or sometimes high into the atmosphere, in both cases to where the air is cooler. In the cool
air, water vapor condenses from a gas to a liquid to form cloud droplets and to release its latent heat.
Cloud droplets can grow and produce precipitation - including rain, snow, sleet, freezing rain, and hail.
Added Note to Aid Understanding:
The processes of evaporation and condensation, with associated absorption and release of latent heat,
are the Basic Physics of refrigerators and freezers, air-conditioners, and (in reverse) heat pumps.
The Science of Climate Change December 2022
9 of 31
5.2 Universities of San Diego (ucsd.edu) and Arizona on the Water Cycle
http://earthguide.ucsd.edu/virtualmuseum/climatechange1/09_1.shtml
Water and Heat Storage
When water evaporates, the heat expended in the phase change of water to vapor is not lost, but is contained in
the vapor in latent form. When the vapor condenses, the latent heat is freed for warming the surrounding air.
The phase changes of water combined with its unique heat-related properties are intimately involved in all
aspects of climate and weather.
Water transfers and stores heat on an immense scale, and thereby evens out the temperature differences
between day and night, summer and winter, tropics and polar areas.
http://www.atmo.arizona.edu/students/courselinks/fall14/atmo336/lectures/sec1/water.html
Water Cycle (also called Hydrologic or Hydrological Cycle)
The water cycle refers the continuous movement of water on, above, and below the surface of the Earth. Water
can change phase among liquid, gas (water vapor), and solid (ice) at various places in the cycle.
Energy from the sun drives the water cycle. Liquid water on or slightly below the Earth's surface evaporates into
the air, becoming the gas water vapor. The vapor in gaseous form is invisible, and remains in that phase until it
either reaches a cooler area by (a) moving laterally by wind, usually poleward, or (b) higher in the atmosphere.
When water vapor condenses, large amounts of heat - called latent heat - are released into the atmosphere.
Latent heat is an important source of energy in the melting of ice and permafrost, and the development of
thunderstorms and hurricanes.
The Science of Climate Change December 2022
10 of 31
6. Observations of Temperature Change.
World Temperature Changes Noted by IPCC 2007 and NASA 2017
IPCC Report AR4 WGII: Climate Change 2007 – Impacts, Adaptation and Vulnerability.
Map from page 10 (21 of 987) - Summary for Policymakers.
**
Figure SPM.1. Locations of changes in surface air temperature over the period 1970-2004, showing
mainly Northern Hemisphere warming, with no overall change in the Antarctic area.
NASA’s similar map used data from 6,300 land and marine-based stations. It shows Earth’s average
global temperature from 2013-17, as compared to a baseline average from 1951 to 1980.
Extracted from:
https://www.nasa.gov/press-release/long-term-warming-trend-continued-in-2017-nasa-noaa
The temperature changes noted in the IPCC 2007 map were confirmed by NASA in 2017.
• Northern areas have experienced warming of more than 2 degrees F (~1.1 deg. C).
• Large areas below 50 degrees South have cooled by 0.5 to 1 degree F.
There were no observations of overall global warming.
The Science of Climate Change December 2022
11 of 31
More Recent World Temperature Trends, 1990-2020
https://www.climate.gov/news-features/understanding-climate/climate-change-global-temperature
Increasing temperatures were observed over higher northern latitudes. Temperatures have reduced in
areas south of 45oS – very similar to the results noted by the IPCC in 2007 and NASA in 2017.
The Science of Climate Change December 2022
12 of 31
7. The US National Snow and Ice Data Centre (NSIDC)
publishes results from satellite observations by NASA of Arctic and Antarctic Sea Ice Extent.
NASA issued a summary of Antarctic Sea Ice Extent on 16th September 2016:
see https://earthobservatory.nasa.gov/features/SeaIce
Quote: “Since 1979, the total annual Antarctic Sea Ice Extent has increased about 1 percent per decade.
For three consecutive Septembers (2012 to 2014), satellites observed new record highs for winter sea ice
extent around Antarctica. The largest of those occurred in September 2014, when the ice reached 20.14
million square kilometres (7.78 million square miles).
You might wonder how Antarctic Sea ice could be increasing while global warming(?) is raising the
planet’s average surface temperature. It’s a question that scientists are asking, too.”
Over the last 42 years, minimum Arctic Sea Ice (top graph) has reduced from 7.5 million km2 to less than
4 million km2. There has been no significant change in Antarctic Sea Ice Extent (lower graph), even
though atmospheric concentration of CO2 increased from 335 ppm to 412 ppm.
Increasing atmospheric CO2 content is not affecting the Antarctic area.
The Science of Climate Change December 2022
13 of 31
7.1 Increased Arctic Ice since the Low Point of September 2012.
Areas of Arctic Sea Ice noted by the US NSIDC in Septembers of 2012, 2021 and 2022.
Maps extracted from https://www.climate4you.com/
Website section entitled: Sea Ice Extension in a longer time perspective
Arctic Sea Ice Extent is a minimum during September each year.
The all-time minimum extent of 3.6 million km2 was observed by NSIDC over September 2012.
The September 2021 extent increased to 4.9 million km2.
The September extent of 4.9 million km2 was
repeated in 2022.
Arctic Sea Ice Extent has increased by 36%, while
atmospheric CO2 content increased by 5.6%.
The increase is very likely due to distribution of
less irrigation water over lower latitude farms.
The Science of Climate Change December 2022
14 of 31
8. Southern Hemisphere Glaciers
Patagonia
Pio XI glacier at latitude 49 deg 8 min South. Perito Moreno glacier at latitude 50 deg 28 min South.
The European Space Agency (ESA) has presented evidence showing that the Pio XI Glacier in southern
Chile has been advancing over the last 60 years.
The Perito Moreno Glacier located in southern Argentina has been advancing and is now stable. These
observations add evidence that climate temperatures are not increasing in the Southern Hemisphere.
New Zealand
Observations carried out by scientists from Victoria University of Wellington and the National Institute of
Water and Atmospheric Research (NIWA), were reported in the scientific journal Nature
Communications.
https://www.wgtn.ac.nz/news/2017/02/explaining-new-zealands-unusual-growing-glaciers
Quote: “At least 58 New Zealand glaciers advanced between 1983 and 2008, with Franz Josef Glacier at
43 degrees South (Kā Roimata o Hine Hukatere) advancing nearly continuously during this time……lower
temperature caused the glaciers to advance, rather than increased precipitation as previously thought.”
The Science of Climate Change December 2022
15 of 31
9. Atmospheric content of CO2 in Hawaii and at the South Pole, 1957-2020.
Source: https://scrippsco2.ucsd.edu/graphics_gallery/mauna_loa_and_south_pole/mauna_loa_and_south_pole.html
The records kept by the Scripps Institution of Oceanography in San Diego show that the atmospheric
content of CO2 at the South Pole, and at Mauna Loa in Hawaii (at latitude 20 degrees North), are similar.
CO2 concentration has increased worldwide from 315ppm in 1960 to 420ppm (0.042%, or ~4 parts in
10,000) in 2022, but there has been no reduction in Antarctic Sea ice or Southern Hemisphere glaciers. It
is therefore very unlikely that the reduction of Arctic Sea Ice is caused by increased atmospheric CO2.
The Science of Climate Change December 2022
16 of 31
9.1 Carbon Dioxide Concentration over Geologic Time
https://www.geocraft.com/WVFossils/Carboniferous_climate.html
There has historically been much more CO2 in our atmosphere than exists today. For example, during
the Jurassic Period (200 million years ago), average CO2 concentrations were about 1800 ppm or about
4.7 times higher than today.
Environmental Impact
The first fish evolved over 500 million years ago, and ammonites, the largest shellfish fossils, first
appeared 420 million years ago. Both species were not harmed by CO2 concentrations > 3000 ppm.
CO2 is a basic requirement for photosynthesis, and is therefore food for phytoplankton and all plants.
Horticulturalists raise the CO2 concentration to 1000 ppm in greenhouses to improve crop yield. The UK
Health and Safety Executive allows concentration up to 5000 ppm for 8-hours in a work environment,
Coral Reefs
https://www.theguardian.com/environment/2021/feb/18/great-barrier-reef-found-to-be-in-failing-
health-amid-calls-for-urgent-action
The Guardian, February 2021: Rather than ocean warming or acidification, the Queensland government
says dissolved inorganic nitrogen - originating from farm fertilisers - is linked to algal blooms, outbreaks
of coral-eating starfish and coral disease at the Great Barrier Reef.
Dr Lissa Schindler, Great Barrier Reef campaigner at the Australian Marine Conservation Society, said:
“Improving water quality needs the support and dedication of all farmers and graziers in Queensland
and they’ll need backing from the Queensland government to adopt the best practices required,”
Schindler said. “That’s why we are calling for more funding to help the agricultural sector comply quickly
with the regulations.”
The Science of Climate Change December 2022
17 of 31
10. Global Atmospheric Circulation.
UK MetOffice quote: “The big temperature difference between the poles and equator causes global
circulation, which provides a natural air conditioning system to stop the equator becoming hotter, and
poles becoming colder.” Notes have been added on regions of evapotranspiration and condensation.
Global Atmospheric Circulation contains warm, dry, high-pressure zones close to latitudes 30o North and
South, creating arid and desert regions due to lack of rain. These regions can be considered as extending
from 15o to 45o latitudes due to the tilt of the Earth’s axis.
Crop irrigation in the Northern Hemisphere at these latitudes produces water vapour that is carried
north-east by prevailing South Westerly winds in the Ferrel Cell, which extends from 30oN to 60oN.
Reports have described irrigation in the western USA causing increased rainfall 1000+ km downwind to
the northeast. Irrigation over farms and vineyards in Spain is likely to increase rainfall over Germany.
Winds in the Hadley Cells ensure that most water vapour here is driven towards the Equator to sustain
jungle vegetation. The UK has a mild, wet climate due to prevailing South Westerlies from the Atlantic.
Increasing crop irrigation in the Southern Hemisphere very likely explains recent observations of
increased summer rainfall in Australia, and summer warming plus reduced sea ice around Antarctica.
The Science of Climate Change December 2022
18 of 31
11. Scientific Papers on the Effects of Vast Mid-Continent Areas of Irrigation
The major areas of the world subject to agricultural irrigation are located in North America and Asia.
Irrigating normally dry regions increases local atmospheric concentration of water vapour.
1992
The hydrological cycle and its influence on climate
Article by Moustafa T. Chahine, at the NASA Jet Propulsion Laboratory, California.
Quote: “In the short span of about 10 years, the hydrological cycle has emerged as the centrepiece of the
study of climate, but basic changes are still required in this field. Hydrological science must adjust itself
to become a discipline not unlike atmospheric science or oceanography. Rather than fragmented studies
in engineering, geography, meteorology and agricultural science, we need an integrated program of
fundamental research and education in hydrological science.”
2005
Human modification of global water vapor flows from the land surface
Quote: “It is well known that irrigation is, by far, the largest water user in terms of liquid water
withdrawal from rivers and aquifers, and that human modification of the hydrological cycle has
profoundly affected the flow of liquid water across the Earth’s land surface.”
“Fig.3 Additional local water vapor flows due to irrigation (mmyr), defined as the change in vapor flows
when irrigation is added to actual vegetation. The total increase in vapor flows amounts to 2,600
km3/year (2,600 billion tonnes/year).”
World population in 2005 was 6.5 billion – now (2022) it is 8 billion.
The Science of Climate Change December 2022
19 of 31
2010
Quote: “4. Summary and Conclusion
Irrigation over the Ogallala Aquifer of the central United States increased dramatically over the 20th
century. A long‐term record of station and gridded precipitation observations covering the entire 20th
century shows that July precipitation increased 15–30% in a broad region downwind of the Ogallala
Aquifer, stretching from eastern Kansas through Indiana.”
2012
Quote: “Increased water vapour was prominent over the Canadian Arctic Archipelago, especially in the
summer months; the strong summer trends in this region are also seen in the radiosonde data. A feature
common to all of the reanalyses is a region of increases in precipitable water centred over the Beaufort
and Chuckchi Seas in August and September, corresponding to where reductions in end-of-summer
summer sea ice extent have been most pronounced.”
Multiple crop circles created by centre-pivot irrigation systems near Lethbridge, Canada. Water vapour
emissions, with associated latent heat, are transported poleward by global atmospheric circulation.
The Science of Climate Change December 2022
20 of 31
2013
Quote: “The Aral Sea is a saline lake, located in the middle of Central Asia. This brackish water body was
the world’s fourth largest lake before it started to shrink in the 1960’s due to water withdrawal for land
irrigation. 85 % of the water flow has been diverted for agriculture.”
Deserted ships lying on the old bed of the Aral Sea. Evaporation of the water used for irrigation of farms
in Uzbekistan and other surrounding areas has been carried poleward by global atmospheric circulation.
On reaching cooler conditions the vapour condenses, producing rain, releasing its latent heat and
melting permafrost and Arctic Ice.
2015
Abstract Increasing daily precipitation intensity is strongly associated with increasing water vapor in
the atmosphere over northern Eurasia based on this study of 35 years of daily precipitation, specific
humidity, and air temperature observations at 152 stations. Results suggest that increased atmospheric
water vapor is the direct link to more frequent intense events of precipitation and increased risk of
flooding under a warming climate via increasing precipitation intensity.
The Science of Climate Change December 2022
21 of 31
12. World Population and Freshwater Withdrawals for Agriculture
In 1960, world human population was 3 billion. The present, 2022 population is 8 billion.
Around 90% of people live in the Northern Hemisphere.
Increase of freshwater withdrawal graph is extracted from 2018 film ‘The World’s Water Crisis,
Explained’. The graph, by the United Nations Food and Agriculture Organisation, shows 4,250 km3
withdrawn in 2010 from rivers, lakes and underground aquifers. The UN FAO advised that 70% of it
(2,975 km3) was used for crop irrigation.
Note that 1 km3 of water weighs 1 billion tonnes. and that water withdrawn from underground aquifers
adds to the rise in sea level, following evapotranspiration, condensation and runoff.
The Science of Climate Change December 2022
22 of 31
Additional Sources of Water Withdrawal Data.
The chart above, from a 2020 paper by the World Resources Institute, shows 3,200 km3 used for
irrigation over the years 2000 to 2014.
The United Nations Food and Agriculture Organisation (FAO) noted the vast increase in freshwater
withdrawals over the years 1900 - 2010.
https://www.fao.org/aquastat/en/overview/methodology/water-use
Quote by UN FAO: ‘The chart below shows global water withdrawal over time, including (in addition to
the water withdrawal for Agriculture, Industries & Municipalities) the evaporation from Reservoirs,
which are artificial lakes created when a dam is built. 300 billion tonnes of water evaporated from their
surface areas in 2010. While this is not a water withdrawal per se, it should be considered as an
anthropogenic consumptive water use, since this evaporation would not take place without the human
intervention of building a dam to store freshwater resources for different purposes, such as for
withdrawal by one of the above sectors, for generating electricity (hydropower), etc.’
The Science of Climate Change December 2022
23 of 31
13. Dams of the World and Paddy Fields
https://www.worldatlas.com/articles/the-largest-man-made-lakes-in-the-world.html
Human-made Lakes
Some of the earliest dam reservoirs were constructed about 4000 years ago in Egypt, China, and
Mesopotamia and their primary purposes were irrigation and supply of drinking water. Requirements
may now include commercial fisheries, power generation, industrial and cooling water supplies,
commercial sports, and other recreational activities.
The Largest Man-made Lakes in the World.
There were no large dams in the world before year 1900. The Hoover Dam was constructed on the
Colorado River at latitude 36oN between 1930 and 1936. It is the highest concrete arch dam in the USA
and impounds the Lake Mead reservoir, which extends for 115 miles (185 km) upstream.
The Three Gorges Dam on the Yangtse River at 31oN in China was constructed over the years 1994 to
2012. It is 2,335 m (7,661 ft) long and the top of the dam is 185 m (607 ft) above sea level. The dam
reservoir is on average about 660 km (410 mi) in length. It contains 39.3 km3 of water with total surface
area of 1,045 km2 (403 sq mi).
The Largest Man-Made Lakes In The World
Rank Reservoir Volume km³ River Dam Country Year
1 Lake Kariba 180.6 Zambezi River Kariba Dam Zambia/Zimb. 1959
2 Bratsk Reservoir 169 Angara River Bratsk Dam Russia 1964
3 Lake Volta 150 Volta River Akosombo Dam Ghana 1965
4 Manicouagan Reservoir 141.8 Manicouagan River Daniel-Johnson Dam Canada 1968
5 Lake Guri 135 Caroní River Guri Dam Venezuela 1986
6 Lake Nasser 132 Nile River Aswan High Dam Egypt 1971
7 Williston Lake 74.3 Peace River W. A. C. Bennett Dam Canada 1967
8 Krasnoyarsk Reservoir 73.3 Yenisei River Krasnoyarsk Dam Russia 1967
9 Zeya Reservoir 68.4 Zeya River Zeya Hydroelectric Station Russia 1978
10 Robert-Bourassa Reservoir 61.7 La Grande River Robert-Bourassa gen. stn. Canada 1981
11 La Grande-3 Nord Reservoir 60 La Grande River La Grande-3 gen. stn. Canada 1981
12 Ust-Ilimsk Reservoir 59.3 Angara River Ust-Ilimsk Dam Russia 1977
13 Boguchany Reservoir 58.2 Angara River Boguchany Dam Russia 1989
14 Kuybyshev Reservoir 58 Volga River Zhiguli Hydroelectric Stn. Russia 1955
15 Cahora Bassa 55.8 Zambezi River Cahora Bassa Dam Mozambique 1974
The Science of Climate Change December 2022
24 of 31
https://www.globaldamwatch.org/intelligence
GDW intelligence (GDW-i) is a knowledge system providing live dam mapping, curation, research, analysis and
visualisation tools for data on dams with greater than 15m height. It allows addition and editing of dam data by
country and basin and also supports analysis, visualisation and download of data. GDW-i also provides a suite of
analytical tools in support of policy and decision making. Scroll down to the message “Click the image below to
enter GDW-i.” That gives access to the records of each country, see the examples below.
United States of America - 60,344 registered dams on 10/Nov/2022.
China – 15,742 registered dams.
India - 9,872 registered dams.
The Science of Climate Change December 2022
25 of 31
Brown Ocean Paddy Fields
Many dam reservoirs provide water for growing rice. These scenes of water vapour over paddy fields are from
Program 2 of the 3-program TV series by PBS/WGBH entitled: ‘H2O the Molecule that Made Us’. The
commentator states: “China is the Water Kingdom. The molecule is at the heart of this entire civilisation.”
During the program the commentator advises that “China has 87,000 dams and the USA has 84,000.” These
quantities may include dams with less than 15m height, or they have not been registered with GDW
The Science of Climate Change December 2022
26 of 31
14. Centre-pivot Irrigation Systems
Centre-pivot irrigation systems were developed for use in the mid-west of the USA. They withdraw
water by drilling wells into the Ogallala underground aquifer and use pumps to raise it to the surface.
This method has been used in other arid areas such as Saudi Arabia and eastern Australia.
Irrigation Circles near Imperial, Nebraska, USA, 40 N 102 W Image Date 09/2016
Saudi Arabia Wadi As Sirhan 30 deg N 38 deg E Image Date 12/2015
The Science of Climate Change December 2022
27 of 31
11. Media Reports of World Crop Irrigation
Since 1940, vast areas of normally uncultivated land have been converted to crop production to feed the
ever-increasing world population. Atmospheric water vapour is increased by evaporation from damp
soil, and mainly by transpiration from plant leaf stomata.
New York Times Report on the ‘Irrigation Juggernaut’, September 2010, stated, quote: “Anyone who has
flown over the American West on a clear day has probably noticed the enormous effect that irrigated
farming has had on the landscape of the country. Fields of corn, potatoes and other crops can be seen
dotting land that would otherwise be semi-desert, and the spray from some types of irrigation systems
creates perfect circles of green in these parched landscapes.”
The Guardian article, May 2012, entitled ‘Fresh water demand driving sea-level rise faster than glacier
melt’ states, quote: “Trillions of tonnes of water have been pumped up from deep underground
reservoirs in every part of the world.”
The Physics Today article, November 2016, entitled ‘Land’s complex role in climate change’ states,
quote: “The irrigation of semi-arid land can dramatically alter a region’s water balance. Due to the
combined effects of evaporation and transpiration, collectively termed evapotranspiration, increases in
ground moisture tend to raise humidity in the overlying atmosphere.”
Rice paddies are particularly water-dependent. Each pound of rice takes about 300 gallons of water to
produce. The 2021 TV Series ‘Age of Humans’ by the Smithsonian Channel advised, quote: “Rice paddies
are the main source of nutrition for half the population of the planet.”
The Science of Climate Change December 2022
28 of 31
12. Latent Heat of Evaporation (& Condensation) of Water used for World Irrigation
Source: USGS/Salinity Management Organisation Image from www.shoalwater.nsw.gov.au
The total vapour flow from irrigation is the combined quantity from soil and plant leaves called
‘evapotranspiration’. North Carolina State University explained, quote:
“The Evaporation in evapotranspiration refers to water evaporated from over land. This includes
evaporation from soil, wetlands, and standing water from places like roofs and puddles. It can also refer
to direct evaporation of liquid water from the leaf surface of the plant.
Transpiration happens when plants release water vapor from tiny holes, called stomata, in their
leaves. This is caused in part by the chemical and biological changes that occur as the plant undergoes
photosynthesis and converts carbon dioxide into oxygen. Plants transpire up to 99% of the water
absorbed by their roots to cool down their leaves, thus performing the same function as a human
sweating. The picture above shows the stomata on the underside of the leaf releasing water vapor (blue
arrow) because of the warmth from the sun.”
The total of water used for crop irrigation is approximately 3,000 billion tonnes p.a., see section 10.
Around 90% of it is converted to 2,700 billion tonnes of water vapour by radiant heat from the sun.
The energy required from the Sun per year to evaporate water on the ground and inside plant leaves
for transpiration is therefore the weight of water transformed to vapour multiplied by the latent heat
of evaporation, which is: 2,700 x 1012
kg x 2.260 x 106
J/kg = 6,102 exajoules/year.
This quantity is more than 10 times the energy consumed for all other human activities, including
domestic heating, industry and transport, as noted on page 3. Due to most crop irrigation being done in
the Northern Hemisphere above latitude 20oN, around 90% of this total water vapour and associated
latent heat energy is carried further North by atmospheric circulation in the Ferrel Cell.
On reaching cooler altitudes or latitudes, the extra vapour from irrigation condenses to release its latent
heat, leading to increased cloud formation, ~2,400 billion tonnes of extra Northern Hemisphere rain,
more violent storms, reduced permafrost, and melting Arctic and Himalayan ice.
The Science of Climate Change December 2022
29 of 31
Appendix - IPCC Reports on Atmospheric Water Vapour and associated Latent Heat.
The Intergovernmental Panel on Climate Change (IPCC) Assessment Reports AR1, AR2 and AR3 have
numerous sections on the effect of water vapour and associated latent heat, see below.
The Summaries for Policymakers (SPMs) of these Reports, and those issued later, largely ignore these
observations of increased water vapour and Northern Hemisphere precipitation.
The SPMs concentrate on the ‘radiative forcing’ of other greenhouse gases (mainly carbon dioxide), and
completely ignore the Southern Hemisphere observations described in Sections 6 to 8 above.
IPCC AR1 1990
Policymakers Summary states:
xxxviii (46) Water vapour, evaporated from the ocean surface, is transported by the atmospheric
circulation and provides latent heat energy to the atmosphere.
Chapter 1. Greenhouse Gases and Aerosols
7 (55) Tropospheric water vapour is the single most important greenhouse gas, but its atmospheric
concentration is not significantly influenced by direct anthropogenic emissions (activities).
Note: The IPCC chose to ignore the effect of 2,500 billion tonnes of crop irrigation water distributed over
semi-arid and desert land in 1990.
Chapter 7. Observed Climate Variation and Change
232 (280) 7.11.3 Tropical Cyclones
Tropical cyclones derive their energy mainly from the latent heat contained in the water vapour
evaporated from the oceans.
Chapter 11. Narrowing the Uncertainties
320 (368) 11.2 3 Precipitation and Evaporation
The condensation of water is the main energy source of the atmospheric heat engine and the transport
of water vapour by the atmospheric circulation is a key process in the redistribution of the Sun’s energy
in the Earth system.
IPCC AR2 1995
Chapter 1. The Climate System: an overview
61 (page 75 of 588) 1.4.2 The Role of the Oceans
Water vapour, evaporated from the ocean surface, provides latent heat energy to the atmosphere.
Chapter 3. Observed Climate Variability and Change
161 (page 175 of 588) 3.3.7 Water Vapour
Water vapour is the most abundant greenhouse gas and makes the largest contribution to the natural
greenhouse effect.
163 (177) 3.3.9 Summary of Section 3,3.
Precipitation has increased over land in high latitudes of the Northern Hemisphere, especially during
the autumn.
The Science of Climate Change December 2022
30 of 31
Chapter 4. Climate Processes
200 (214) 4.2.1 Water Vapour Amounts
Since water vapour is the most important greenhouse gas, such increases in water vapour enhance the
greenhouse effect; that is, they reduce the thermal infrared (long-wave) flux leaving the atmosphere-
surface system,
Chapter 6. Projections of Future Climate
332 (346) 6.5.4 Extreme Wind Events
6.5.4.1 Mid-latitude storms
The main energy sources for mid-latitude depressions are the temperature contrast between the cold
polar regions and the warmer sub-tropical conditions, and the release of latent heat as water vapour
condenses in the warm, poleward moving, ascending air.
Chapter 7. Change in Sea Level
379 (393) Ground water (underground aquifer) depletion.
Ground water pumped at a rate in excess of recharge may add to sea level. Much of this water is used
for irrigation and a major fraction is transpired or evaporated to the atmosphere or contributes to
runoff, eventually reaching the sea.
Chapter 8. Detection of Climate Change and Attribution of Causes
437 (451) 8.5.3 Diurnal Temperature Range (DTR)
Several studies in Chapter 3 reported that, since the 1950s, minimum temperatures have increased two
to three times faster than maximum temperatures over large areas of land in the Northern Hemisphere.
The result is a reduction in DTR, especially during summer and autumn.
Note: This is a result of spring and summer crop irrigation.
IPCC AR3 2001
Technical Summary
30 (page 41 of 893) It is likely that total atmospheric water vapour has increased several per cent per
decade over many regions of the Northern Hemisphere.
A pattern of overall surface and lower-tropospheric water vapour increases over the past few decades is
emerging from the most reliable data sets, although there are likely to be time-dependent biases in
these data and regional variations in the trends. Water vapour in the lower stratosphere is also likely to
have increased by about 10% per decade since the beginning of the observational record (1980).
Note: No reference to the quantity of water used for crop irrigation.
Northern Hemisphere sea-ice amounts are decreasing, but no significant trends in Antarctic sea-ice
extent are apparent.
New data indicate that there likely has been an approximately 40% decline in Arctic sea-ice thickness in
late summer to early autumn between the period of 1958 to 1976 and the mid-1990s, and a
substantially smaller decline in winter.
34 (45 of 893) The decrease in the continental diurnal temperature range coincides with increases in
cloud amount, precipitation, and increases in total water vapour.
The Science of Climate Change December 2022
31 of 31
The increases in total tropospheric water vapour in the last 25 years are qualitatively consistent with
increases in tropospheric temperatures and an enhanced hydrologic cycle, resulting in more extreme
and heavier precipitation events in many areas with increasing precipitation, e.g., middle and high
latitudes of the Northern Hemisphere.
Chapter 1: The Climate System: An Overview
88 (99) The most variable component of the atmosphere is water in its various phases such as vapour,
cloud droplets, and ice crystals. Water vapour is the strongest greenhouse gas. For these reasons, and
because the transition between the various phases absorbs and releases much energy, water vapour is
central to the climate and its variability and change.
89 (100) As an example, the atmosphere and the oceans are strongly coupled and exchange, among
others, water vapour and (latent) heat through evaporation. This is part of the hydrological cycle and
leads to condensation, cloud formation, precipitation and runoff, and supplies energy to weather
systems.
Chapter 2: Observed Climate Variability and Change
101 (112) Over the last twenty-five years, it is likely that atmospheric water vapour has increased over
the Northern Hemisphere in many regions.
103 (114) The more reliable data sets show that it is likely that total atmospheric water vapour
has increased several per cent per decade over many regions of the Northern Hemisphere since the
early 1970s. Changes over the Southern Hemisphere cannot yet be assessed.
Note: The IPCC Reports failed to appreciate that the freshwater distributed for crop irrigation, at least
2,800 billion tonnes in year 2001, greatly increased the water vapour flux over North America and Asia.
146 (157) 2.5.3 Water Vapour
148 (159) The longer, more reliable data sets suggest multidecadal increases in atmospheric water
vapour of several per cent per decade over regions of the Northern Hemisphere.
163 (174) The decrease in the continental diurnal temperature range since around 1950 coincides with
increases in cloud amount and, at least since the mid-1970s in the Northern Hemisphere, increases in
water vapour.
164 (175) The increases in lower-tropospheric water vapour and temperature since the mid-1970s are
qualitatively consistent with an enhanced hydrological cycle. This is in turn consistent with a
greater fraction of precipitation being delivered from extreme and heavy precipitation events, primarily
in areas with increasing precipitation, e.g., mid- and high latitudes of the Northern Hemisphere.
Chapter 11: Changes in Sea Level
657 (668) 11.2.5 Surface and Ground Water Storage and Permafrost
Volumes of many of the world’s large lakes have been reduced in recent decades through increased
irrigation and other water use. Sahagian et al. (1994) and Sahagian (2000) estimate
that the reduced volumes of the Caspian and Aral Seas (and associated ground water) contribute 0.03
and 0.18 mm/year to sea level rise, on the assumption that the extracted water reaches the world’s
ocean by evapotranspiration (followed by condensation and run off).

Weitere ähnliche Inhalte

Ähnlich wie The Science of Climate Change r1.pdf

Climate Change Paper - CO2 or Crop Irrigation?
Climate Change Paper - CO2 or Crop Irrigation?Climate Change Paper - CO2 or Crop Irrigation?
Climate Change Paper - CO2 or Crop Irrigation?Keith_Shotbolt
 
Presentation on climate change
Presentation on climate changePresentation on climate change
Presentation on climate changeAnkita Khobragade
 
Global_warming_presentation.pptx
Global_warming_presentation.pptxGlobal_warming_presentation.pptx
Global_warming_presentation.pptxviveksingh20861
 
Ch18 lecture 3e
Ch18 lecture 3eCh18 lecture 3e
Ch18 lecture 3eAHS
 
Climate presentation
Climate presentationClimate presentation
Climate presentationYCIS Beijing
 
Climate change co2 or crop irrigation
Climate change  co2 or crop irrigationClimate change  co2 or crop irrigation
Climate change co2 or crop irrigationKeith_Shotbolt
 
Poteplenie klimata O. Gunder_11-b
Poteplenie klimata O. Gunder_11-bPoteplenie klimata O. Gunder_11-b
Poteplenie klimata O. Gunder_11-bJulia Birhova
 
Climate change 101 - Introduction to Climate Change Science (UNDP presentation)
Climate change 101 - Introduction to Climate Change Science (UNDP presentation)Climate change 101 - Introduction to Climate Change Science (UNDP presentation)
Climate change 101 - Introduction to Climate Change Science (UNDP presentation)UNDP Eurasia
 
New Climate Change Statement from the American Meteorological Society
New Climate Change Statement from the American Meteorological Society New Climate Change Statement from the American Meteorological Society
New Climate Change Statement from the American Meteorological Society Earth Institute of Columbia University
 
VCE Environmental Science - Greenhouse Effect
VCE Environmental Science - Greenhouse EffectVCE Environmental Science - Greenhouse Effect
VCE Environmental Science - Greenhouse EffectHawkesdale P12 College
 
Climate change scenario_new
Climate change scenario_newClimate change scenario_new
Climate change scenario_newLallu Prathapan
 
Changing climate
Changing climateChanging climate
Changing climateromila123
 
Global warming zagidullina_veselova
Global warming zagidullina_veselovaGlobal warming zagidullina_veselova
Global warming zagidullina_veselovagalhavanas
 
Climate Change Basics: Issues and Impacts for Boating
Climate Change Basics:  Issues and Impacts for BoatingClimate Change Basics:  Issues and Impacts for Boating
Climate Change Basics: Issues and Impacts for BoatingNASBLA
 

Ähnlich wie The Science of Climate Change r1.pdf (20)

Climate Change Paper - CO2 or Crop Irrigation?
Climate Change Paper - CO2 or Crop Irrigation?Climate Change Paper - CO2 or Crop Irrigation?
Climate Change Paper - CO2 or Crop Irrigation?
 
Presentation on climate change
Presentation on climate changePresentation on climate change
Presentation on climate change
 
Global_warming_presentation.pptx
Global_warming_presentation.pptxGlobal_warming_presentation.pptx
Global_warming_presentation.pptx
 
Ch18 lecture 3e
Ch18 lecture 3eCh18 lecture 3e
Ch18 lecture 3e
 
Climate presentation
Climate presentationClimate presentation
Climate presentation
 
Climate change co2 or crop irrigation
Climate change  co2 or crop irrigationClimate change  co2 or crop irrigation
Climate change co2 or crop irrigation
 
Poteplenie klimata O. Gunder_11-b
Poteplenie klimata O. Gunder_11-bPoteplenie klimata O. Gunder_11-b
Poteplenie klimata O. Gunder_11-b
 
Climate change 101 - Introduction to Climate Change Science (UNDP presentation)
Climate change 101 - Introduction to Climate Change Science (UNDP presentation)Climate change 101 - Introduction to Climate Change Science (UNDP presentation)
Climate change 101 - Introduction to Climate Change Science (UNDP presentation)
 
Global warming
Global warmingGlobal warming
Global warming
 
2AM SEMINAR WORK
2AM SEMINAR WORK2AM SEMINAR WORK
2AM SEMINAR WORK
 
New Climate Change Statement from the American Meteorological Society
New Climate Change Statement from the American Meteorological Society New Climate Change Statement from the American Meteorological Society
New Climate Change Statement from the American Meteorological Society
 
Climate Change 2016
Climate Change 2016Climate Change 2016
Climate Change 2016
 
VCE Environmental Science - Greenhouse Effect
VCE Environmental Science - Greenhouse EffectVCE Environmental Science - Greenhouse Effect
VCE Environmental Science - Greenhouse Effect
 
shweta singh4.pdf
shweta singh4.pdfshweta singh4.pdf
shweta singh4.pdf
 
Climate change scenario_new
Climate change scenario_newClimate change scenario_new
Climate change scenario_new
 
Changing climate
Changing climateChanging climate
Changing climate
 
Global warming zagidullina_veselova
Global warming zagidullina_veselovaGlobal warming zagidullina_veselova
Global warming zagidullina_veselova
 
Climate Change Basics: Issues and Impacts for Boating
Climate Change Basics:  Issues and Impacts for BoatingClimate Change Basics:  Issues and Impacts for Boating
Climate Change Basics: Issues and Impacts for Boating
 
Global Warming
Global WarmingGlobal Warming
Global Warming
 
New Presentation
New PresentationNew Presentation
New Presentation
 

Mehr von Keith_Shotbolt

Meeting energy demand uk 2014
Meeting energy demand uk 2014Meeting energy demand uk 2014
Meeting energy demand uk 2014Keith_Shotbolt
 
Climate Change - Emissions and Benefits
Climate Change - Emissions and BenefitsClimate Change - Emissions and Benefits
Climate Change - Emissions and BenefitsKeith_Shotbolt
 
Carbon dioxide and the environment rev1
Carbon dioxide and the environment rev1Carbon dioxide and the environment rev1
Carbon dioxide and the environment rev1Keith_Shotbolt
 
Timeline for Evolution of Humans
Timeline for Evolution of HumansTimeline for Evolution of Humans
Timeline for Evolution of HumansKeith_Shotbolt
 
Science-based History of the World
Science-based History of the WorldScience-based History of the World
Science-based History of the WorldKeith_Shotbolt
 

Mehr von Keith_Shotbolt (6)

Meeting energy demand uk 2014
Meeting energy demand uk 2014Meeting energy demand uk 2014
Meeting energy demand uk 2014
 
Climate Change - Emissions and Benefits
Climate Change - Emissions and BenefitsClimate Change - Emissions and Benefits
Climate Change - Emissions and Benefits
 
Essential science r1
Essential science r1Essential science r1
Essential science r1
 
Carbon dioxide and the environment rev1
Carbon dioxide and the environment rev1Carbon dioxide and the environment rev1
Carbon dioxide and the environment rev1
 
Timeline for Evolution of Humans
Timeline for Evolution of HumansTimeline for Evolution of Humans
Timeline for Evolution of Humans
 
Science-based History of the World
Science-based History of the WorldScience-based History of the World
Science-based History of the World
 

Kürzlich hochgeladen

VIP Call Girls Service Chaitanyapuri Hyderabad Call +91-8250192130
VIP Call Girls Service Chaitanyapuri Hyderabad Call +91-8250192130VIP Call Girls Service Chaitanyapuri Hyderabad Call +91-8250192130
VIP Call Girls Service Chaitanyapuri Hyderabad Call +91-8250192130Suhani Kapoor
 
Booking open Available Pune Call Girls Parvati Darshan 6297143586 Call Hot I...
Booking open Available Pune Call Girls Parvati Darshan  6297143586 Call Hot I...Booking open Available Pune Call Girls Parvati Darshan  6297143586 Call Hot I...
Booking open Available Pune Call Girls Parvati Darshan 6297143586 Call Hot I...Call Girls in Nagpur High Profile
 
Proposed Amendments to Chapter 15, Article X: Wetland Conservation Areas
Proposed Amendments to Chapter 15, Article X: Wetland Conservation AreasProposed Amendments to Chapter 15, Article X: Wetland Conservation Areas
Proposed Amendments to Chapter 15, Article X: Wetland Conservation Areas💥Victoria K. Colangelo
 
Booking open Available Pune Call Girls Budhwar Peth 6297143586 Call Hot Indi...
Booking open Available Pune Call Girls Budhwar Peth  6297143586 Call Hot Indi...Booking open Available Pune Call Girls Budhwar Peth  6297143586 Call Hot Indi...
Booking open Available Pune Call Girls Budhwar Peth 6297143586 Call Hot Indi...Call Girls in Nagpur High Profile
 
webinaire-green-mirror-episode-2-Smart contracts and virtual purchase agreeme...
webinaire-green-mirror-episode-2-Smart contracts and virtual purchase agreeme...webinaire-green-mirror-episode-2-Smart contracts and virtual purchase agreeme...
webinaire-green-mirror-episode-2-Smart contracts and virtual purchase agreeme...Cluster TWEED
 
BOOK Call Girls in (Dwarka) CALL | 8377087607 Delhi Escorts Services
BOOK Call Girls in (Dwarka) CALL | 8377087607 Delhi Escorts ServicesBOOK Call Girls in (Dwarka) CALL | 8377087607 Delhi Escorts Services
BOOK Call Girls in (Dwarka) CALL | 8377087607 Delhi Escorts Servicesdollysharma2066
 
(ZARA) Call Girls Talegaon Dabhade ( 7001035870 ) HI-Fi Pune Escorts Service
(ZARA) Call Girls Talegaon Dabhade ( 7001035870 ) HI-Fi Pune Escorts Service(ZARA) Call Girls Talegaon Dabhade ( 7001035870 ) HI-Fi Pune Escorts Service
(ZARA) Call Girls Talegaon Dabhade ( 7001035870 ) HI-Fi Pune Escorts Serviceranjana rawat
 
(NANDITA) Hadapsar Call Girls Just Call 7001035870 [ Cash on Delivery ] Pune ...
(NANDITA) Hadapsar Call Girls Just Call 7001035870 [ Cash on Delivery ] Pune ...(NANDITA) Hadapsar Call Girls Just Call 7001035870 [ Cash on Delivery ] Pune ...
(NANDITA) Hadapsar Call Girls Just Call 7001035870 [ Cash on Delivery ] Pune ...ranjana rawat
 
DENR EPR Law Compliance Updates April 2024
DENR EPR Law Compliance Updates April 2024DENR EPR Law Compliance Updates April 2024
DENR EPR Law Compliance Updates April 2024itadmin50
 
Call Girls Budhwar Peth Call Me 7737669865 Budget Friendly No Advance Booking
Call Girls Budhwar Peth Call Me 7737669865 Budget Friendly No Advance BookingCall Girls Budhwar Peth Call Me 7737669865 Budget Friendly No Advance Booking
Call Girls Budhwar Peth Call Me 7737669865 Budget Friendly No Advance Bookingroncy bisnoi
 
(DIYA) Call Girls Sinhagad Road ( 7001035870 ) HI-Fi Pune Escorts Service
(DIYA) Call Girls Sinhagad Road ( 7001035870 ) HI-Fi Pune Escorts Service(DIYA) Call Girls Sinhagad Road ( 7001035870 ) HI-Fi Pune Escorts Service
(DIYA) Call Girls Sinhagad Road ( 7001035870 ) HI-Fi Pune Escorts Serviceranjana rawat
 
The Most Attractive Pune Call Girls Shirwal 8250192130 Will You Miss This Cha...
The Most Attractive Pune Call Girls Shirwal 8250192130 Will You Miss This Cha...The Most Attractive Pune Call Girls Shirwal 8250192130 Will You Miss This Cha...
The Most Attractive Pune Call Girls Shirwal 8250192130 Will You Miss This Cha...ranjana rawat
 
VIP Call Girls Mahadevpur Colony ( Hyderabad ) Phone 8250192130 | ₹5k To 25k ...
VIP Call Girls Mahadevpur Colony ( Hyderabad ) Phone 8250192130 | ₹5k To 25k ...VIP Call Girls Mahadevpur Colony ( Hyderabad ) Phone 8250192130 | ₹5k To 25k ...
VIP Call Girls Mahadevpur Colony ( Hyderabad ) Phone 8250192130 | ₹5k To 25k ...Suhani Kapoor
 
VIP Call Girl Gorakhpur Aashi 8250192130 Independent Escort Service Gorakhpur
VIP Call Girl Gorakhpur Aashi 8250192130 Independent Escort Service GorakhpurVIP Call Girl Gorakhpur Aashi 8250192130 Independent Escort Service Gorakhpur
VIP Call Girl Gorakhpur Aashi 8250192130 Independent Escort Service GorakhpurSuhani Kapoor
 
Mumbai Call Girls, 💞 Prity 9892124323, Navi Mumbai Call girls
Mumbai Call Girls, 💞  Prity 9892124323, Navi Mumbai Call girlsMumbai Call Girls, 💞  Prity 9892124323, Navi Mumbai Call girls
Mumbai Call Girls, 💞 Prity 9892124323, Navi Mumbai Call girlsPooja Nehwal
 

Kürzlich hochgeladen (20)

VIP Call Girls Service Chaitanyapuri Hyderabad Call +91-8250192130
VIP Call Girls Service Chaitanyapuri Hyderabad Call +91-8250192130VIP Call Girls Service Chaitanyapuri Hyderabad Call +91-8250192130
VIP Call Girls Service Chaitanyapuri Hyderabad Call +91-8250192130
 
Booking open Available Pune Call Girls Parvati Darshan 6297143586 Call Hot I...
Booking open Available Pune Call Girls Parvati Darshan  6297143586 Call Hot I...Booking open Available Pune Call Girls Parvati Darshan  6297143586 Call Hot I...
Booking open Available Pune Call Girls Parvati Darshan 6297143586 Call Hot I...
 
Green Banking
Green Banking Green Banking
Green Banking
 
Proposed Amendments to Chapter 15, Article X: Wetland Conservation Areas
Proposed Amendments to Chapter 15, Article X: Wetland Conservation AreasProposed Amendments to Chapter 15, Article X: Wetland Conservation Areas
Proposed Amendments to Chapter 15, Article X: Wetland Conservation Areas
 
E Waste Management
E Waste ManagementE Waste Management
E Waste Management
 
Call Girls In Dhaula Kuan꧁❤ 🔝 9953056974🔝❤꧂ Escort ServiCe
Call Girls In Dhaula Kuan꧁❤ 🔝 9953056974🔝❤꧂ Escort ServiCeCall Girls In Dhaula Kuan꧁❤ 🔝 9953056974🔝❤꧂ Escort ServiCe
Call Girls In Dhaula Kuan꧁❤ 🔝 9953056974🔝❤꧂ Escort ServiCe
 
Booking open Available Pune Call Girls Budhwar Peth 6297143586 Call Hot Indi...
Booking open Available Pune Call Girls Budhwar Peth  6297143586 Call Hot Indi...Booking open Available Pune Call Girls Budhwar Peth  6297143586 Call Hot Indi...
Booking open Available Pune Call Girls Budhwar Peth 6297143586 Call Hot Indi...
 
webinaire-green-mirror-episode-2-Smart contracts and virtual purchase agreeme...
webinaire-green-mirror-episode-2-Smart contracts and virtual purchase agreeme...webinaire-green-mirror-episode-2-Smart contracts and virtual purchase agreeme...
webinaire-green-mirror-episode-2-Smart contracts and virtual purchase agreeme...
 
BOOK Call Girls in (Dwarka) CALL | 8377087607 Delhi Escorts Services
BOOK Call Girls in (Dwarka) CALL | 8377087607 Delhi Escorts ServicesBOOK Call Girls in (Dwarka) CALL | 8377087607 Delhi Escorts Services
BOOK Call Girls in (Dwarka) CALL | 8377087607 Delhi Escorts Services
 
(ZARA) Call Girls Talegaon Dabhade ( 7001035870 ) HI-Fi Pune Escorts Service
(ZARA) Call Girls Talegaon Dabhade ( 7001035870 ) HI-Fi Pune Escorts Service(ZARA) Call Girls Talegaon Dabhade ( 7001035870 ) HI-Fi Pune Escorts Service
(ZARA) Call Girls Talegaon Dabhade ( 7001035870 ) HI-Fi Pune Escorts Service
 
(NANDITA) Hadapsar Call Girls Just Call 7001035870 [ Cash on Delivery ] Pune ...
(NANDITA) Hadapsar Call Girls Just Call 7001035870 [ Cash on Delivery ] Pune ...(NANDITA) Hadapsar Call Girls Just Call 7001035870 [ Cash on Delivery ] Pune ...
(NANDITA) Hadapsar Call Girls Just Call 7001035870 [ Cash on Delivery ] Pune ...
 
DENR EPR Law Compliance Updates April 2024
DENR EPR Law Compliance Updates April 2024DENR EPR Law Compliance Updates April 2024
DENR EPR Law Compliance Updates April 2024
 
Call Girls Budhwar Peth Call Me 7737669865 Budget Friendly No Advance Booking
Call Girls Budhwar Peth Call Me 7737669865 Budget Friendly No Advance BookingCall Girls Budhwar Peth Call Me 7737669865 Budget Friendly No Advance Booking
Call Girls Budhwar Peth Call Me 7737669865 Budget Friendly No Advance Booking
 
(DIYA) Call Girls Sinhagad Road ( 7001035870 ) HI-Fi Pune Escorts Service
(DIYA) Call Girls Sinhagad Road ( 7001035870 ) HI-Fi Pune Escorts Service(DIYA) Call Girls Sinhagad Road ( 7001035870 ) HI-Fi Pune Escorts Service
(DIYA) Call Girls Sinhagad Road ( 7001035870 ) HI-Fi Pune Escorts Service
 
The Most Attractive Pune Call Girls Shirwal 8250192130 Will You Miss This Cha...
The Most Attractive Pune Call Girls Shirwal 8250192130 Will You Miss This Cha...The Most Attractive Pune Call Girls Shirwal 8250192130 Will You Miss This Cha...
The Most Attractive Pune Call Girls Shirwal 8250192130 Will You Miss This Cha...
 
9953056974 ,Low Rate Call Girls In Adarsh Nagar Delhi 24hrs Available
9953056974 ,Low Rate Call Girls In Adarsh Nagar  Delhi 24hrs Available9953056974 ,Low Rate Call Girls In Adarsh Nagar  Delhi 24hrs Available
9953056974 ,Low Rate Call Girls In Adarsh Nagar Delhi 24hrs Available
 
Call Girls In Pratap Nagar꧁❤ 🔝 9953056974🔝❤꧂ Escort ServiCe
Call Girls In Pratap Nagar꧁❤ 🔝 9953056974🔝❤꧂ Escort ServiCeCall Girls In Pratap Nagar꧁❤ 🔝 9953056974🔝❤꧂ Escort ServiCe
Call Girls In Pratap Nagar꧁❤ 🔝 9953056974🔝❤꧂ Escort ServiCe
 
VIP Call Girls Mahadevpur Colony ( Hyderabad ) Phone 8250192130 | ₹5k To 25k ...
VIP Call Girls Mahadevpur Colony ( Hyderabad ) Phone 8250192130 | ₹5k To 25k ...VIP Call Girls Mahadevpur Colony ( Hyderabad ) Phone 8250192130 | ₹5k To 25k ...
VIP Call Girls Mahadevpur Colony ( Hyderabad ) Phone 8250192130 | ₹5k To 25k ...
 
VIP Call Girl Gorakhpur Aashi 8250192130 Independent Escort Service Gorakhpur
VIP Call Girl Gorakhpur Aashi 8250192130 Independent Escort Service GorakhpurVIP Call Girl Gorakhpur Aashi 8250192130 Independent Escort Service Gorakhpur
VIP Call Girl Gorakhpur Aashi 8250192130 Independent Escort Service Gorakhpur
 
Mumbai Call Girls, 💞 Prity 9892124323, Navi Mumbai Call girls
Mumbai Call Girls, 💞  Prity 9892124323, Navi Mumbai Call girlsMumbai Call Girls, 💞  Prity 9892124323, Navi Mumbai Call girls
Mumbai Call Girls, 💞 Prity 9892124323, Navi Mumbai Call girls
 

The Science of Climate Change r1.pdf

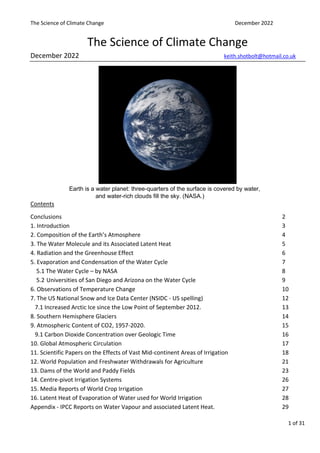
  • 1. The Science of Climate Change December 2022 1 of 31 The Science of Climate Change December 2022 keith.shotbolt@hotmail.co.uk Earth is a water planet: three-quarters of the surface is covered by water, and water-rich clouds fill the sky. (NASA.) Contents Conclusions 2 1. Introduction 3 2. Composition of the Earth’s Atmosphere 4 3. The Water Molecule and its Associated Latent Heat 5 4. Radiation and the Greenhouse Effect 6 5. Evaporation and Condensation of the Water Cycle 7 5.1 The Water Cycle – by NASA 8 5.2 Universities of San Diego and Arizona on the Water Cycle 9 6. Observations of Temperature Change 10 7. The US National Snow and Ice Data Center (NSIDC - US spelling) 12 7.1 Increased Arctic Ice since the Low Point of September 2012. 13 8. Southern Hemisphere Glaciers 14 9. Atmospheric Content of CO2, 1957-2020. 15 9.1 Carbon Dioxide Concentration over Geologic Time 16 10. Global Atmospheric Circulation 17 11. Scientific Papers on the Effects of Vast Mid-continent Areas of Irrigation 18 12. World Population and Freshwater Withdrawals for Agriculture 21 13. Dams of the World and Paddy Fields 23 14. Centre-pivot Irrigation Systems 26 15. Media Reports of World Crop Irrigation 27 16. Latent Heat of Evaporation of Water used for World Irrigation 28 Appendix - IPCC Reports on Water Vapour and associated Latent Heat. 29
  • 2. The Science of Climate Change December 2022 2 of 31 Conclusions (based on details contained in the Study Report attached below). 1. Records in Hawaii and at the South Pole show that the atmospheric concentration of carbon dioxide (CO2) has increased worldwide from 0.031% to 0.042% over the last 60 years. According to satellite observations by NASA and ESA: (a) There has been no significant change in Antarctic Sea ice extent over the last 50 years, (b) From a low point of 3.6 x 10⁶ km2 in September 2012, Arctic Sea ice extent has increased to 4.9 x 10⁶ km2 (+36%) in the last two Septembers while CO2 concentration has increased by 5.6%. (c) Records show that Southern Hemisphere glaciers increased in length in Chile (1950 to 2016) and New Zealand (1983 to 2008). World temperature change records by IPCC (2007), NASA (2017) and NOAA (2021) show increases of 1.5 degrees C in high Northern latitudes, and slight decreases below latitude 45 degrees South. Little or no climate change can be attributed to increased atmospheric CO2, but the evidence points to increased atmospheric water vapour arising from increased crop irrigation. 2. The Main Sections of all six Reports by the Intergovernmental Panel on Climate Change, (IPCC, dated 1990, 95, 2001, 07, 13 & 21) state that “water vapour is the most important and strongest greenhouse gas”- reducing the thermal infrared (long-wave) flux leaving the atmosphere-surface system. 3. IPCC Report AR4 2007, Chapter 1, Historical Overview of Climate Change Science, page 5, states that "Energy (solar) is required to evaporate water from the sea or land surface, and this energy, called LATENT HEAT, is released when water vapour condenses in clouds.” 4. In 2010, the UN Food and Agriculture Organisation (FAO) noted that humans withdrew 2,750 billion tonnes of freshwater for Agriculture (90% applied in the Northern Hemisphere) and 300 billion tonnes of freshwater evaporated to atmosphere from Dam Reservoirs. World human population increased from 2.3 billion in 1940 to 7 billion in 2010. Freshwater withdrawn for agriculture (irrigation) increased by 205% and evaporation from reservoirs increased by 500%. The increases were needed to provide food and water for the ever-increasing population (now 8 billion). 5. Every year, at least 2,700 billion tonnes of water vapour enter the atmosphere by evapotranspiration from irrigated farms and vineyards. The phase change (liquid to gas) absorbs radiant heat energy from the sun as LATENT HEAT- equivalent to more than 10 times the amount of energy used by humans for all other activities. This heat is released when the vapour condenses. 6. The Appendix here contains extracts from IPCC Reports 1990, 1995 and 2001 giving details of the release of latent heat (quote) “as water vapour condenses in the warm, poleward moving, ascending air” and “increasing precipitation in the mid- and high latitudes of the Northern Hemisphere.” 7. There is no doubt that the increased atmospheric content of water vapour from crop irrigation has caused both: a) an increased greenhouse effect (radiative forcing effect) when uncondensed - thus reducing summer night-time cooling and increasing the possibility of heat waves and forest fires, and b) an increased upward or poleward transfer of latent heat that is released when it condenses - thus increasing storms & floods, or melting polar ice, glaciers & permafrost.
  • 3. The Science of Climate Change December 2022 3 of 31 The Science of Climate Change December 2022 keith.shotbolt@hotmail.co.uk 1. Introduction Heat energy is transferred from a hot object to a cooler object. The 3 methods of heat transfer are Conduction, Convection and Radiation. Photo by NASA showing Earth’s surface dominated by water and clouds (condensed water vapour). Heat arriving from the Sun by radiation at a given latitude varies during the year, largely due to the rotational axis of the Earth being tilted 23.5 degrees to the plane of its orbit. Total radiant energy arriving from the Sun has been estimated at 3,400,000 exajoules per year by Paul Breeze, in Power Generation Technologies [Third Edition], 2019, and 120,000 terawatts or 3,780,000 exajoules, by Eric J. Chaisson in his 2008 paper entitled ‘Long Term Global Heating from Energy Usage’. According to bp’s Statistical Review of World Energy, the total energy used by humans for all their activities in 2019 was 583.9 exajoules (just 0.017% of the energy arriving from the Sun). The above- mentioned 2008 paper concludes that this quantity has a negligible effect on Earth’s climate. Changes that could cause variation to climate are: (i) an increase in the atmospheric gases that absorb and re-emit long wave radiation. The result of reducing long wave radiation back into space is called ‘The Greenhouse Effect’, and (ii) an increase in the evaporation and condensation processes of ‘The Water Cycle’, in which global atmospheric circulation transports water vapour and associated latent heat towards the poles.
  • 4. The Science of Climate Change December 2022 4 of 31 2. Composition of Earth’s Atmosphere https://en.wikipedia.org/wiki/Atmosphere_of_Earth https://legacy.climate.ncsu.edu/edu/Composition Quote: The atmosphere is composed of a mix of several different gases in differing amounts. The permanent gases whose percentages do not change from day to day are nitrogen, oxygen and argon. Nitrogen accounts for 78% of the atmosphere, oxygen 21% and argon 0.9%. Gases like carbon dioxide, nitrous oxides, methane, and ozone are trace gases that account for about a tenth of one percent (0.1%) of the atmosphere. Water vapor (US spelling) is unique in that its concentration varies from 0 to 4% of the atmosphere depending on where you are and what time of the day it is. In the cold, dry artic regions water vapor usually accounts for less than 1% of the atmosphere, while in humid, tropical regions water vapor can account for almost 4% of the atmosphere (nearly 100 times the concentration of CO2). Water vapor is very important in predicting weather. 2.1 Atmospheric Transport (Winds) https://www.encyclopedia.com/earth-and-environment/atmosphere-and-weather/weather-and-climate-terms- and-concepts/advection-earth-sciences Advection Quote: Advection is a lateral or horizontal transfer of mass, heat, or other property. Winds that blow across Earth's surface represent advectional movements of air. Convection tends to describe more vertical movements. Differential pressures and temperatures drive the mass movement of air seeking equilibrium (the lowest energy state). Advective winds move from areas of higher temperature toward areas of lower temperature and can cover many thousands of kilometres.
  • 5. The Science of Climate Change December 2022 5 of 31 3. The Water Vapour Molecule and its Associated Latent Heat https://www.briangwilliams.us/weather-change/latent-heat-and-adiabatic-cooling-and-warming.html Quote: Water absorbs heat when it evaporates. This heat supplies the energy needed to break the hydrogen bonds that hold molecules together as a liquid. Because it is used to break the hydrogen bonds between individual molecules, this heat does not raise the temperature of the liquid water. It is known as latent heat, because it appears to be hidden. Heat energy that is absorbed when water evaporates is released when the hydrogen bonds form once again and the water vapor condenses into liquid. Water vapor condenses when the air containing it becomes saturated. (Unquote) The diagram above shows the arrangements of water molecules in the three phases of solid, liquid and gas. In the liquid phase at the centre, the molecules are aligned by the hydrogen bonds between the positive charges on the hydrogen atoms and the negative charges on the oxygen atoms. When heat is added to the liquid phase, a certain quantity (called the latent heat of vaporisation) is needed to break the hydrogen bonds to form the gas phase with separated molecules. Heat added to cause ice to change to liquid water is called the latent heat of fusion. Radiation from the sun causes evaporation of water from the oceans. It also causes evaporation of water from lakes, reservoirs, rivers and wet lands. Plants transpire under the radiant heat from the sun. 99% of the water absorbed by plant roots is transpired to atmosphere. The combined transition to vapour from wet land containing plants is called evapotranspiration – see Section 16. The release of latent heat when water vapour condenses is responsible for (i) thunderstorms and tropical cyclones in the intertropical zone, and (ii) the transfer of heat energy towards the poles by the Ferrel Cells of global atmospheric circulation – see Section 10. If there was no transfer of latent heat by water vapour, the equator would be much hotter and the poles much colder than they are. The latent heat property of water makes the world inhabitable.
  • 6. The Science of Climate Change December 2022 6 of 31 4. Radiation and the ‘Greenhouse Effect’. In 1988, Dr James Hansen of NASA Goddard Institute for Space Studies (GISS) told a US Congressional Committee that ‘it was 99 percent certain that the warming trend (of climate) was not a natural variation, but was caused by a build-up of CO2 and other artificial gases in the atmosphere.’ IPCC Report AR1 1990 The diagram below of the ‘Greenhouse Effect’ is from the Intergovernmental Panel on Climate Change (IPCC) Report, Policymakers Summary, page 22 of 414. IPCC AR1 1990 Chapter 1. Greenhouse Gases and Aerosols. Page 7 (or 55 of 414) quote: Tropospheric Water Vapour is the single most important greenhouse gas… Author’s Note: According to 1990 data from the UN Food & Agriculture Organisation (FAO), around 2,500 billion tonnes of freshwater were distributed over crops sown in semi-arid and desert land during Spring and Summer. The atmospheric content of water vapour over irrigated fields is greatly increased by evapotranspiration – explained fully in Section 16 below. IPCC AR2 1995 Chapter 3. Observed Climate Variability and Change 161 (page 175 of 588) 3.3.7. Water vapour is the most abundant greenhouse gas and makes the largest contribution to the natural greenhouse effect. IPCC AR3 2001 Chapter 1: The Climate System: An Overview 88 (page 99 of 893) The most variable component of the atmosphere is water in its various phases such as vapour, cloud droplets, and ice crystals. Water vapour is the strongest greenhouse gas. For these reasons, and because the transition between the various phases absorbs and releases much (latent heat) energy, water vapour is central to the climate and its variability and change. 2010 Following more computer-modelling of climate effects, NASA GISS staff published the above paper, which reduced their emphasis on the role of CO2, and concluded, quote: “water vapour is the dominant contributor (~50% of the effect), followed by clouds (~25%) and CO2 (20%).” IPCC Report 2013 FAQ 8.1 states: “The contribution of water vapour to the natural greenhouse effect relative to that of carbon dioxide (CO2) depends on the accounting method, but can be considered to be approximately two to three times greater.”
  • 7. The Science of Climate Change December 2022 7 of 31 5. Evaporation and Condensation of the ‘Water Cycle’. Water vapour evaporating from the sea, lake, or wet/irrigated land contains latent heat energy due to the phase change from liquid to gaseous phase. The vapour is unseen until it reaches cooler atmospheric conditions, where it condenses to form clouds and rain or snow. In the left-side diagram, winds move water vapour laterally from over sea to cooler conditions on land, especially over hills and mountains. The lateral movement can extend to more than 1000 km, depending on the wind speed. This is a relatively gentle process that can happen all-year-round in temperate climates like the UK. On condensation, the latent heat is gradually released to the surrounding air. In the right-side diagram, there is more vertical movement of the humid air, and cumulus clouds can build-up over the sea or over wet/irrigated land to a height of 3km to 6km. Updraughts due to the warm humid air rising higher eventually reach much cooler air at 6km to 12km height, and down-draughts are formed after condensation and release of latent heat energy. The up and down air movements generate electrical charge in the clouds, which then discharges as lightning. The rapid expansion and contraction of the air from the heat of the lightning flash generates thunder. In the tropics, thunderstorms are common all-year-round, but occur mainly during the summer in temperate regions. Hurricanes and typhoons can form only when the ocean or sea temperature is more than 27oC. At this temperature, sufficient water vapour rises into the atmosphere with associated latent heat that on condensation releases the energy required to sustain the swirling motion. The swirling of the cyclone is generated by the Coriolis effect near the tropics, where the Earth’s rotational speed is greatest. Tropical cyclones have been noted to sustain over wet land. Wikipedia describes this ‘Brown Ocean effect’ in detail, and states: “A 2013 NASA Study found that, from 1979-2008, 45 of 227 tropical storms either gained or maintained strength after making landfall. The press release stated, "The land essentially mimics the moisture-rich environment of the ocean, where the storm originated.” Crop irrigation can create wet land conditions that are sufficient to sustain tropical cyclones, but are more likely to develop other severe weather systems, such as thunderstorms and tornadoes.
  • 8. The Science of Climate Change December 2022 8 of 31 https://earthobservatory.nasa.gov/features/Water 5.1 The Water Cycle - by NASA By Steve Graham, Claire Parkinson, and Mous Chahine Design by Robert Simmon October 1, 2010 Viewed from space, one of the most striking features of our home planet is the water, in both liquid and frozen forms, that covers approximately 75% of the Earth’s surface. Geologic evidence suggests that large amounts of water have likely flowed on Earth for the past 3.8 billion years—most of its existence. Believed to have initially arrived on the surface through the emissions of ancient volcanoes, water is a vital substance that sets the Earth apart from the rest of the planets in our solar system. In particular, water appears to be a necessary ingredient for the development and nourishment of life. Note that Earth is a water planet: three-quarters of the surface is covered by water, and water-rich clouds fill the sky. Water, Water, Everywhere Water is practically everywhere on Earth. Moreover, it is the only known substance that can naturally exist as a gas, a liquid, and solid within the relatively small range of air temperatures and pressures found at the Earth’s surface. Despite its small amount relative to the oceans, water vapor (US spelling) has a huge influence on the planet. Water vapor is a powerful greenhouse gas, and it is a major driver of the Earth’s weather and climate as it travels around the globe, transporting latent heat with it. Latent heat is heat obtained by water molecules as they transition from liquid or solid to vapor; the heat is released when the molecules condense from vapor back to liquid or solid form, creating cloud droplets and various forms of precipitation. For human needs, the amount of freshwater on Earth—for drinking and agriculture—is particularly important. Freshwater exists in lakes, rivers, reservoirs, groundwater, and frozen as snow and ice. A Multi-Phased Journey The water, or hydrologic, cycle describes the pilgrimage of water as water molecules make their way from the Earth’s surface to the atmosphere and back again, in some cases to below the surface. This gigantic system, powered by energy from the Sun, is a continuous exchange of moisture between the oceans, the atmosphere, and the land. While evaporation from the oceans is the primary vehicle for driving the surface-to-atmosphere portion of the hydrologic cycle, plant transpiration on land is also significant. For example, a cornfield 1 acre in size can transpire as much as 4,000 gallons of water every day. After the water vapor enters the lower atmosphere, air currents may carry it laterally for thousands of kilometres, or sometimes high into the atmosphere, in both cases to where the air is cooler. In the cool air, water vapor condenses from a gas to a liquid to form cloud droplets and to release its latent heat. Cloud droplets can grow and produce precipitation - including rain, snow, sleet, freezing rain, and hail. Added Note to Aid Understanding: The processes of evaporation and condensation, with associated absorption and release of latent heat, are the Basic Physics of refrigerators and freezers, air-conditioners, and (in reverse) heat pumps.
  • 9. The Science of Climate Change December 2022 9 of 31 5.2 Universities of San Diego (ucsd.edu) and Arizona on the Water Cycle http://earthguide.ucsd.edu/virtualmuseum/climatechange1/09_1.shtml Water and Heat Storage When water evaporates, the heat expended in the phase change of water to vapor is not lost, but is contained in the vapor in latent form. When the vapor condenses, the latent heat is freed for warming the surrounding air. The phase changes of water combined with its unique heat-related properties are intimately involved in all aspects of climate and weather. Water transfers and stores heat on an immense scale, and thereby evens out the temperature differences between day and night, summer and winter, tropics and polar areas. http://www.atmo.arizona.edu/students/courselinks/fall14/atmo336/lectures/sec1/water.html Water Cycle (also called Hydrologic or Hydrological Cycle) The water cycle refers the continuous movement of water on, above, and below the surface of the Earth. Water can change phase among liquid, gas (water vapor), and solid (ice) at various places in the cycle. Energy from the sun drives the water cycle. Liquid water on or slightly below the Earth's surface evaporates into the air, becoming the gas water vapor. The vapor in gaseous form is invisible, and remains in that phase until it either reaches a cooler area by (a) moving laterally by wind, usually poleward, or (b) higher in the atmosphere. When water vapor condenses, large amounts of heat - called latent heat - are released into the atmosphere. Latent heat is an important source of energy in the melting of ice and permafrost, and the development of thunderstorms and hurricanes.
  • 10. The Science of Climate Change December 2022 10 of 31 6. Observations of Temperature Change. World Temperature Changes Noted by IPCC 2007 and NASA 2017 IPCC Report AR4 WGII: Climate Change 2007 – Impacts, Adaptation and Vulnerability. Map from page 10 (21 of 987) - Summary for Policymakers. ** Figure SPM.1. Locations of changes in surface air temperature over the period 1970-2004, showing mainly Northern Hemisphere warming, with no overall change in the Antarctic area. NASA’s similar map used data from 6,300 land and marine-based stations. It shows Earth’s average global temperature from 2013-17, as compared to a baseline average from 1951 to 1980. Extracted from: https://www.nasa.gov/press-release/long-term-warming-trend-continued-in-2017-nasa-noaa The temperature changes noted in the IPCC 2007 map were confirmed by NASA in 2017. • Northern areas have experienced warming of more than 2 degrees F (~1.1 deg. C). • Large areas below 50 degrees South have cooled by 0.5 to 1 degree F. There were no observations of overall global warming.
  • 11. The Science of Climate Change December 2022 11 of 31 More Recent World Temperature Trends, 1990-2020 https://www.climate.gov/news-features/understanding-climate/climate-change-global-temperature Increasing temperatures were observed over higher northern latitudes. Temperatures have reduced in areas south of 45oS – very similar to the results noted by the IPCC in 2007 and NASA in 2017.
  • 12. The Science of Climate Change December 2022 12 of 31 7. The US National Snow and Ice Data Centre (NSIDC) publishes results from satellite observations by NASA of Arctic and Antarctic Sea Ice Extent. NASA issued a summary of Antarctic Sea Ice Extent on 16th September 2016: see https://earthobservatory.nasa.gov/features/SeaIce Quote: “Since 1979, the total annual Antarctic Sea Ice Extent has increased about 1 percent per decade. For three consecutive Septembers (2012 to 2014), satellites observed new record highs for winter sea ice extent around Antarctica. The largest of those occurred in September 2014, when the ice reached 20.14 million square kilometres (7.78 million square miles). You might wonder how Antarctic Sea ice could be increasing while global warming(?) is raising the planet’s average surface temperature. It’s a question that scientists are asking, too.” Over the last 42 years, minimum Arctic Sea Ice (top graph) has reduced from 7.5 million km2 to less than 4 million km2. There has been no significant change in Antarctic Sea Ice Extent (lower graph), even though atmospheric concentration of CO2 increased from 335 ppm to 412 ppm. Increasing atmospheric CO2 content is not affecting the Antarctic area.
  • 13. The Science of Climate Change December 2022 13 of 31 7.1 Increased Arctic Ice since the Low Point of September 2012. Areas of Arctic Sea Ice noted by the US NSIDC in Septembers of 2012, 2021 and 2022. Maps extracted from https://www.climate4you.com/ Website section entitled: Sea Ice Extension in a longer time perspective Arctic Sea Ice Extent is a minimum during September each year. The all-time minimum extent of 3.6 million km2 was observed by NSIDC over September 2012. The September 2021 extent increased to 4.9 million km2. The September extent of 4.9 million km2 was repeated in 2022. Arctic Sea Ice Extent has increased by 36%, while atmospheric CO2 content increased by 5.6%. The increase is very likely due to distribution of less irrigation water over lower latitude farms.
  • 14. The Science of Climate Change December 2022 14 of 31 8. Southern Hemisphere Glaciers Patagonia Pio XI glacier at latitude 49 deg 8 min South. Perito Moreno glacier at latitude 50 deg 28 min South. The European Space Agency (ESA) has presented evidence showing that the Pio XI Glacier in southern Chile has been advancing over the last 60 years. The Perito Moreno Glacier located in southern Argentina has been advancing and is now stable. These observations add evidence that climate temperatures are not increasing in the Southern Hemisphere. New Zealand Observations carried out by scientists from Victoria University of Wellington and the National Institute of Water and Atmospheric Research (NIWA), were reported in the scientific journal Nature Communications. https://www.wgtn.ac.nz/news/2017/02/explaining-new-zealands-unusual-growing-glaciers Quote: “At least 58 New Zealand glaciers advanced between 1983 and 2008, with Franz Josef Glacier at 43 degrees South (Kā Roimata o Hine Hukatere) advancing nearly continuously during this time……lower temperature caused the glaciers to advance, rather than increased precipitation as previously thought.”
  • 15. The Science of Climate Change December 2022 15 of 31 9. Atmospheric content of CO2 in Hawaii and at the South Pole, 1957-2020. Source: https://scrippsco2.ucsd.edu/graphics_gallery/mauna_loa_and_south_pole/mauna_loa_and_south_pole.html The records kept by the Scripps Institution of Oceanography in San Diego show that the atmospheric content of CO2 at the South Pole, and at Mauna Loa in Hawaii (at latitude 20 degrees North), are similar. CO2 concentration has increased worldwide from 315ppm in 1960 to 420ppm (0.042%, or ~4 parts in 10,000) in 2022, but there has been no reduction in Antarctic Sea ice or Southern Hemisphere glaciers. It is therefore very unlikely that the reduction of Arctic Sea Ice is caused by increased atmospheric CO2.
  • 16. The Science of Climate Change December 2022 16 of 31 9.1 Carbon Dioxide Concentration over Geologic Time https://www.geocraft.com/WVFossils/Carboniferous_climate.html There has historically been much more CO2 in our atmosphere than exists today. For example, during the Jurassic Period (200 million years ago), average CO2 concentrations were about 1800 ppm or about 4.7 times higher than today. Environmental Impact The first fish evolved over 500 million years ago, and ammonites, the largest shellfish fossils, first appeared 420 million years ago. Both species were not harmed by CO2 concentrations > 3000 ppm. CO2 is a basic requirement for photosynthesis, and is therefore food for phytoplankton and all plants. Horticulturalists raise the CO2 concentration to 1000 ppm in greenhouses to improve crop yield. The UK Health and Safety Executive allows concentration up to 5000 ppm for 8-hours in a work environment, Coral Reefs https://www.theguardian.com/environment/2021/feb/18/great-barrier-reef-found-to-be-in-failing- health-amid-calls-for-urgent-action The Guardian, February 2021: Rather than ocean warming or acidification, the Queensland government says dissolved inorganic nitrogen - originating from farm fertilisers - is linked to algal blooms, outbreaks of coral-eating starfish and coral disease at the Great Barrier Reef. Dr Lissa Schindler, Great Barrier Reef campaigner at the Australian Marine Conservation Society, said: “Improving water quality needs the support and dedication of all farmers and graziers in Queensland and they’ll need backing from the Queensland government to adopt the best practices required,” Schindler said. “That’s why we are calling for more funding to help the agricultural sector comply quickly with the regulations.”
  • 17. The Science of Climate Change December 2022 17 of 31 10. Global Atmospheric Circulation. UK MetOffice quote: “The big temperature difference between the poles and equator causes global circulation, which provides a natural air conditioning system to stop the equator becoming hotter, and poles becoming colder.” Notes have been added on regions of evapotranspiration and condensation. Global Atmospheric Circulation contains warm, dry, high-pressure zones close to latitudes 30o North and South, creating arid and desert regions due to lack of rain. These regions can be considered as extending from 15o to 45o latitudes due to the tilt of the Earth’s axis. Crop irrigation in the Northern Hemisphere at these latitudes produces water vapour that is carried north-east by prevailing South Westerly winds in the Ferrel Cell, which extends from 30oN to 60oN. Reports have described irrigation in the western USA causing increased rainfall 1000+ km downwind to the northeast. Irrigation over farms and vineyards in Spain is likely to increase rainfall over Germany. Winds in the Hadley Cells ensure that most water vapour here is driven towards the Equator to sustain jungle vegetation. The UK has a mild, wet climate due to prevailing South Westerlies from the Atlantic. Increasing crop irrigation in the Southern Hemisphere very likely explains recent observations of increased summer rainfall in Australia, and summer warming plus reduced sea ice around Antarctica.
  • 18. The Science of Climate Change December 2022 18 of 31 11. Scientific Papers on the Effects of Vast Mid-Continent Areas of Irrigation The major areas of the world subject to agricultural irrigation are located in North America and Asia. Irrigating normally dry regions increases local atmospheric concentration of water vapour. 1992 The hydrological cycle and its influence on climate Article by Moustafa T. Chahine, at the NASA Jet Propulsion Laboratory, California. Quote: “In the short span of about 10 years, the hydrological cycle has emerged as the centrepiece of the study of climate, but basic changes are still required in this field. Hydrological science must adjust itself to become a discipline not unlike atmospheric science or oceanography. Rather than fragmented studies in engineering, geography, meteorology and agricultural science, we need an integrated program of fundamental research and education in hydrological science.” 2005 Human modification of global water vapor flows from the land surface Quote: “It is well known that irrigation is, by far, the largest water user in terms of liquid water withdrawal from rivers and aquifers, and that human modification of the hydrological cycle has profoundly affected the flow of liquid water across the Earth’s land surface.” “Fig.3 Additional local water vapor flows due to irrigation (mmyr), defined as the change in vapor flows when irrigation is added to actual vegetation. The total increase in vapor flows amounts to 2,600 km3/year (2,600 billion tonnes/year).” World population in 2005 was 6.5 billion – now (2022) it is 8 billion.
  • 19. The Science of Climate Change December 2022 19 of 31 2010 Quote: “4. Summary and Conclusion Irrigation over the Ogallala Aquifer of the central United States increased dramatically over the 20th century. A long‐term record of station and gridded precipitation observations covering the entire 20th century shows that July precipitation increased 15–30% in a broad region downwind of the Ogallala Aquifer, stretching from eastern Kansas through Indiana.” 2012 Quote: “Increased water vapour was prominent over the Canadian Arctic Archipelago, especially in the summer months; the strong summer trends in this region are also seen in the radiosonde data. A feature common to all of the reanalyses is a region of increases in precipitable water centred over the Beaufort and Chuckchi Seas in August and September, corresponding to where reductions in end-of-summer summer sea ice extent have been most pronounced.” Multiple crop circles created by centre-pivot irrigation systems near Lethbridge, Canada. Water vapour emissions, with associated latent heat, are transported poleward by global atmospheric circulation.
  • 20. The Science of Climate Change December 2022 20 of 31 2013 Quote: “The Aral Sea is a saline lake, located in the middle of Central Asia. This brackish water body was the world’s fourth largest lake before it started to shrink in the 1960’s due to water withdrawal for land irrigation. 85 % of the water flow has been diverted for agriculture.” Deserted ships lying on the old bed of the Aral Sea. Evaporation of the water used for irrigation of farms in Uzbekistan and other surrounding areas has been carried poleward by global atmospheric circulation. On reaching cooler conditions the vapour condenses, producing rain, releasing its latent heat and melting permafrost and Arctic Ice. 2015 Abstract Increasing daily precipitation intensity is strongly associated with increasing water vapor in the atmosphere over northern Eurasia based on this study of 35 years of daily precipitation, specific humidity, and air temperature observations at 152 stations. Results suggest that increased atmospheric water vapor is the direct link to more frequent intense events of precipitation and increased risk of flooding under a warming climate via increasing precipitation intensity.
  • 21. The Science of Climate Change December 2022 21 of 31 12. World Population and Freshwater Withdrawals for Agriculture In 1960, world human population was 3 billion. The present, 2022 population is 8 billion. Around 90% of people live in the Northern Hemisphere. Increase of freshwater withdrawal graph is extracted from 2018 film ‘The World’s Water Crisis, Explained’. The graph, by the United Nations Food and Agriculture Organisation, shows 4,250 km3 withdrawn in 2010 from rivers, lakes and underground aquifers. The UN FAO advised that 70% of it (2,975 km3) was used for crop irrigation. Note that 1 km3 of water weighs 1 billion tonnes. and that water withdrawn from underground aquifers adds to the rise in sea level, following evapotranspiration, condensation and runoff.
  • 22. The Science of Climate Change December 2022 22 of 31 Additional Sources of Water Withdrawal Data. The chart above, from a 2020 paper by the World Resources Institute, shows 3,200 km3 used for irrigation over the years 2000 to 2014. The United Nations Food and Agriculture Organisation (FAO) noted the vast increase in freshwater withdrawals over the years 1900 - 2010. https://www.fao.org/aquastat/en/overview/methodology/water-use Quote by UN FAO: ‘The chart below shows global water withdrawal over time, including (in addition to the water withdrawal for Agriculture, Industries & Municipalities) the evaporation from Reservoirs, which are artificial lakes created when a dam is built. 300 billion tonnes of water evaporated from their surface areas in 2010. While this is not a water withdrawal per se, it should be considered as an anthropogenic consumptive water use, since this evaporation would not take place without the human intervention of building a dam to store freshwater resources for different purposes, such as for withdrawal by one of the above sectors, for generating electricity (hydropower), etc.’
  • 23. The Science of Climate Change December 2022 23 of 31 13. Dams of the World and Paddy Fields https://www.worldatlas.com/articles/the-largest-man-made-lakes-in-the-world.html Human-made Lakes Some of the earliest dam reservoirs were constructed about 4000 years ago in Egypt, China, and Mesopotamia and their primary purposes were irrigation and supply of drinking water. Requirements may now include commercial fisheries, power generation, industrial and cooling water supplies, commercial sports, and other recreational activities. The Largest Man-made Lakes in the World. There were no large dams in the world before year 1900. The Hoover Dam was constructed on the Colorado River at latitude 36oN between 1930 and 1936. It is the highest concrete arch dam in the USA and impounds the Lake Mead reservoir, which extends for 115 miles (185 km) upstream. The Three Gorges Dam on the Yangtse River at 31oN in China was constructed over the years 1994 to 2012. It is 2,335 m (7,661 ft) long and the top of the dam is 185 m (607 ft) above sea level. The dam reservoir is on average about 660 km (410 mi) in length. It contains 39.3 km3 of water with total surface area of 1,045 km2 (403 sq mi). The Largest Man-Made Lakes In The World Rank Reservoir Volume km³ River Dam Country Year 1 Lake Kariba 180.6 Zambezi River Kariba Dam Zambia/Zimb. 1959 2 Bratsk Reservoir 169 Angara River Bratsk Dam Russia 1964 3 Lake Volta 150 Volta River Akosombo Dam Ghana 1965 4 Manicouagan Reservoir 141.8 Manicouagan River Daniel-Johnson Dam Canada 1968 5 Lake Guri 135 Caroní River Guri Dam Venezuela 1986 6 Lake Nasser 132 Nile River Aswan High Dam Egypt 1971 7 Williston Lake 74.3 Peace River W. A. C. Bennett Dam Canada 1967 8 Krasnoyarsk Reservoir 73.3 Yenisei River Krasnoyarsk Dam Russia 1967 9 Zeya Reservoir 68.4 Zeya River Zeya Hydroelectric Station Russia 1978 10 Robert-Bourassa Reservoir 61.7 La Grande River Robert-Bourassa gen. stn. Canada 1981 11 La Grande-3 Nord Reservoir 60 La Grande River La Grande-3 gen. stn. Canada 1981 12 Ust-Ilimsk Reservoir 59.3 Angara River Ust-Ilimsk Dam Russia 1977 13 Boguchany Reservoir 58.2 Angara River Boguchany Dam Russia 1989 14 Kuybyshev Reservoir 58 Volga River Zhiguli Hydroelectric Stn. Russia 1955 15 Cahora Bassa 55.8 Zambezi River Cahora Bassa Dam Mozambique 1974
  • 24. The Science of Climate Change December 2022 24 of 31 https://www.globaldamwatch.org/intelligence GDW intelligence (GDW-i) is a knowledge system providing live dam mapping, curation, research, analysis and visualisation tools for data on dams with greater than 15m height. It allows addition and editing of dam data by country and basin and also supports analysis, visualisation and download of data. GDW-i also provides a suite of analytical tools in support of policy and decision making. Scroll down to the message “Click the image below to enter GDW-i.” That gives access to the records of each country, see the examples below. United States of America - 60,344 registered dams on 10/Nov/2022. China – 15,742 registered dams. India - 9,872 registered dams.
  • 25. The Science of Climate Change December 2022 25 of 31 Brown Ocean Paddy Fields Many dam reservoirs provide water for growing rice. These scenes of water vapour over paddy fields are from Program 2 of the 3-program TV series by PBS/WGBH entitled: ‘H2O the Molecule that Made Us’. The commentator states: “China is the Water Kingdom. The molecule is at the heart of this entire civilisation.” During the program the commentator advises that “China has 87,000 dams and the USA has 84,000.” These quantities may include dams with less than 15m height, or they have not been registered with GDW
  • 26. The Science of Climate Change December 2022 26 of 31 14. Centre-pivot Irrigation Systems Centre-pivot irrigation systems were developed for use in the mid-west of the USA. They withdraw water by drilling wells into the Ogallala underground aquifer and use pumps to raise it to the surface. This method has been used in other arid areas such as Saudi Arabia and eastern Australia. Irrigation Circles near Imperial, Nebraska, USA, 40 N 102 W Image Date 09/2016 Saudi Arabia Wadi As Sirhan 30 deg N 38 deg E Image Date 12/2015
  • 27. The Science of Climate Change December 2022 27 of 31 11. Media Reports of World Crop Irrigation Since 1940, vast areas of normally uncultivated land have been converted to crop production to feed the ever-increasing world population. Atmospheric water vapour is increased by evaporation from damp soil, and mainly by transpiration from plant leaf stomata. New York Times Report on the ‘Irrigation Juggernaut’, September 2010, stated, quote: “Anyone who has flown over the American West on a clear day has probably noticed the enormous effect that irrigated farming has had on the landscape of the country. Fields of corn, potatoes and other crops can be seen dotting land that would otherwise be semi-desert, and the spray from some types of irrigation systems creates perfect circles of green in these parched landscapes.” The Guardian article, May 2012, entitled ‘Fresh water demand driving sea-level rise faster than glacier melt’ states, quote: “Trillions of tonnes of water have been pumped up from deep underground reservoirs in every part of the world.” The Physics Today article, November 2016, entitled ‘Land’s complex role in climate change’ states, quote: “The irrigation of semi-arid land can dramatically alter a region’s water balance. Due to the combined effects of evaporation and transpiration, collectively termed evapotranspiration, increases in ground moisture tend to raise humidity in the overlying atmosphere.” Rice paddies are particularly water-dependent. Each pound of rice takes about 300 gallons of water to produce. The 2021 TV Series ‘Age of Humans’ by the Smithsonian Channel advised, quote: “Rice paddies are the main source of nutrition for half the population of the planet.”
  • 28. The Science of Climate Change December 2022 28 of 31 12. Latent Heat of Evaporation (& Condensation) of Water used for World Irrigation Source: USGS/Salinity Management Organisation Image from www.shoalwater.nsw.gov.au The total vapour flow from irrigation is the combined quantity from soil and plant leaves called ‘evapotranspiration’. North Carolina State University explained, quote: “The Evaporation in evapotranspiration refers to water evaporated from over land. This includes evaporation from soil, wetlands, and standing water from places like roofs and puddles. It can also refer to direct evaporation of liquid water from the leaf surface of the plant. Transpiration happens when plants release water vapor from tiny holes, called stomata, in their leaves. This is caused in part by the chemical and biological changes that occur as the plant undergoes photosynthesis and converts carbon dioxide into oxygen. Plants transpire up to 99% of the water absorbed by their roots to cool down their leaves, thus performing the same function as a human sweating. The picture above shows the stomata on the underside of the leaf releasing water vapor (blue arrow) because of the warmth from the sun.” The total of water used for crop irrigation is approximately 3,000 billion tonnes p.a., see section 10. Around 90% of it is converted to 2,700 billion tonnes of water vapour by radiant heat from the sun. The energy required from the Sun per year to evaporate water on the ground and inside plant leaves for transpiration is therefore the weight of water transformed to vapour multiplied by the latent heat of evaporation, which is: 2,700 x 1012 kg x 2.260 x 106 J/kg = 6,102 exajoules/year. This quantity is more than 10 times the energy consumed for all other human activities, including domestic heating, industry and transport, as noted on page 3. Due to most crop irrigation being done in the Northern Hemisphere above latitude 20oN, around 90% of this total water vapour and associated latent heat energy is carried further North by atmospheric circulation in the Ferrel Cell. On reaching cooler altitudes or latitudes, the extra vapour from irrigation condenses to release its latent heat, leading to increased cloud formation, ~2,400 billion tonnes of extra Northern Hemisphere rain, more violent storms, reduced permafrost, and melting Arctic and Himalayan ice.
  • 29. The Science of Climate Change December 2022 29 of 31 Appendix - IPCC Reports on Atmospheric Water Vapour and associated Latent Heat. The Intergovernmental Panel on Climate Change (IPCC) Assessment Reports AR1, AR2 and AR3 have numerous sections on the effect of water vapour and associated latent heat, see below. The Summaries for Policymakers (SPMs) of these Reports, and those issued later, largely ignore these observations of increased water vapour and Northern Hemisphere precipitation. The SPMs concentrate on the ‘radiative forcing’ of other greenhouse gases (mainly carbon dioxide), and completely ignore the Southern Hemisphere observations described in Sections 6 to 8 above. IPCC AR1 1990 Policymakers Summary states: xxxviii (46) Water vapour, evaporated from the ocean surface, is transported by the atmospheric circulation and provides latent heat energy to the atmosphere. Chapter 1. Greenhouse Gases and Aerosols 7 (55) Tropospheric water vapour is the single most important greenhouse gas, but its atmospheric concentration is not significantly influenced by direct anthropogenic emissions (activities). Note: The IPCC chose to ignore the effect of 2,500 billion tonnes of crop irrigation water distributed over semi-arid and desert land in 1990. Chapter 7. Observed Climate Variation and Change 232 (280) 7.11.3 Tropical Cyclones Tropical cyclones derive their energy mainly from the latent heat contained in the water vapour evaporated from the oceans. Chapter 11. Narrowing the Uncertainties 320 (368) 11.2 3 Precipitation and Evaporation The condensation of water is the main energy source of the atmospheric heat engine and the transport of water vapour by the atmospheric circulation is a key process in the redistribution of the Sun’s energy in the Earth system. IPCC AR2 1995 Chapter 1. The Climate System: an overview 61 (page 75 of 588) 1.4.2 The Role of the Oceans Water vapour, evaporated from the ocean surface, provides latent heat energy to the atmosphere. Chapter 3. Observed Climate Variability and Change 161 (page 175 of 588) 3.3.7 Water Vapour Water vapour is the most abundant greenhouse gas and makes the largest contribution to the natural greenhouse effect. 163 (177) 3.3.9 Summary of Section 3,3. Precipitation has increased over land in high latitudes of the Northern Hemisphere, especially during the autumn.
  • 30. The Science of Climate Change December 2022 30 of 31 Chapter 4. Climate Processes 200 (214) 4.2.1 Water Vapour Amounts Since water vapour is the most important greenhouse gas, such increases in water vapour enhance the greenhouse effect; that is, they reduce the thermal infrared (long-wave) flux leaving the atmosphere- surface system, Chapter 6. Projections of Future Climate 332 (346) 6.5.4 Extreme Wind Events 6.5.4.1 Mid-latitude storms The main energy sources for mid-latitude depressions are the temperature contrast between the cold polar regions and the warmer sub-tropical conditions, and the release of latent heat as water vapour condenses in the warm, poleward moving, ascending air. Chapter 7. Change in Sea Level 379 (393) Ground water (underground aquifer) depletion. Ground water pumped at a rate in excess of recharge may add to sea level. Much of this water is used for irrigation and a major fraction is transpired or evaporated to the atmosphere or contributes to runoff, eventually reaching the sea. Chapter 8. Detection of Climate Change and Attribution of Causes 437 (451) 8.5.3 Diurnal Temperature Range (DTR) Several studies in Chapter 3 reported that, since the 1950s, minimum temperatures have increased two to three times faster than maximum temperatures over large areas of land in the Northern Hemisphere. The result is a reduction in DTR, especially during summer and autumn. Note: This is a result of spring and summer crop irrigation. IPCC AR3 2001 Technical Summary 30 (page 41 of 893) It is likely that total atmospheric water vapour has increased several per cent per decade over many regions of the Northern Hemisphere. A pattern of overall surface and lower-tropospheric water vapour increases over the past few decades is emerging from the most reliable data sets, although there are likely to be time-dependent biases in these data and regional variations in the trends. Water vapour in the lower stratosphere is also likely to have increased by about 10% per decade since the beginning of the observational record (1980). Note: No reference to the quantity of water used for crop irrigation. Northern Hemisphere sea-ice amounts are decreasing, but no significant trends in Antarctic sea-ice extent are apparent. New data indicate that there likely has been an approximately 40% decline in Arctic sea-ice thickness in late summer to early autumn between the period of 1958 to 1976 and the mid-1990s, and a substantially smaller decline in winter. 34 (45 of 893) The decrease in the continental diurnal temperature range coincides with increases in cloud amount, precipitation, and increases in total water vapour.
  • 31. The Science of Climate Change December 2022 31 of 31 The increases in total tropospheric water vapour in the last 25 years are qualitatively consistent with increases in tropospheric temperatures and an enhanced hydrologic cycle, resulting in more extreme and heavier precipitation events in many areas with increasing precipitation, e.g., middle and high latitudes of the Northern Hemisphere. Chapter 1: The Climate System: An Overview 88 (99) The most variable component of the atmosphere is water in its various phases such as vapour, cloud droplets, and ice crystals. Water vapour is the strongest greenhouse gas. For these reasons, and because the transition between the various phases absorbs and releases much energy, water vapour is central to the climate and its variability and change. 89 (100) As an example, the atmosphere and the oceans are strongly coupled and exchange, among others, water vapour and (latent) heat through evaporation. This is part of the hydrological cycle and leads to condensation, cloud formation, precipitation and runoff, and supplies energy to weather systems. Chapter 2: Observed Climate Variability and Change 101 (112) Over the last twenty-five years, it is likely that atmospheric water vapour has increased over the Northern Hemisphere in many regions. 103 (114) The more reliable data sets show that it is likely that total atmospheric water vapour has increased several per cent per decade over many regions of the Northern Hemisphere since the early 1970s. Changes over the Southern Hemisphere cannot yet be assessed. Note: The IPCC Reports failed to appreciate that the freshwater distributed for crop irrigation, at least 2,800 billion tonnes in year 2001, greatly increased the water vapour flux over North America and Asia. 146 (157) 2.5.3 Water Vapour 148 (159) The longer, more reliable data sets suggest multidecadal increases in atmospheric water vapour of several per cent per decade over regions of the Northern Hemisphere. 163 (174) The decrease in the continental diurnal temperature range since around 1950 coincides with increases in cloud amount and, at least since the mid-1970s in the Northern Hemisphere, increases in water vapour. 164 (175) The increases in lower-tropospheric water vapour and temperature since the mid-1970s are qualitatively consistent with an enhanced hydrological cycle. This is in turn consistent with a greater fraction of precipitation being delivered from extreme and heavy precipitation events, primarily in areas with increasing precipitation, e.g., mid- and high latitudes of the Northern Hemisphere. Chapter 11: Changes in Sea Level 657 (668) 11.2.5 Surface and Ground Water Storage and Permafrost Volumes of many of the world’s large lakes have been reduced in recent decades through increased irrigation and other water use. Sahagian et al. (1994) and Sahagian (2000) estimate that the reduced volumes of the Caspian and Aral Seas (and associated ground water) contribute 0.03 and 0.18 mm/year to sea level rise, on the assumption that the extracted water reaches the world’s ocean by evapotranspiration (followed by condensation and run off).