DSLR Image Quality Analysis using Minitab
•
4 gefällt mir•1,969 views

Today, photography has reached a level where basic digital cameras are being replaced by high end Digital SLR cameras. The experiment designed and executed will help the aspiring photographers and the general population that use these cameras, by giving them a brief idea & description about the various parameters that come under consideration while clicking photographs and also an overview of the outcomes.
![February 11, 2012 [DESIGN AND ANALYSIS OF EXPERIMENTS]
A n a l y s i s o f P h o t o g r a p h y u s i n g D S L R s Page 1
Table of Contents
Sr. No. Topic Page No.
1. Recognition and Statement of Problem
1.1 Introduction 5
1.2 DSLR Camera 6
1.3 The Experiment (Problem) 7
2. Choice of Factors, Levels & Ranges
2.1 Project Plan 8
2.2 Apparatus Specifications 9
2.3 Assumptions 10
2.4 Stating the Factors 11
3. Selection of the Response Variables
3.1 Image Quality 13
3.2 ISO Speed 13
3.3 Focal Length 13
4. Choice of Design
4.1 Experiment Design 14
5. Conducting the Experiment
5.1 Methodology 15
6. Statistical Analysis
6.1 Brief Notes on the Tests Conducted 20
6.2 Observations and Analysis
7 Drawing Conclusions & Recommendations
7.1 Conclusions 21
7.2 Recommendations 22
8. References 23](data:image/gif;base64,R0lGODlhAQABAIAAAAAAAP///yH5BAEAAAAALAAAAAABAAEAAAIBRAA7)
Empfohlen
Empfohlen
Weitere ähnliche Inhalte
Andere mochten auch
Andere mochten auch (14)
Ähnlich wie DSLR Image Quality Analysis using Minitab
Ähnlich wie DSLR Image Quality Analysis using Minitab (20)
Mehr von Karthik Murali
Mehr von Karthik Murali (11)
Kürzlich hochgeladen
Kürzlich hochgeladen (20)
DSLR Image Quality Analysis using Minitab
- 1. Design and Analysis of Experiments K a r t h i k M u r a l i A n a l y s i s o f P h o t o g r a p h y u s i n g D S L R s k a t t i c k @ g m a i l . c o m + 1 ( 7 1 3 ) - 5 9 1 - 0 8 9 6 2 / 1 1 / 2 0 1 2 A Project on Analysis of Photography using DSLRs Today, photography has reached a level where basic digital cameras are being replaced by high end Digital SLR cameras. This experiment will help the aspiring photographers and the general population that use these cameras, by giving them a brief idea & description about the various parameters that come under consideration while clicking photographs and also an overview of the outcomes.
- 2. February 11, 2012 [DESIGN AND ANALYSIS OF EXPERIMENTS] A n a l y s i s o f P h o t o g r a p h y u s i n g D S L R s Page 1 Table of Contents Sr. No. Topic Page No. 1. Recognition and Statement of Problem 1.1 Introduction 5 1.2 DSLR Camera 6 1.3 The Experiment (Problem) 7 2. Choice of Factors, Levels & Ranges 2.1 Project Plan 8 2.2 Apparatus Specifications 9 2.3 Assumptions 10 2.4 Stating the Factors 11 3. Selection of the Response Variables 3.1 Image Quality 13 3.2 ISO Speed 13 3.3 Focal Length 13 4. Choice of Design 4.1 Experiment Design 14 5. Conducting the Experiment 5.1 Methodology 15 6. Statistical Analysis 6.1 Brief Notes on the Tests Conducted 20 6.2 Observations and Analysis 7 Drawing Conclusions & Recommendations 7.1 Conclusions 21 7.2 Recommendations 22 8. References 23
- 3. February 11, 2012 [DESIGN AND ANALYSIS OF EXPERIMENTS] A n a l y s i s o f P h o t o g r a p h y u s i n g D S L R s Page 2 ABSTRACT Today, photography has reached a level wherein digital cameras have shrivelled and are being replaced by new and improved DSLR cameras. This experiment will help aspiring photographers and the general population that use such cameras by giving them a brief idea and description about the various parameters that come under consideration while clicking photographs and also a rough idea or perhaps, an overview about the different outcomes. In general usage, design of experiments (DOE) is the design of any information- gathering exercises where variation is present, whether under the full control of the experimenter or not. An experiment can be defined as a test or series of tests in which purposeful changes are made to the input variables of a process or system so that we may observe and identify the reasons for changes that may be observed in the output response. However, DOE plans for all possible dependencies in the first place, and then prescribes exactly what data are needed to assess them i.e. whether input variables change the response on their own, when combined, or not at all. In terms of resource the exact length and size of the experiment are set by the design (i.e. before testing begins). Experimentation plays an important role in technology commercialization, which consists of new innovative manufacturing process development, improvement of process and new design of products. Designs of experiments have a diversified application in non-manufacturing industries such as marketing, service operations, and general business operations. In this project we are focusing on experiments in engineering and sciences. A vital part of result-orientated scientific method is experimentation. When the scientific phenomena are understood clearly, the results can be directly used in development of mathematical models, which are also, generalized models for similar manufacturing systems. These models are called mechanistic models.
- 4. February 11, 2012 [DESIGN AND ANALYSIS OF EXPERIMENTS] A n a l y s i s o f P h o t o g r a p h y u s i n g D S L R s Page 3 BASIC PRINCIPLES in Design of Experiments 1. Randomization Random assignment is the process of assigning individuals at random to groups or to different groups in an experiment. The random assignment of individuals to groups (or conditions within a group) distinguishes a rigorous, ‘true’ experiment from an adequate, but less-than-rigorous, ‘Quasi Experiment’. It is the allocation of the experimental material as well as the order in which the individual runs or the trials of the experiment are to be performed are randomly determined. The averaging out of extraneous factors is also done by proper randomization. 2. Replication Measurements are usually subject to variation and uncertainty. Measurements are repeated and full experiments are replicated to help identify the sources of variation, to better estimate the true effects of treatments, to further strengthen the experiment's reliability and validity, and to add to the existing knowledge of about the topic. There are basically two properties of replications. Firstly, it gives a clear picture of where the error has taken place. Secondly, if the given sample mean reflects the true mean response of the experiment, replications will help the experimenter to get a more precise parametric analysis. 3. Blocking Blocking is the arrangement of experimental units into groups consisting of units that are similar to one another. Blocking reduces known but irrelevant sources of variation between units and thus allows greater precision in the estimation of the source of variation under study. The function of blocking is to reduce or eliminate the variability transmitted from nuisance factors. Nuisance factors are factors that affect the experiment but are not directly interested. 4. Hypothesis Testing There are two types namely a null hypothesis and alternative hypothesis used for comparing two conditions or treatments.
- 5. February 11, 2012 [DESIGN AND ANALYSIS OF EXPERIMENTS] A n a l y s i s o f P h o t o g r a p h y u s i n g D S L R s Page 4 5. Analysis of Variance (ANOVA) ANOVA is a collection of statistical models, and their associated procedures, in which the observed variance in a particular variable is partitioned into components attributable to different sources of variation. In its simplest form ANOVA provides a statistical test of whether or not the means of several groups are all equal, and therefore generalizes t-test to more than two groups. ANOVAs are useful in comparing two, three or more means. There are three classes of models namely fixed effect models, random effect models and mixed effect models. 6. Randomized Complete Block Design (RCBD) In order to make the experimental error as small as possible, that is we would like to remove the variability between coupon form the experimental error. RCBD would accomplish this by testing each tip once on each of the coupons. The following diagram shows the various phases that form the Six Sigma concept. Exhibit 1
- 6. February 11, 2012 [DESIGN AND ANALYSIS OF EXPERIMENTS] A n a l y s i s o f P h o t o g r a p h y u s i n g D S L R s Page 5 Transformation from Film Rolls to Advanced and Smaller Storage Devices There was a need for technological improvement High quality images now easily stored in high capacity memory cards 1. RECOGNITION and STATEMENT of PROBLEM 1.1 Introduction Photography is the art, science and practice of creating durable images by recording light or other electromagnetic radiation, either electronically by means of an image sensor or chemically by means of a light-sensitive material such as photographic film. Today, photography has reached a level wherein digital cameras have shrivelled and are being replaced by new and improved DSLR cameras. As we witness the progress in the technology related to photography, we know that now even the photographic film has become obsolete and has been replaced by various types of memory chips and cards. Initially, when we couldn’t figure out the size of an image and thereby guess its quality today with the help of high tech cameras and the computer, we can not only know the size of the image, but also extract important statistics related to the image. This experiment will help aspiring photographers and the general population that use such cameras by giving them a brief idea and description about the various parameters that come under consideration while clicking photographs and also a rough idea about the different outcomes. The basic purpose of the experiment is to show how tedious is it to retrieve data and thereby analyse the same. Review of the data can help us understand synchronization between the functions of a camera and external conditions to produce finished pictures. Exhibit 2
- 7. February 11, 2012 [DESIGN AND ANALYSIS OF EXPERIMENTS] A n a l y s i s o f P h o t o g r a p h y u s i n g D S L R s Page 6 1.2 DSLR Cameras Digital Single Lens Reflex cameras (Digital SLR or DSLR) are digital cameras that use a mechanical mirror system and pentaprism to direct light from the lens to an optical viewfinder on the back of the camera. Due to their reflex design system, DSLRs are often preferred by professional still photographers because they allow an accurate preview of framing close to the moment of exposure. Many professionals also prefer DSLRs for their larger sensors compared to most compact digital cameras. DSLRs have sensors which are generally closer in size to the traditional film formats that many current professionals started out using. These large sensors allow for similar depths of field and picture angle to film formats, as well as their comparatively high signal to noise ratio. DSLRs also allow the user to choose from a variety of interchangeable lenses. Most DSLRs also have a function that allows accurate preview of depth of field. The term DSLR generally refers to cameras that resemble 35 mm format cameras, although some medium format cameras are technically DSLRs. The reflex design scheme is a major difference between a DSLR and an ordinary digital point-and-shoot camera. In the reflex design scheme, the image captured on the camera's sensor is also the image that is seen through the view finder. Light travels through a single lens and a mirror is used to reflect a portion of that light through the view finder - hence the name Single Lens Reflex. While there are variations among point-and-shoot cameras, the typical design exposes the sensor constantly to the light projected by the lens, allowing the camera's screen to be used as an electronic viewfinder.
- 8. February 11, 2012 [DESIGN AND ANALYSIS OF EXPERIMENTS] A n a l y s i s o f P h o t o g r a p h y u s i n g D S L R s Page 7 Image Quality Variables Factors Responses 1.3 The Experiment (Problem) DSLR cameras sport a lot of high end features where the photographer (experimenter) has the flexibility to change the settings according to the surroundings and the need to get the most perfect picture possible. Here, we are trying to understand the various outcomes by changing certain values in the DSLR camera and analyse the output. There are a lot of factors that can be taken into consideration when we try to experiment something on an image through a DSLR. The responses would of course, be the image quality but there are secondary responses too, i.e. there would be other values that would exhibit a change as the responses are directly proportional to the factors. Nuisance factors also play an important role. The most important nuisance factors whilst clicking pictures with a Digital SLR camera would be the camera shake and the external light. Our experiment would help us understand how an image quality is affected by the mentioned factors and what the changes in the responses are therein. Exhibit 3
- 9. February 11, 2012 [DESIGN AND ANALYSIS OF EXPERIMENTS] A n a l y s i s o f P h o t o g r a p h y u s i n g D S L R s Page 8 Various factors taken into consideration for understanding and analyzing the image quality produced by a DIgital SLR Camera Factors like Aperture, Shutter Speed, TTL Metering, Flash Goal is to analyze the IMAGE QUALITY External Factors that affect the experiment i.e. the Final Image are camera shake and external light 2. CHOICE of FACTORS, LEVELS and RANGES 2.1 Project Plan The aim of our experiment is to understand and analyse the image quality of a Digital SLR using different functions and parameters using standard using standard outdoor conditions. The following is a smart art diagram that depicts the project plan. Exhibit 4
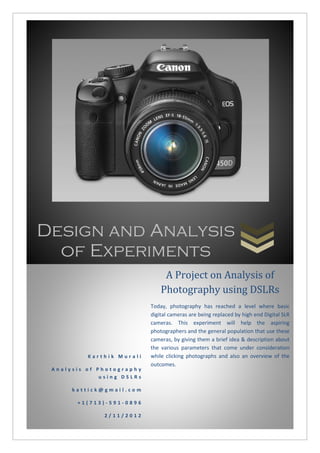
- 10. February 11, 2012 [DESIGN AND ANALYSIS OF EXPERIMENTS] A n a l y s i s o f P h o t o g r a p h y u s i n g D S L R s Page 9 2.2 Apparatus Specifications Camera Model Canon EOS 450D Aperture Support f/3.5 : f/5.6 CMOS Sensor 12.1 Effective Pixels Flash Built-in Focal Length 18mm – 55mm Lens Used Canon EF 18-55 mm USM II Max Shutter Speed 30 – 1/4000 sec Optics 11 Elements in 9 Groups The following pictures show the apparatus used in the experiment, The camera is a Canon made EOS series 450D and the lens used is the Kit Lens 18-55mm that comes with the camera in the package,
- 11. February 11, 2012 [DESIGN AND ANALYSIS OF EXPERIMENTS] A n a l y s i s o f P h o t o g r a p h y u s i n g D S L R s Page 10 2.3 Assumptions Our experiment will need a few assumptions to be listed down. The outdoor conditions are standard when clicking the pictures The lens used for clicking all the pictures is the same since a change in the lens will directly affect the values of our outcomes – as different lenses have different apertures and speeds Flash used for clicking the pictures is the built-in flash, however an external flash will be considered as a factor for analysing the difference in the image quality DSLR Cameras sport a variety of shutter speeds, we would be focusing on the focal plane shutter and the time control shutter speed functions only When Aperture is set to be constant – we vary the shutter speeds When Shutter Speed is set to be constant – we vary the Apertures The Exposure Control is set to be on auto mode ISO Speeds aren’t tampered as they are one of the responses for this experiment
- 12. February 11, 2012 [DESIGN AND ANALYSIS OF EXPERIMENTS] A n a l y s i s o f P h o t o g r a p h y u s i n g D S L R s Page 11 2.4 Stating the Factors As already mentioned, a DSLR camera gives the photographer full flexibility to get the maximum control of the situation and capture the moment with flawless effort. And these features are the factors for our experiment. The factors that we choose for this experiment are as follows, 1. Aperture A device that controls the amount of light admitted through an opening. In photography and digital photography, aperture is the unit of measurement that defines the size of the opening in the lens that can be adjusted to control the amount of light reaching the film or digital sensor. The size of the aperture is measured in F-stop. 2. Flash The extra amount of light thrown at the object to make it clearer by the camera’s processor is the flash. Flash can be internal (built-in) or an added extra to the camera i.e. external 3. Shutter Speed The shutter speed is the unit of measurement which determines how long shutter remains open as the picture is taken. The slower the shutter speed, the longer the exposure time. The shutter speed and aperture together control the total amount of light reaching the sensor. Shutter speeds are expressed in seconds or fractions of a second. For e.g. 2, 1, 1/2, 1/4, 1/8, 1/15, 1/30, 1/60, 1/125, 1/250, 1/500, 1/1000, 1/2000, 1/4000, 1/8000. Each speed increment halves the amount of light.
- 13. February 11, 2012 [DESIGN AND ANALYSIS OF EXPERIMENTS] A n a l y s i s o f P h o t o g r a p h y u s i n g D S L R s Page 12 4. Focal Length The focal length of a lens determines how much magnification it provides. A lens with a shorter focal length will be able to see a wider view of a subject than can a lens with a longer focal length, which would see a narrower view of the scene, but at a higher level of magnification. The image below shows the internal structure of the EOS 450D DSLR used in this experiment.
- 14. February 11, 2012 [DESIGN AND ANALYSIS OF EXPERIMENTS] A n a l y s i s o f P h o t o g r a p h y u s i n g D S L R s Page 13 3. SELECTION of The RESPONSE VARIABLES The following are the response variables selected for this experiment. 1. Image Quality Image quality is a characteristic of an image that measures the perceived image degradation. Assessment or subjective measure of how accurately or fully an image of a subject represents that subject. Image quality can also be understood by the size of the image. (i.e. the amount of space it takes on the storage media) The higher the image – the greater the number of pixels captures and vice versa. 2. ISO ISO measures the sensitivity of the image sensor. The lower the number, the less sensitive your camera is to light and the finer the grain. Higher ISO settings are generally used in darker situations to get faster shutter speeds (for example an indoor sports event when you want to freeze the action in lower light) – however the cost is noisier shots. The sensitivity of digital camera sensors are also rated using the ISO scale. The camera used in this experiment has an ISO range from ISO100 to ISO3200. The ISO is available to even 75000 in very high end camera models. 3. TTL Metering Through-the-lens (TTL) metering is a photographic term describing a feature of cameras capable of measuring light levels in a scene through their taking lenses, as opposed to a separate metering window. This information can then be used to select a proper exposure (average luminance), and control the amount of light emitted by a flash connected to the camera.
- 15. February 11, 2012 [DESIGN AND ANALYSIS OF EXPERIMENTS] A n a l y s i s o f P h o t o g r a p h y u s i n g D S L R s Page 14 4. CHOICE of DESIGN a. Experiment Design i. Initial Actions Steps Actions Performed 1 The object is selected. 2 The camera and the lens are set and proper light conditions are taken into consideration. 3 The aperture and the shutter speed are varied to get different qualities of images. 4 For each shutter speed, there would be four values of aperture. 5 For each setting, i.e. one shutter speed and one aperture value, 3 repetitions would be recorded. 6 The results will be tabulated for detailed observation and further analysis. ii. Test Plan Steps Tests 1 A Two-Way ANOVA to be performed considering the shutter speed and the aperture. 2 If the assumptions of the Two-Way ANOVA are violated, then the One-Way ANOVA will be performed where the Image Size (Quality) would be measured by each of the important factors – Shutter Speed and Aperture. 3 After the ANOVA analysis, if there still seems to be a few violations in the assumptions, then few non-parametric tests would be considered. 4 Tukey Test will be given priority for comparing the significant difference in the means. 5 A REGRESSION Test will also be counted to understand as to which of the factors would sport the most significant response.
- 16. February 11, 2012 [DESIGN AND ANALYSIS OF EXPERIMENTS] A n a l y s i s o f P h o t o g r a p h y u s i n g D S L R s Page 15 5. CONDUCTING the EXPERIMENT 5.1. Methodology The following is the first hand data – taking into account only the shutter speed and aperture variations, and recording the size of the image (size of the image is in megabytes). The first step of the experiment is conducted successfully. (Note: The repetitions have not been performed yet) With this raw data, we first perform a 2 Way ANOVA with the help of Minitab, and we see that the Shutter Speed stands out significant. The factor ‘Aperture’ does not display any significance at all. Shutter Aperture Image Size 0.02 3.5 2.57 0.02 4 2.98 0.02 4.8 3.12 0.02 5.6 1.99 0.04 3.5 3.96 0.04 4 4.2 0.04 4.8 3.25 0.04 5.6 3.99 0.01 3.5 1.98 0.01 4 2.24 0.01 4.8 2.96 0.01 5.6 3.15 0.25 3.5 4.97 0.25 4 3.49 0.25 4.8 2.98 0.25 5.6 4.56 Minitab Output Two-way ANOVA: Image Size versus Shutter, Aperture Source DF SS MS F P Shutter 3 6.8316 2.27721 4.56 0.033 Aperture 3 0.2882 0.09606 0.19 0.899 Error 9 4.4968 0.49965 Total 15 11.6166 S = 0.7069 R-Sq = 61.29% R-Sq(adj) = 35.48%
- 17. February 11, 2012 [DESIGN AND ANALYSIS OF EXPERIMENTS] A n a l y s i s o f P h o t o g r a p h y u s i n g D S L R s Page 16 In order to confirm that shutter speed is the significant factor amongst the two, we run a ONE WAY ANOVA Test with each of the factors against the response variable i.e. the Image Size. We get the following results when we run the test. We have reaffirmed that Shutter Speed of the camera is the most significant factor amongst the two that were taken into the consideration. Now let’s introduce one more factor into our experiment i.e. Focal Length of the lens. The lens that is used in our experiment has a focal length of 18-55 mm. Once we introduce the third factor into our experiment our model changes as we have 3 factors in total now. We would need to build a 23 Factorial Design Model. The following is the blueprint of our model, Factors Levels of the Factors Low High Aperture Setting f/3.5 f/5.6 Shutter Speed 0.01 sec 0.25 sec Focal Length 18 mm 55 mm Minitab Output One-way ANOVA: Image Size versus Shutter Source DF SS MS F P Shutter 3 6.832 2.277 5.71 0.012 Error 12 4.785 0.399 Total 15 11.617 S = 0.6315 R-Sq = 58.81% R-Sq(adj) = 48.51% Minitab Output One-way ANOVA: Image Size versus Aperture Source DF SS MS F P Aperture 3 0.288 0.096 0.10 0.957 Error 12 11.328 0.944 Total 15 11.617 S = 0.9716 R-Sq = 2.48% R-Sq(adj) = 0.00%
- 18. February 11, 2012 [DESIGN AND ANALYSIS OF EXPERIMENTS] A n a l y s i s o f P h o t o g r a p h y u s i n g D S L R s Page 17 For designing the 23 factorial, we execute the following steps in Minitab, i. Stat DOE Create Factorial Design ii. We use the default 2 Level Factorial (Default Generators) iii. The number of factors chosen is 3 iv. Designs Full Factorial Design v. We choose 2 replicates vi. We also state the factors and their levels vii. We do not randomize the runs After inserting the response values, we analyze the factorial design, the following were the results obtained, 6543210-1-2-3 99 95 90 80 70 60 50 40 30 20 10 5 1 Standardized Effect Percent A A perture B Shutter Speed C Focal Length Factor Name Not Significant Significant Effect Type ABC C Normal Plot of the Standardized Effects (response is Image Size, Alpha = 0.05) The above graph is a Normal Plot for the Standardized Effects for the Image Size with a confidence level of 95%. As we notice in the graph, we see that the focal length and the interaction amongst the three factors are the largest and the most significant factors that affect the image quality. In the previous tests, we saw that only the shutter speed was the significant factor but with the introduction of the new factor i.e. the focal length it grabs up all the importance. Let’s have a look at the Analysis of Variance of Image Size (coded units) table for a better grip of analysis,
- 19. February 11, 2012 [DESIGN AND ANALYSIS OF EXPERIMENTS] A n a l y s i s o f P h o t o g r a p h y u s i n g D S L R s Page 18 From the above table, we have a very clear indication that Focal Length and Aperture*Shutter Speed*Focal Length are the factors that affect the image size the most. We then run a Tukey’s Test to see the prominent comparison amongst the means of the factors involved in the experiment. Minitab Output Analysis of Variance for Image Size (coded units) Source DF Seq SS Adj SS Adj MS F Main Effects 3 6.8235 6.82352 2.27451 8.69 Aperture 1 0.0410 0.04101 0.04101 0.16 Shutter Speed 1 0.0095 0.00951 0.00951 0.04 Focal Length 1 6.7730 6.77301 6.77301 25.87 2-Way Interactions 3 1.0281 1.02807 0.34269 1.31 Aperture*Shutter Speed 1 0.2377 0.23766 0.23766 0.91 Aperture*Focal Length 1 0.1139 0.11391 0.11391 0.44 Shutter Speed*Focal Length 1 0.6765 0.67651 0.67651 2.58 3-Way Interactions 1 1.6706 1.67056 1.67056 6.38 Aperture*Shutter Speed*Focal Length 1 1.6706 1.67056 1.67056 6.38 Residual Error 8 2.0944 2.09445 0.26181 Pure Error 8 2.0944 2.09445 0.26181 Total 15 11.6166 Source P Main Effects 0.007 Aperture 0.703 Shutter Speed 0.854 Focal Length 0.001 2-Way Interactions 0.337 Aperture*Shutter Speed 0.369 Aperture*Focal Length 0.528 Shutter Speed*Focal Length 0.147 3-Way Interactions 0.035 Aperture*Shutter Speed*Focal Length 0.035 Residual Error Pure Error Total Tukey 95% Simultaneous Confidence Intervals All Pairwise Comparisons Individual confidence level = 98.06% Aperture subtracted from: Lower Center Upper --------+---------+---------+---------+- Shutter Speed -13.89 -4.42 5.05 (---*---) Focal Length 22.48 31.95 41.42 (---*---) --------+---------+---------+---------+- -25 0 25 50 Shutter Speed subtracted from: Lower Center Upper --------+---------+---------+---------+- Focal Length 26.90 36.37 45.84 (---*--) --------+---------+---------+---------+- -25 0 25 50
- 20. February 11, 2012 [DESIGN AND ANALYSIS OF EXPERIMENTS] A n a l y s i s o f P h o t o g r a p h y u s i n g D S L R s Page 19 As we analyze the Tukey Test results, we can clearly figure out that there is an eminent different between the Lower and the Upper limits of the Focal Length values. And the last non parametric test we run is the Regression Analysis. The following is the table generated in the Session of Minitab, There is a confirmation again, that the focal length is the most significant factor when the three factors are taken into consideration. It has also helped us to generate the Regression equation for this experiment. 1.00.50.0-0.5-1.0 99 95 90 80 70 60 50 40 30 20 10 5 1 Residual Percent Normal Probability Plot (response is Image Size) The normal probability plot for this experiment looks good. The points follow a normal pattern through the line giving no sign of suspicion or issues to be dealt with. Minitab Output Regression Analysis: Image Size versus Aperture, Shutter Speed, Focal Length The regression equation is Image Size = 1.80 + 0.048 Aperture - 0.20 Shutter Speed + 0.0352 Focal Length Predictor Coef SE Coef T P Constant 1.7977 0.7875 2.28 0.041 Aperture 0.0482 0.1505 0.32 0.754 Shutter Speed -0.203 1.317 -0.15 0.880 Focal Length 0.035169 0.008541 4.12 0.001 S = 0.631999 R-Sq = 58.7% R-Sq(adj) = 48.4%
- 21. February 11, 2012 [DESIGN AND ANALYSIS OF EXPERIMENTS] A n a l y s i s o f P h o t o g r a p h y u s i n g D S L R s Page 20 6. STATISTICAL ANALYSIS 6.1 Brief Notes on Tests Conducted Tests Explanation 1. Two Way ANOVA The 2 way ANOVA analysis was the first test used to understand the effect of Aperture and Shutter Speed on the image size. 2. One Way ANOVA The second test, this helped us to find out the one way effect of each of the factors on the response i.e. Image Size 3. Factorial Design Analysis After the introduction of the new factor – Focal Length, we had to build a 23 factorial design that constituted 2 replications. We used a full factorial design to find out individual significances and also the interactions amongst the factors. 4. Tukey’s Test We used some non-parametric tests to reassure our test results and support our analysis. Tukey’s test helped us to understand the difference between the limits of the factors. We have used a 95% confidence level when we ran the Tukey Test. 5. Regression Analysis The last test and one more, on the parametric tests list was the Regression Analysis to recheck our analysis till now. And this test has also helped us to generate the regression equation for our experiment and restating the significant factors – individual or the combination.
- 22. February 11, 2012 [DESIGN AND ANALYSIS OF EXPERIMENTS] A n a l y s i s o f P h o t o g r a p h y u s i n g D S L R s Page 21 6.2 Observations & Analysis The following are the observations and analysis from the experiment. i. When we run the Two-Way ANOVA Test, we inferred that Shutter Speed has a higher priority than the Aperture Settings of the camera. ii. To confirm the above results, we run the One-Way ANOVA and check for the factors individually against the response i.e. Image Size [Quality of the Image] and we find out that still, the Shutter Speed has a larger importance. iii. An inclusion of another factor – Focal Length is made in order to find out its effect on the image size and that led to a creation of a 23 factorial design which had 3 factors in all and 2 replicates. We then analyzed the factorial design, and we drew up the Effects Plot and the Normal Probability Plot. We found that the Focal Length was the largest factor that affected the experiment and the interactions of the three factors also showed up as a significant one. iv. To make sure that our analysis was correct and we on the right track, we conducted a Tukey Test with a 95% Confidence Interval and we found that the difference between the upper limits and the lower limits of the factors were large and of the same sign, so out Tukey Test was a successful one in guiding us for following the correct procedure. v. And lastly, we conducted a Regression Analysis, and we obtained the regression equation for our model and also reconfirmed that the factors are significant in the experiment.
- 23. February 11, 2012 [DESIGN AND ANALYSIS OF EXPERIMENTS] A n a l y s i s o f P h o t o g r a p h y u s i n g D S L R s Page 22 7. CONCLUSIONS & RECOMMENDATIONS Conclusions When we consider only the two factors shutter speed and the aperture, shutter speed stand outs between the two. But when focal length comes into the scenario, it becomes the most significant individual factor that affects the size of the image. The three factors together also, play an important role in affecting the quality of the image. The following are the facts that this experiment exhibits, Shutter Speed affects the size of the image as faster the speed, better the size of the image on the camera’s sensor When the three factors – Aperture, Shutter & Focal Length are considered together, Focal Length of the lens stands out the largest and then the interactions also play a significant role in the experiment The objects distance to the camera’s sensor plays a very vital role in determining the image size i.e. the quality of the image The shutter speed, the aperture and the distance of the object (all the three at a definite level) would give the best results After looking at the ANOVA table that Minitab has generated we can fit in a model for our experiment, Photography depends from person to person. So we can actually not recommend any settings for the image quality because the object would be different all the while. But after having a run through over the analysis that we just did for this experiment, we can say that having a medium aperture opening and a shutter speed of 1/50 or 1/100 seconds with a focal length to the minimum will produce a good quality image. And as a known fact, different lenses will have different apertures so the passage of light through the aperture to the sensor of the camera will be different. Image Size = 0.6506 Focal Length + 0.3231 Aperture*Shutter Speed*Focal Length
- 24. February 11, 2012 [DESIGN AND ANALYSIS OF EXPERIMENTS] A n a l y s i s o f P h o t o g r a p h y u s i n g D S L R s Page 23 8. REFERENCES Tables Table Reference No. Title Table 1 Content of the Project/Index Table 2 Apparatus Specifications used in the project Table 3 The Experiment Plan – Initial Design Table 4 Test Plan Table 5 Raw Data Tabulation Table 6 Experiment’s Factorial Layout Design Table 7 Brief Notes on the Tests Conducted Exhibits Sr. No. Title Exhibit 1 The Six Sigma Concept Exhibit 2 Revolution in the Storage Media for Camera Exhibit 3 Factors & The Image Quality Exhibit 4 SmartArt Diagram - Project Plan Exhibits 5 The images for the Cameras & Lenses Online References Website Links Read For www.wikipedia.org General Reading & Definitions www.dpreview.com Apparatus Specifications Information www.idigitalphoto.com Definitions & General Information www.imagingresource.com Working style of EOS www.digital-photography-school.com Famous blog for Photography www.dpchallenge.com Image Statistics and Analysis www.canon.com EOS Technology www.cameralabs.com Expert verdicts on Image Quality
- 25. February 11, 2012 [DESIGN AND ANALYSIS OF EXPERIMENTS] A n a l y s i s o f P h o t o g r a p h y u s i n g D S L R s Page 24 Text Books 1. Douglas. C. Montgomery, ‘Design and Analysis of Experiments [7th Edition]’, Wiley Publications, July 2008 2. G. Robin Henderson, ‘Six Sigma Quality Improvement with Minitab [2nd Edition], Wiley Publications, September 2011 Software Packages 1. Minitab 16 [Used for analyzing the data of the experiments. All the graphs and the Minitab Output tables have been generated by this software package] 2. Microsoft Word 2010 [Used for documenting the project] 3. Primo PDF Converter [Used for converting the word file into a PDF file] End of Report