SlideShare ist ein Scribd-Unternehmen logo
1 von 17
Mrs.P.Kalaiselvi, M.Sc.,,M.A.,
Ms.S.Swathi Sundari, M.Sc.,M.Phil.,
Assumptions :
1. The sample of paired data (x,y) is a
random sample.
2. The pairs of (x,y) data are normally
distributed.
 Measures the degree of linear association
between two scaled variables analysis of the
relationship between two quantitative outcomes,.
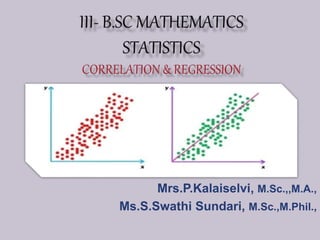
 Scatterplot (or scatter diagram)
is a graph in which the paired
(x,y) sample data are plotted with
a horizontal x axis and a vertical
y axis. Each individual (x,y) pair
is plotted as a single point.
 POSITIVE CORRELATION
Examples :
 Height and weight of a batch of students
 Income and expenditure of a family
 NEGATIVE CORRELATION
Examples :
 Price and demand
 Volume v and pressure p of a perfect gas
Scatter Diagram of Paired Data
Restaurant Bill (x) and Tip (y)
x x
yy y
x
Sample Scatter Plots showing various degrees of “positive”
correlation. That is, when x increases y also increases
(a) Positive (b) Strong
positive
(c) Perfect
positive
x x
yy y
x
(d) Negative (e) Strong
negative
(f) Perfect
negative
Sample Scatter Plots showing various degrees of
“negative” correlation. When x increases y decreases
x x
yy
(g) No Correlation (h) Nonlinear Correlation
Sample Scatter Plots showing NO linear correlation. The first plot (g)
has no correlation of any kind. The other plot (h) shows a clear
correlation between x and y, but the correlation is NOT LINEAR.
Nonlinear correlation can be studied, but it is beyond this class. We
will only study LINEAR CORRELATION.
 The correlation coefficient is independent of the
change of origin and scale.
 The values of the linear correlation coefficient are ALWAYS
between -1 and +1.
 If the correlation coefficient = 1 then the correlation
is perfect and positive.
 If the correlation coefficient = -1 then the correlation
is perfect and negative.
 If the correlation coefficient = 0 then the variables
are uncorrelated.
 If the variables x and y are uncorrelated then
Cov (x,y) = 0.
The Linear Correlation Coefficient r,
can be written as
  
       
2 22 2
n xy x y
r
n x x n y y


 
  
   
 Correlation coefficient is the geometric mean
between the regression coefficients.
 If one of the regression coefficient is greater than
unity the other is less than unity.
 Arithmetic mean of the regression coefficients is
greater than or equal to the correlation coefficient.
 Regression coefficients are independent of the
change of origin but dependent on change of scale.
Regression Line Plotted on Scatter Plot
The Regression Line is the line of “best fit”
through the data points. “Best fit” means the
sum of the vertical distances between each
data point and the regression line is
minimized.
 x is the independent variable (predictor
variable)
 y-hat is the dependent variable
(response variable)
0 1
ˆy b b x 
b0 is the y-
intercept or the
value at which
the regression
line crosses the
vertical axis
b1 is the slope of
the regression line
or the amount of
change in y for
every 1 unit change
in x
y-hat is the
“dependent” or
“response” variable
because it depends
on, or responds to
the value of x
x is the “independent”
or “predictor” variable
because it acts
independently to
predict the value of y-
hat
Statistics
Statistics

Weitere ähnliche Inhalte

Was ist angesagt?

Regression Analysis presentation by Al Arizmendez and Cathryn Lottier
Regression Analysis presentation by Al Arizmendez and Cathryn LottierRegression Analysis presentation by Al Arizmendez and Cathryn Lottier
Regression Analysis presentation by Al Arizmendez and Cathryn LottierAl Arizmendez
 
Regression analysis
Regression analysisRegression analysis
Regression analysisRavi shankar
 
Linear correlation
Linear correlationLinear correlation
Linear correlationTech_MX
 
Simple regression and correlation
Simple regression and correlationSimple regression and correlation
Simple regression and correlationMary Grace
 
Correlation analysis
Correlation analysis Correlation analysis
Correlation analysis Anil Pokhrel
 
Regression & correlation
Regression & correlationRegression & correlation
Regression & correlationAtiq Rehman
 
Correlation
CorrelationCorrelation
CorrelationTech_MX
 
Stats 3000 Week 2 - Winter 2011
Stats 3000 Week 2 - Winter 2011Stats 3000 Week 2 - Winter 2011
Stats 3000 Week 2 - Winter 2011Lauren Crosby
 
Linear regression
Linear regressionLinear regression
Linear regressionSreerajVA
 
Presentation on regression analysis
Presentation on regression analysisPresentation on regression analysis
Presentation on regression analysisSujeet Singh
 
Correlation
CorrelationCorrelation
Correlationancytd
 

Was ist angesagt? (18)

Regression Analysis presentation by Al Arizmendez and Cathryn Lottier
Regression Analysis presentation by Al Arizmendez and Cathryn LottierRegression Analysis presentation by Al Arizmendez and Cathryn Lottier
Regression Analysis presentation by Al Arizmendez and Cathryn Lottier
 
Scattergrams
ScattergramsScattergrams
Scattergrams
 
Regression analysis
Regression analysisRegression analysis
Regression analysis
 
Simple correlation
Simple correlationSimple correlation
Simple correlation
 
Linear correlation
Linear correlationLinear correlation
Linear correlation
 
Study of Correlation
Study of Correlation Study of Correlation
Study of Correlation
 
Simple regression and correlation
Simple regression and correlationSimple regression and correlation
Simple regression and correlation
 
Correlation
CorrelationCorrelation
Correlation
 
Correlation analysis
Correlation analysis Correlation analysis
Correlation analysis
 
Regression & correlation
Regression & correlationRegression & correlation
Regression & correlation
 
Correlation
CorrelationCorrelation
Correlation
 
Stats 3000 Week 2 - Winter 2011
Stats 3000 Week 2 - Winter 2011Stats 3000 Week 2 - Winter 2011
Stats 3000 Week 2 - Winter 2011
 
Correlation
Correlation Correlation
Correlation
 
Linear regression
Linear regressionLinear regression
Linear regression
 
Simple linear regression
Simple linear regressionSimple linear regression
Simple linear regression
 
Presentation on regression analysis
Presentation on regression analysisPresentation on regression analysis
Presentation on regression analysis
 
Regression
RegressionRegression
Regression
 
Correlation
CorrelationCorrelation
Correlation
 

Ähnlich wie Statistics

correlation and r3433333333333333333333333333333333333333333333333egratio111n...
correlation and r3433333333333333333333333333333333333333333333333egratio111n...correlation and r3433333333333333333333333333333333333333333333333egratio111n...
correlation and r3433333333333333333333333333333333333333333333333egratio111n...Ghaneshwer Jharbade
 
Sumit presentation
Sumit presentationSumit presentation
Sumit presentationSumit Bharti
 
Correlation and Regression
Correlation and RegressionCorrelation and Regression
Correlation and RegressionShubham Mehta
 
Correlation and regression impt
Correlation and regression imptCorrelation and regression impt
Correlation and regression imptfreelancer
 
TTests.ppt
TTests.pptTTests.ppt
TTests.pptMUzair21
 
SM_d89ccf05-7de1-4a30-a134-3143e9b3bf3f_38.pptx
SM_d89ccf05-7de1-4a30-a134-3143e9b3bf3f_38.pptxSM_d89ccf05-7de1-4a30-a134-3143e9b3bf3f_38.pptx
SM_d89ccf05-7de1-4a30-a134-3143e9b3bf3f_38.pptxManjulasingh17
 
Correlation engineering mathematics
Correlation  engineering mathematicsCorrelation  engineering mathematics
Correlation engineering mathematicsErSaurabh2
 
correlation.final.ppt (1).pptx
correlation.final.ppt (1).pptxcorrelation.final.ppt (1).pptx
correlation.final.ppt (1).pptxChieWoo1
 
Calculation of covariance and simple linear models
Calculation of covariance and simple linear models Calculation of covariance and simple linear models
Calculation of covariance and simple linear models Thendral Kumaresan
 
direct and inverse proportion
direct and inverse proportiondirect and inverse proportion
direct and inverse proportionSantosh Kumar
 

Ähnlich wie Statistics (20)

correlation and r3433333333333333333333333333333333333333333333333egratio111n...
correlation and r3433333333333333333333333333333333333333333333333egratio111n...correlation and r3433333333333333333333333333333333333333333333333egratio111n...
correlation and r3433333333333333333333333333333333333333333333333egratio111n...
 
Sumit presentation
Sumit presentationSumit presentation
Sumit presentation
 
Correlation and Regression
Correlation and RegressionCorrelation and Regression
Correlation and Regression
 
Chap04 01
Chap04 01Chap04 01
Chap04 01
 
Correlation and regression impt
Correlation and regression imptCorrelation and regression impt
Correlation and regression impt
 
Correlation and Regression
Correlation and RegressionCorrelation and Regression
Correlation and Regression
 
9. parametric regression
9. parametric regression9. parametric regression
9. parametric regression
 
Regression
RegressionRegression
Regression
 
Regression
RegressionRegression
Regression
 
Linear regression
Linear regressionLinear regression
Linear regression
 
TTests.ppt
TTests.pptTTests.ppt
TTests.ppt
 
Correlation and Regression
Correlation and Regression Correlation and Regression
Correlation and Regression
 
SM_d89ccf05-7de1-4a30-a134-3143e9b3bf3f_38.pptx
SM_d89ccf05-7de1-4a30-a134-3143e9b3bf3f_38.pptxSM_d89ccf05-7de1-4a30-a134-3143e9b3bf3f_38.pptx
SM_d89ccf05-7de1-4a30-a134-3143e9b3bf3f_38.pptx
 
Correlation engineering mathematics
Correlation  engineering mathematicsCorrelation  engineering mathematics
Correlation engineering mathematics
 
correlation.final.ppt (1).pptx
correlation.final.ppt (1).pptxcorrelation.final.ppt (1).pptx
correlation.final.ppt (1).pptx
 
Calculation of covariance and simple linear models
Calculation of covariance and simple linear models Calculation of covariance and simple linear models
Calculation of covariance and simple linear models
 
direct and inverse proportion
direct and inverse proportiondirect and inverse proportion
direct and inverse proportion
 
S1 pb
S1 pbS1 pb
S1 pb
 
Correlation
CorrelationCorrelation
Correlation
 
Correlation
CorrelationCorrelation
Correlation
 

Mehr von Kalaiselviprakash (7)

Integral calculus
Integral calculus Integral calculus
Integral calculus
 
Statics
Statics Statics
Statics
 
Real analysis
Real analysisReal analysis
Real analysis
 
Statics
Statics Statics
Statics
 
Real analysis
Real analysis Real analysis
Real analysis
 
Real analysis
Real analysis Real analysis
Real analysis
 
Statics
StaticsStatics
Statics
 

Kürzlich hochgeladen

Activity 01 - Artificial Culture (1).pdf
Activity 01 - Artificial Culture (1).pdfActivity 01 - Artificial Culture (1).pdf
Activity 01 - Artificial Culture (1).pdfciinovamais
 
Accessible design: Minimum effort, maximum impact
Accessible design: Minimum effort, maximum impactAccessible design: Minimum effort, maximum impact
Accessible design: Minimum effort, maximum impactdawncurless
 
CARE OF CHILD IN INCUBATOR..........pptx
CARE OF CHILD IN INCUBATOR..........pptxCARE OF CHILD IN INCUBATOR..........pptx
CARE OF CHILD IN INCUBATOR..........pptxGaneshChakor2
 
social pharmacy d-pharm 1st year by Pragati K. Mahajan
social pharmacy d-pharm 1st year by Pragati K. Mahajansocial pharmacy d-pharm 1st year by Pragati K. Mahajan
social pharmacy d-pharm 1st year by Pragati K. Mahajanpragatimahajan3
 
POINT- BIOCHEMISTRY SEM 2 ENZYMES UNIT 5.pptx
POINT- BIOCHEMISTRY SEM 2 ENZYMES UNIT 5.pptxPOINT- BIOCHEMISTRY SEM 2 ENZYMES UNIT 5.pptx
POINT- BIOCHEMISTRY SEM 2 ENZYMES UNIT 5.pptxSayali Powar
 
Paris 2024 Olympic Geographies - an activity
Paris 2024 Olympic Geographies - an activityParis 2024 Olympic Geographies - an activity
Paris 2024 Olympic Geographies - an activityGeoBlogs
 
Separation of Lanthanides/ Lanthanides and Actinides
Separation of Lanthanides/ Lanthanides and ActinidesSeparation of Lanthanides/ Lanthanides and Actinides
Separation of Lanthanides/ Lanthanides and ActinidesFatimaKhan178732
 
Z Score,T Score, Percential Rank and Box Plot Graph
Z Score,T Score, Percential Rank and Box Plot GraphZ Score,T Score, Percential Rank and Box Plot Graph
Z Score,T Score, Percential Rank and Box Plot GraphThiyagu K
 
Arihant handbook biology for class 11 .pdf
Arihant handbook biology for class 11 .pdfArihant handbook biology for class 11 .pdf
Arihant handbook biology for class 11 .pdfchloefrazer622
 
APM Welcome, APM North West Network Conference, Synergies Across Sectors
APM Welcome, APM North West Network Conference, Synergies Across SectorsAPM Welcome, APM North West Network Conference, Synergies Across Sectors
APM Welcome, APM North West Network Conference, Synergies Across SectorsAssociation for Project Management
 
Mastering the Unannounced Regulatory Inspection
Mastering the Unannounced Regulatory InspectionMastering the Unannounced Regulatory Inspection
Mastering the Unannounced Regulatory InspectionSafetyChain Software
 
9548086042 for call girls in Indira Nagar with room service
9548086042  for call girls in Indira Nagar  with room service9548086042  for call girls in Indira Nagar  with room service
9548086042 for call girls in Indira Nagar with room servicediscovermytutordmt
 
Sports & Fitness Value Added Course FY..
Sports & Fitness Value Added Course FY..Sports & Fitness Value Added Course FY..
Sports & Fitness Value Added Course FY..Disha Kariya
 
Advanced Views - Calendar View in Odoo 17
Advanced Views - Calendar View in Odoo 17Advanced Views - Calendar View in Odoo 17
Advanced Views - Calendar View in Odoo 17Celine George
 
BAG TECHNIQUE Bag technique-a tool making use of public health bag through wh...
BAG TECHNIQUE Bag technique-a tool making use of public health bag through wh...BAG TECHNIQUE Bag technique-a tool making use of public health bag through wh...
BAG TECHNIQUE Bag technique-a tool making use of public health bag through wh...Sapna Thakur
 
microwave assisted reaction. General introduction
microwave assisted reaction. General introductionmicrowave assisted reaction. General introduction
microwave assisted reaction. General introductionMaksud Ahmed
 
Sanyam Choudhary Chemistry practical.pdf
Sanyam Choudhary Chemistry practical.pdfSanyam Choudhary Chemistry practical.pdf
Sanyam Choudhary Chemistry practical.pdfsanyamsingh5019
 
1029-Danh muc Sach Giao Khoa khoi 6.pdf
1029-Danh muc Sach Giao Khoa khoi  6.pdf1029-Danh muc Sach Giao Khoa khoi  6.pdf
1029-Danh muc Sach Giao Khoa khoi 6.pdfQucHHunhnh
 
Measures of Dispersion and Variability: Range, QD, AD and SD
Measures of Dispersion and Variability: Range, QD, AD and SDMeasures of Dispersion and Variability: Range, QD, AD and SD
Measures of Dispersion and Variability: Range, QD, AD and SDThiyagu K
 

Kürzlich hochgeladen (20)

Activity 01 - Artificial Culture (1).pdf
Activity 01 - Artificial Culture (1).pdfActivity 01 - Artificial Culture (1).pdf
Activity 01 - Artificial Culture (1).pdf
 
Accessible design: Minimum effort, maximum impact
Accessible design: Minimum effort, maximum impactAccessible design: Minimum effort, maximum impact
Accessible design: Minimum effort, maximum impact
 
CARE OF CHILD IN INCUBATOR..........pptx
CARE OF CHILD IN INCUBATOR..........pptxCARE OF CHILD IN INCUBATOR..........pptx
CARE OF CHILD IN INCUBATOR..........pptx
 
social pharmacy d-pharm 1st year by Pragati K. Mahajan
social pharmacy d-pharm 1st year by Pragati K. Mahajansocial pharmacy d-pharm 1st year by Pragati K. Mahajan
social pharmacy d-pharm 1st year by Pragati K. Mahajan
 
POINT- BIOCHEMISTRY SEM 2 ENZYMES UNIT 5.pptx
POINT- BIOCHEMISTRY SEM 2 ENZYMES UNIT 5.pptxPOINT- BIOCHEMISTRY SEM 2 ENZYMES UNIT 5.pptx
POINT- BIOCHEMISTRY SEM 2 ENZYMES UNIT 5.pptx
 
Paris 2024 Olympic Geographies - an activity
Paris 2024 Olympic Geographies - an activityParis 2024 Olympic Geographies - an activity
Paris 2024 Olympic Geographies - an activity
 
Separation of Lanthanides/ Lanthanides and Actinides
Separation of Lanthanides/ Lanthanides and ActinidesSeparation of Lanthanides/ Lanthanides and Actinides
Separation of Lanthanides/ Lanthanides and Actinides
 
Z Score,T Score, Percential Rank and Box Plot Graph
Z Score,T Score, Percential Rank and Box Plot GraphZ Score,T Score, Percential Rank and Box Plot Graph
Z Score,T Score, Percential Rank and Box Plot Graph
 
Arihant handbook biology for class 11 .pdf
Arihant handbook biology for class 11 .pdfArihant handbook biology for class 11 .pdf
Arihant handbook biology for class 11 .pdf
 
APM Welcome, APM North West Network Conference, Synergies Across Sectors
APM Welcome, APM North West Network Conference, Synergies Across SectorsAPM Welcome, APM North West Network Conference, Synergies Across Sectors
APM Welcome, APM North West Network Conference, Synergies Across Sectors
 
Mastering the Unannounced Regulatory Inspection
Mastering the Unannounced Regulatory InspectionMastering the Unannounced Regulatory Inspection
Mastering the Unannounced Regulatory Inspection
 
9548086042 for call girls in Indira Nagar with room service
9548086042  for call girls in Indira Nagar  with room service9548086042  for call girls in Indira Nagar  with room service
9548086042 for call girls in Indira Nagar with room service
 
Sports & Fitness Value Added Course FY..
Sports & Fitness Value Added Course FY..Sports & Fitness Value Added Course FY..
Sports & Fitness Value Added Course FY..
 
Código Creativo y Arte de Software | Unidad 1
Código Creativo y Arte de Software | Unidad 1Código Creativo y Arte de Software | Unidad 1
Código Creativo y Arte de Software | Unidad 1
 
Advanced Views - Calendar View in Odoo 17
Advanced Views - Calendar View in Odoo 17Advanced Views - Calendar View in Odoo 17
Advanced Views - Calendar View in Odoo 17
 
BAG TECHNIQUE Bag technique-a tool making use of public health bag through wh...
BAG TECHNIQUE Bag technique-a tool making use of public health bag through wh...BAG TECHNIQUE Bag technique-a tool making use of public health bag through wh...
BAG TECHNIQUE Bag technique-a tool making use of public health bag through wh...
 
microwave assisted reaction. General introduction
microwave assisted reaction. General introductionmicrowave assisted reaction. General introduction
microwave assisted reaction. General introduction
 
Sanyam Choudhary Chemistry practical.pdf
Sanyam Choudhary Chemistry practical.pdfSanyam Choudhary Chemistry practical.pdf
Sanyam Choudhary Chemistry practical.pdf
 
1029-Danh muc Sach Giao Khoa khoi 6.pdf
1029-Danh muc Sach Giao Khoa khoi  6.pdf1029-Danh muc Sach Giao Khoa khoi  6.pdf
1029-Danh muc Sach Giao Khoa khoi 6.pdf
 
Measures of Dispersion and Variability: Range, QD, AD and SD
Measures of Dispersion and Variability: Range, QD, AD and SDMeasures of Dispersion and Variability: Range, QD, AD and SD
Measures of Dispersion and Variability: Range, QD, AD and SD
 

Statistics

  • 2. Assumptions : 1. The sample of paired data (x,y) is a random sample. 2. The pairs of (x,y) data are normally distributed.
  • 3.  Measures the degree of linear association between two scaled variables analysis of the relationship between two quantitative outcomes,.
  • 4.  Scatterplot (or scatter diagram) is a graph in which the paired (x,y) sample data are plotted with a horizontal x axis and a vertical y axis. Each individual (x,y) pair is plotted as a single point.
  • 5.  POSITIVE CORRELATION Examples :  Height and weight of a batch of students  Income and expenditure of a family  NEGATIVE CORRELATION Examples :  Price and demand  Volume v and pressure p of a perfect gas
  • 6. Scatter Diagram of Paired Data Restaurant Bill (x) and Tip (y)
  • 7. x x yy y x Sample Scatter Plots showing various degrees of “positive” correlation. That is, when x increases y also increases (a) Positive (b) Strong positive (c) Perfect positive
  • 8. x x yy y x (d) Negative (e) Strong negative (f) Perfect negative Sample Scatter Plots showing various degrees of “negative” correlation. When x increases y decreases
  • 9. x x yy (g) No Correlation (h) Nonlinear Correlation Sample Scatter Plots showing NO linear correlation. The first plot (g) has no correlation of any kind. The other plot (h) shows a clear correlation between x and y, but the correlation is NOT LINEAR. Nonlinear correlation can be studied, but it is beyond this class. We will only study LINEAR CORRELATION.
  • 10.  The correlation coefficient is independent of the change of origin and scale.  The values of the linear correlation coefficient are ALWAYS between -1 and +1.  If the correlation coefficient = 1 then the correlation is perfect and positive.  If the correlation coefficient = -1 then the correlation is perfect and negative.  If the correlation coefficient = 0 then the variables are uncorrelated.  If the variables x and y are uncorrelated then Cov (x,y) = 0.
  • 11. The Linear Correlation Coefficient r, can be written as            2 22 2 n xy x y r n x x n y y           
  • 12.
  • 13.  Correlation coefficient is the geometric mean between the regression coefficients.  If one of the regression coefficient is greater than unity the other is less than unity.  Arithmetic mean of the regression coefficients is greater than or equal to the correlation coefficient.  Regression coefficients are independent of the change of origin but dependent on change of scale.
  • 14. Regression Line Plotted on Scatter Plot The Regression Line is the line of “best fit” through the data points. “Best fit” means the sum of the vertical distances between each data point and the regression line is minimized.
  • 15.  x is the independent variable (predictor variable)  y-hat is the dependent variable (response variable) 0 1 ˆy b b x  b0 is the y- intercept or the value at which the regression line crosses the vertical axis b1 is the slope of the regression line or the amount of change in y for every 1 unit change in x y-hat is the “dependent” or “response” variable because it depends on, or responds to the value of x x is the “independent” or “predictor” variable because it acts independently to predict the value of y- hat