

Empfohlen
Empfohlen
Weitere ähnliche Inhalte
Was ist angesagt?
Was ist angesagt? (20)
Ähnlich wie Understanding the Effect of Medicaid Expansion Decisions in the South
Ähnlich wie Understanding the Effect of Medicaid Expansion Decisions in the South (20)
Mehr von KFF
Mehr von KFF (20)
Kürzlich hochgeladen
Kürzlich hochgeladen (20)
Understanding the Effect of Medicaid Expansion Decisions in the South
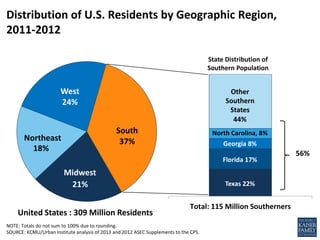
- 1. South 37% 21% 18% West 24% NOTE: Totals do not sum to 100% due to rounding. SOURCE: KCMU/Urban Institute analysis of 2013 and 2012 ASEC Supplements to the CPS. 44% Total: 115 Million Southerners Distribution of U.S. Residents by Geographic Region, 2011-2012 United States : 309 Million Residents 56% Texas 22% Florida 17% Georgia 8% North Carolina, 8% Midwest Northeast State Distribution of Southern Population Other Southern States
- 2. 66%* 66%* 59% 58% 22%* 20% 21% 20% 13%* 14%* 20%* 21% Northeast Midwest West South Uninsured Medicaid/Other Public Employer/Other Private NOTE: *The difference between this region and the South is significantly different at the 0.05 level for this percentage SOURCE: KCMU/Urban Institute analysis of 2013 and 2012 ASEC Supplements to the CPS. Health Insurance Coverage of the Nonelderly Population, by Geographic Region, 2011-2012 99.3 M56.6 M 63.7 M47.0 M Health Insurance Coverage of the Nonelderly Population, by Geographic Region, 2011-2012
- 3. 28% 28% 26% 25% 24% 24% 24% 24% 23% 23% 22% 22% 22% 21% 21% 20% 16% 15% LA MS AR DC SC AL GA KY TN TX WV FL NC OK US DE VA MD SOURCE: KCMU/Urban Institute analysis of 2013 and 2012 ASEC Supplements to the CPS. Poverty Rates Among Nonelderly Southerners, by State, 2011-2012 United States: 21% South: 22%
- 4. SOURCES: State decisions on the Medicaid expansion as of April 2014. Based on data from the Centers for Medicare and Medicaid Services, available at: http://medicaid.gov/AffordableCareAct/Medicaid-Moving-Forward-2014/Medicaid-and-CHIP-Eligibility- Levels/medicaid-chip-eligibility-levels.html with state updates. Status of Medicaid Expansion Decisions in the South as of April 2014 WV VA TX TN SCOK NC MS MD LA KY GA FL DC DE AR AL Implementing the Medicaid Expansion in 2014 (6 States, including DC) Not Moving Forward at this Time (11 States)
- 5. 319% 214% 138% 138% 266% 200% 138% 138% 253% 208% 119% 119% 215% 190% 52% 0% Children Pregnant Women Parents Childless Adults Northeast West Midwest South NOTE: Eligibility limits are for parents in a family of three and for individual adults. Limits include the standard five percentage point of FPL disregard. SOURCE: Based on data from the Centers for Medicare and Medicaid Services at Medicaid.gov Median Medicaid/CHIP Eligibility Limits as a Percent of the Federal Poverty Level, by Population Group and Geographic Region, January 2014
- 6. Texas 22% Florida 16% Georgia 8% NC 6% LA 5% SC 4% Other Southern States 16% Midwest 11% Northeast 6% West 4% NOTE: Excludes undocumented immigrants. Totals may not sum due to rounding. SOURCE: Kaiser Family Foundation analysis based on 2014 Medicaid eligibility levels and 2012-2013 Current Population Survey. Regional Distribution of Uninsured Adults in the Coverage Gap, 2014 Total: 4.8 Million Adults in the Coverage Gap South 79% (3.8 Million)
- 7. 51% 47% 56% 52% 54% Total Whites Blacks Hispanics People of Color NOTES: Excludes legal immigrants who have been in the country for five years or less and undocumented immigrants. SOURCE: Kaiser Family Foundation analysis based on 2014 Medicaid eligibility levels and 2012-2013 Current Population Survey. Share of Nonelderly Uninsured Adults Who Would be Eligible for the Medicaid Expansion but are in the Coverage Gap, by Race/Ethnicity, 2014 7.4 M 1.7 M2.1 M3.2 M 4.2 M Nonelderly Uninsured Southern Adults Who Would be Eligible for the Medicaid Expansion (<138% FPL)