The Role of Medicare Advantage - JAMA slideshow
•
1 gefällt mir•3,652 views

The Role of Medicare Advantage - JAMA slideshow

Empfohlen
Empfohlen
Weitere ähnliche Inhalte
Was ist angesagt?
Was ist angesagt? (19)
Andere mochten auch
Andere mochten auch (18)
Ähnlich wie The Role of Medicare Advantage - JAMA slideshow
Ähnlich wie The Role of Medicare Advantage - JAMA slideshow (20)
Mehr von KFF
Mehr von KFF (20)
Kürzlich hochgeladen
Kürzlich hochgeladen (20)
The Role of Medicare Advantage - JAMA slideshow
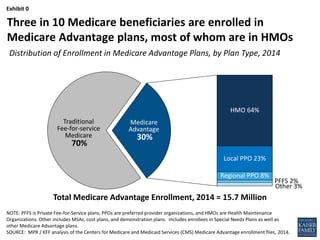
- 1. Exhibit 0 Traditional Fee-for-service Medicare 70% HMO 64% Local PPO 23% Regional PPO 8% PFFS 2% Other 3% Medicare Advantage 30% NOTE: PFFS is Private Fee-for-Service plans, PPOs are preferred provider organizations, and HMOs are Health Maintenance Organizations. Other includes MSAs, cost plans, and demonstration plans. Includes enrollees in Special Needs Plans as well as other Medicare Advantage plans. SOURCE: MPR / KFF analysis of the Centers for Medicare and Medicaid Services (CMS) Medicare Advantage enrollment files, 2014. Three in 10 Medicare beneficiaries are enrolled in Medicare Advantage plans, most of whom are in HMOs Total Medicare Advantage Enrollment, 2014 = 15.7 Million Distribution of Enrollment in Medicare Advantage Plans, by Plan Type, 2014
- 2. Exhibit 1 NOTE: Includes cost plans, MSAs, demonstrations, and Special Needs Plans, as well as other Medicare Advantage Plans. SOURCE: KFF analysis of the Centers for Medicare and Medicaid Services (CMS) Medicare Advantage enrollment files, 2005-2014, and Congressional Budget Office, “Medicare Baseline,” April 2014. Medicare Advantage enrollment has increased rapidly and is projected to continue to rise 25 24 23 22 22 21 20 19 18 17 15.7 14.4 13.1 11.9 11.1 10.5 9.7 8.4 6.8 5.6 2024 2023 2022 2021 2020 2019 2018 2017 2016 2015 2014 2013 2012 2011 2010 2009 2008 2007 2006 2005 Actual Enrollment Projected Enrollment Medicare Advantage Enrollment (in millions), 2005-2024
- 3. Exhibit 2 NOTE: Includes cost plans, MSAs, demonstrations, and Special Needs Plans, as well as other Medicare Advantage Plans. SOURCE: KFF analysis of the Centers for Medicare and Medicaid Services (CMS) Medicare Advantage enrollment files, 2014. The share of Medicare beneficiaries in Medicare Advantage plans varies greatly across the country U.S. Average Medicare Advantage Penetration= 30% Louisville, 27% Portland, 56% Idaho Falls, 21% Anchorage, 0% Los Angeles, 43% Topeka, 7% Austin, 23% Miami, 59% Milwaukee, 34% Baltimore, 10% Portland, 24% Tucson, 48% Manhattan, 32% Honolulu, 48% 0%-20% 21%-40% >41%
- 4. Exhibit 3 112% 112% 113% 114% 109% 110% 107% 104% 106% 101% 2006 2007 2008 2009 2010 2011 2012 2013 2014 2017 SOURCE: Medicare Payment Advisory Commission (MedPAC) Report to Congress, 2006-2014. Medicare has been paying more for beneficiaries in Medicare Advantage plans than for those in traditional Medicare Traditional Medicare Spending Actual Projected Average Medicare Advantage Payments as a Percentage of Traditional Medicare Spending
- 5. Exhibit 4 UnitedHealthCare 20% Humana 17% BCBS 17% Kaiser Permanente 8% Aetna 7% Cigna 3% Other national insurers 5% All other insurers 23% NOTE: Other includes firms with less than 3% of total enrollment. BCBS are BlueCross BlueShield affiliates and includes Wellpoint BCBS plans that comprise 4% of all enrollment (approximately 600,000 enrollees) in Medicare Advantage plans. Other national insurers includes approximately 428,000 enrollees across the following firms: Wellcare, HealthNet, Universal American, Munich American Holding Corporation, and Wellpoint non-BCBS plans . Accounts for merger between Coventry and Aetna in 2013; Medicare Advantage plans offered by Coventry covered 306,000 beneficiaries and Aetna plans covered 615,000 in 2013. Percentages may not sum to 100% due to rounding. SOURCE: MPR/Kaiser Family Foundation analysis of CMS Enrollment files, 2014. Medicare Advantage enrollment is concentrated within a small number of firms and affiliates, 2014 Total Medicare Advantage Enrollment, 2014 = 15.7 Million Kaiser Permanente 8% Aetna 7% Other National Insurers 5% Cigna 3%