

Empfohlen
Empfohlen
Weitere ähnliche Inhalte
Was ist angesagt?
Was ist angesagt? (20)
Ähnlich wie A Short Look at Long-Term Care For Seniors
Ähnlich wie A Short Look at Long-Term Care For Seniors (20)
Mehr von KFF
Mehr von KFF (20)
Kürzlich hochgeladen
Kürzlich hochgeladen (20)
A Short Look at Long-Term Care For Seniors
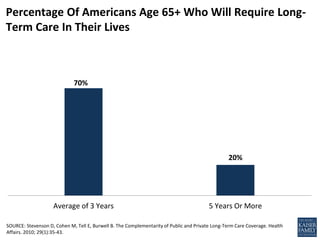
- 1. Average of 3 Years 5 Years Or More 20% 70% SOURCE: Stevenson D, Cohen M, Tell E, Burwell B. The Complementarity of Public and Private Long-Term Care Coverage. Health Affairs. 2010; 29(1):35-43. Percentage Of Americans Age 65+ Who Will Require Long- Term Care In Their Lives
- 2. Unpaid Caregivers Paid Long-Term Care Providers 87% 13% NOTES: Estimated annual value of unpaid care in 2009: $450 billion SOURCE: SCAN Foundation. Who Provides Long-Term Care in the U.S.? Oct 2012. http://www.thescanfoundation.org/sites/thescanfoundation.org/files/us_who_provides_ltc_us_oct_2012_fs_0.pdf Sources Of Care For 12 Million Americans Who Use Long- Term Care Services Types of Paid Long-Term Care Providers • 20-30% physicians, nurses, and therapists • 70-80% home health aides, certified nursing assistants and personal care aides
- 3. NOTE: Total LTSS expenditures include spending on residential care facilities, nursing homes, home health services, and home and community-based waiver services. Expenditures also include spending on ambulance providers. All home and community-based waiver services are attributed to Medicaid. SOURCE: KCMU estimates based on CMS National Health Expenditure Accounts data for 2011. Medicaid is the Primary Payer of Long-Term Care Medicaid 40% Out-of-Pocket 15% Private Insurance 7% Other Private and Public 18% Medicare Post-Acute Care 21% Total Long-Term Care Spending, 2011 = $357 billion
- 4. NOTE: Home and community-based care includes state plan home health, state plan personal care services and § 1915(c) HCBS waivers. Institutional care includes intermediate care facilities for individuals with intellectual/developmental disabilities, nursing facilities, and mental health facilities. SOURCE: KCMU and Urban Institute analysis of CMS-64 data. Growth in Medicaid Expenditures, 1995- 2011 1995 2000 2005 2010 2011 Home and Community- Based LTSS Institution-Based LTSS$54 $75 $104 $121 $123 30% 39% 45% 45% 80% 71% 61% 55% 55% 20%
- 5. 2010 2050 12 MILLION 27 MILLION* The number of Americans aged 65 years and older is growing dramatically. Between 2011 and 2029, 10 thousand Americans will turn 65 every day.1 SOURCE OF GRAPHIC: Kaye H, Harrington C, LaPlante M. Long-Term Care: Who Gets It, Who Provides It, Who Pays, And How Much? Health Affairs. January 2010 2010; 29(1):11-21. 1 PEW Research Center. 10,000 - Baby Boomers Retire. http://pewresearch.org/databank/dailynumber/?NumberID=1150. Accessed May 9, 2012. 2 Tompson T, Benz J, Agiesta D, Nguyen K, Lowell K. Long-Term Care: Perceptions, Experiences, and Attitudes among Americans 40 or Older. The Associated Press and NORC. April 2013. Number of Americans Needing Long-Term Care 48% of Americans 40 Years or Older Say that Almost Everyone Will Need Long- Term Care as They Age, but only 35% have set aside money2