Thai Market Rises as Risk Appetite Improves, Dollar Falls on Geopolitical Tensions
•
0 gefällt mir•270 views


Empfohlen
Weitere ähnliche Inhalte
Was ist angesagt?
Was ist angesagt? (18)
Andere mochten auch
Ähnlich wie Thai Market Rises as Risk Appetite Improves, Dollar Falls on Geopolitical Tensions
Ähnlich wie Thai Market Rises as Risk Appetite Improves, Dollar Falls on Geopolitical Tensions (20)
Mehr von KBank Fx Dealing Room
Mehr von KBank Fx Dealing Room (20)
Thai Market Rises as Risk Appetite Improves, Dollar Falls on Geopolitical Tensions
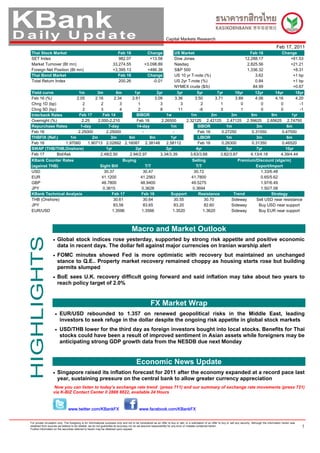
- 1. Capital Markets Research Feb 17, 2011 Thai Stock Market US Market Feb 16 Change Feb 16 Change SET Index Dow Jones 982.07 +13.58 12,288.17 +61.53 Market Turnover (Bt mn) 33,274.55 Nasdaq +3,098.89 2,825.56 +21.21 Foreign Net Position (Bt mn) +3,395.13 S&P 500 +486.38 1,336.32 +8.31 Thai Bond Market US 10 yr T-note (%) Feb 16 Change 3.62 +1 bp Total Return Index 200.26 US 2yr T-note (%) -0.01 0.84 +1 bp NYMEX crude ($/b) 84.99 +0.67 Yield curve 1m 3m 6m 1yr 2yr 3yr 5yr 7yr 10yr 12yr 14yr 18yr Feb 16 (%) 2.05 2.16 2.34 2.61 3.09 3.36 3.50 3.71 3.89 4.06 4.16 4.20 Chng 1D (bp) 2 2 3 1 3 3 2 1 0 0 0 -1 Chng 5D (bp) 2 3 4 2 8 11 -6 3 1 0 0 -1 Interbank Rates Feb 17 Feb 14 BIBOR 1w 1m 2m 3m 6m 9m 1yr Overnight (%) 2.25 2.000-2.210 Feb 16 2.26500 2.32125 2.42125 2.47125 2.59625 2.65625 2.74750 Repurchase Rates 1-day 7-day 14-day 1m SIBOR 1m 3m 6m Feb 16 2.25000 2.25000 - - Feb 16 0.27250 0.31550 0.47550 THBFIX (Ref.) 1m 2m 3m 6m 9m 1yr LIBOR 1m 3m 6m Feb 16 1.97060 1.90713 2.02892 2.16087 2.38148 2.58112 Feb 16 0.26300 0.31350 0.46520 SWAP (THB/THB,Onshore) 1yr 2yr 3yr 4yr 5yr 7yr 10yr Feb 17 Bid/Ask 2.48/2.50 2.94/2.97 3.34/3.39 3.63/3.68 3.82/3.87 4.13/4.18 4.39/4.44 KBank Counter Rates Buying Selling Premium/Discount (stgs/m) (against THB) Sight Bill T/T T/T Export/Import USD 30.37 30.47 30.72 1.33/6.48 EUR 41.1200 41.2563 41.7800 0.65/5.62 GBP 48.7800 48.9400 49.5275 1.97/6.49 JPY 0.3615 0.3628 0.3694 1.50/7.08 KBank Technical Analysis Feb 17 Feb 16 Support Resistance Trend Strategy THB (Onshore) 30.61 30.64 30.55 30.70 Sideway Sell USD near resistance JPY 83.56 83.65 83.20 82.60 Sideway Buy USD near support EUR/USD 1.3596 1.3566 1.3520 1.3620 Sideway Buy EUR near support Macro and Market Outlook • Global stock indices rose yesterday, supported by strong risk appetite and positive economic data in recent days. The dollar fell against major currencies on Iranian warship alert • FOMC minutes showed Fed is more optimistic with recovery but maintained an unchanged stance to Q.E.. Property market recovery remained choppy as housing starts rose but building permits slumped • BoE sees U.K. recovery difficult going forward and said inflation may take about two years to reach policy target of 2.0% FX Market Wrap • EUR/USD rebounded to 1.357 on renewed geopolitical risks in the Middle East, leading investors to seek refuge in the dollar despite the ongoing risk appetite in global stock markets • USD/THB lower for the third day as foreign investors bought into local stocks. Benefits for Thai stocks could have been a result of improved sentiment in Asian assets while foreigners may be anticipating strong GDP growth data from the NESDB due next Monday Economic News Update • Singapore raised its inflation forecast for 2011 after the economy expanded at a record pace last year, sustaining pressure on the central bank to allow greater currency appreciation Now you can listen to today’s exchange rate trend (press 711) and our summary of exchange rate movements (press 721) via K-BIZ Contact Center 0 2888 8822, available 24 Hours www.twitter.com/KBankFX www.facebook.com/KBankFX 1 For private circulation only. The foregoing is for informational purposes only and not to be considered as an offer to buy or sell, or a solicitation of an offer to buy or sell any security. Although the information herein was obtained from sources we believe to be reliable, we do not guarantee its accuracy nor do we assume responsibility for any error or mistake contained herein. Further information on the securities referred to herein may be obtained upon request.
- 2. KBank Daily Update Feb 17, 2011 Macro and Market Outlook US Treasuries and Thai rates Global stock indices rose yesterday, supported by strong Treasuries held losses from yesterday before a risk appetite and positive economic data in recent days. government report that economists said will show the cost The dollar fell against major currencies yesterday, of living in the U.S. climbed in January for a seventh month. however, as Israel said that two Iranian warships may be heading for the Suez Canal and Syria waters in an act Treasury yields are poised to rise, according to John deemed provocative. On top of the ongoing political Brynjolfsson, chief investment officer at Armored Wolf LLC protests in several Arab nations, the removal of U.S.- hedge fund. Labor Department figures will show the backed Hosni Mubarak may increase geopolitical risks in consumer price index advanced 0.3 percent in January, the region going forward. after December’s 0.4 percent gain, according to the median $/barrel forecast in a Bloomberg News survey of economists. 105 100 Ten-year notes yielded 3.62 percent as of 9:35 a.m. in 95 Tokyo, according to BGCantor Market Data. (Source: 90 Bloomberg) 85 S&P Index (bp) 80 75 1400 300 70 1350 280 65 1300 Jun-10 Jul-10 Aug-10 Sep-10 Oct-10 Nov-10 Dec-10 Jan-11 Feb-11 1250 260 1200 Arabian Gulf Dubai Fateh WTI oil price (RHS) Dated Brent 240 1150 1100 220 The BOE forecasts that inflation will accelerate from 1050 1000 200 January’s 4.0% and peak at 4.4% this year before easing Sep-10 Oct-10 Nov-10 Dec-10 Jan-11 Feb-11 to the target of 2% by the mid-2012. At the same time, U.K.’s growth outlook has worsened due to the weak S&P Index 2-10 Spread (bps, RHS) growth in Q4 and market’s expectations of higher borrowing costs going forward. Given these assumptions, BOE Governor, Mervyn King, also said that recovery is Thai interest rate: likely to be bumpy. The pound fell after the release of the forecasts, dropping more than 0.5 percent against the Bond yields were little changed despite the surge in dollar in London’s morning trade session. interest rate swaps and swap points. Investors’ demand continued to support a range trade in bonds, with long-term Data from the U.S. housing market remained rather mixed. investors’ demand flowing into short-term bonds due to Housing starts rose by more-than-expected at about 14% rather flat yield curve. Long-term yields remain rather in January but building permits fell 10.4%, indicating that unattractive as investors look for more liquidity premium, builders still have uncertain confidence about recovery of leading to rather low demand of the 30 year bond at the housing sector. yesterday’s auction. (B/C at 1.75 for a Bt5bn auction) units (saar) 1200 In the swap markets, inflation and profit-taking remained 1100 the key drivers of swap points. THBFIX 6m rate rose 22bp 1000 to above 2.16%, its highest level since April 2009. The 900 implied 1-year rate to borrow THB rose to 2.58%, about 800 2bp above the 1-year IRS rate and only 3bp from the 1- 700 year bond yield. 600 % IRS yield curve change bp 500 400 5.0 160 Jan-08 Jul-08 Jan-09 Jul-09 Jan-10 Jul-10 Jan-11 140 4.0 120 building permits ('000) housing starts ('000) 3.0 100 Meanwhile, the U.S. producer price index rose sharply in 80 2.0 60 January by 0.8% mom (3.6% yoy) but policymakers do not think that higher prices from energy and food price surge 40 1.0 would remain for long. In any case, the non-food and non- 20 0.0 0 energy price index also rose by 0.5% mom, exceeding 0.1 0.2 0.3 0.5 0.8 1.0 2.0 3.0 4.0 5.0 7.0 12.0 10.0 15.0 20.0 yrs forecast of 0.2% as analysts said that January is the month that businesses normally try to gauge their pricing power. Spread (left axis) 16-Feb-11 16-Jan-11 FOMC minutes from the previous meeting in January showed that Fed is more optimistic with regards to the recovery but maintained an unchanged stance to its Q.E. program. Labor market conditions remained unsatisfactory but the Fed forecasts that unemployment rate would reduce to around 8.8 – 9.0% in Q4. As for GDP growth this year, the Fed expects a higher range of 3.4-3.9% instead of the 3.0-3.6% range expected in December. 2 For private circulation only. The foregoing is for informational purposes only and not to be considered as an offer to buy or sell, or a solicitation of an offer to buy or sell any security. Although the information herein was obtained from sources we believe to be reliable, we do not guarantee its accuracy nor do we assume responsibility for any error or mistake contained herein. Further information on the securities referred to herein may be obtained upon request.
- 3. KBank Daily Update Feb 17, 2011 FX Wrap Currency Movement Wed 16-Feb-11 Tue 15-Feb-11 % Change 1.40 USD/THB 30.63 30.69 -0.20 1.38 USD/JPY 83.65 83.78 -0.16 1.36 EUR/USD 1.357 1.349 +0.58 1.34 GBP/USD 1.6092 1.6123 -0.19 1.32 USD/CHF 0.9589 0.9668 -0.82 1.30 USD/SGD 1.2787 1.2812 -0.20 1.28 USD/TWD 29.36 29.43 -0.24 1-Dec 11-Dec 21-Dec 31-Dec 10-Jan 20-Jan 30-Jan 9-Feb USD/KRW 1,116.0 1,121.3 -0.47 EUR/USD USD/PHP 43.59 43.62 -0.07 USD/IDR 8,876 8,900 -0.27 EUR/USD rebounded to 1.357 on renewed geopolitical risks in the Middle East, leading investors to seek refuge in USD/MYR 3.046 3.055 -0.29 the dollar despite the ongoing risk appetite in global stcok USD/CNY 6.588 6.589 -0.02 markets. Data from Europe was light yesterday but we look Source: Reuters forward to the euro zone trade balance today. USD/JPY .FX Consensus Forecast remained in range trade, edging down slightly to 83.65 as Spot Dec 2011 the dollar weakened broadly. USD/THB 30.61 29.00 38.50 80 USD/JPY 83.56 89.00 38.00 81 37.50 EUR/USD 1.36 1.33 37.00 82 GBP/USD 1.61 1.61 36.50 83 USD/CNY 6.58 6.30 36.00 84 USD/SGD 1.28 1.23 35.50 USD/IDR 8,881 8,800 35.00 85 1-Oct 1-Nov 1-Dec 1-Jan 1-Feb USD/MYR 3.04 2.96 JPY/THB (LHS) USD/JPY (RHS, inverted axis) USD/PHP 43.39 42.00 USD/KRW 1,115 1,050 USD/THB closed at 30.63, lower for the third day as USD/TWD 29.34 28.35 foreign investors bought into local stocks. Benefits for Thai AUD/USD 1.00 0.98 stocks could have been a result of improved sentiment in NZD/USD 0.76 0.75 Asian assets while foreigners may also be increasing THB Source: Bloomberg, KBank for USD/THB exposure in anticipation of strong GDP growth data from the NESDB due next Monday. In addition, expectation of Currency Pair Targets th policy rate hike on March 9 is also strong. Spot Dec 2011 Due to the recent surge in swap points, we expect that USD/THB 30.61 29.0 exporters would increase their volume of forward USD/THB EUR/THB 41.61 37.0 selling in the near term. Expectation of more USD selling JPY/THB 36.64 29.5 flows could lead the spot rate lower as well, if sentiments in the global markets remain supportive. GBP/THB 49.25 43.7 CNY/THB 4.65 4.2 118 29 117 AUD/THB 30.75 26.0 116 30 115 CHF/THB 31.95 27.7 114 31 Source: KBank, Bloomberg 113 112 32 111 KBank NEER Index 110 33 Current 98.14 109 108 34 YTD + 5.39% Nov -09 Feb-10 May -10 Aug-10 Nov -10 Feb-11 vs 52 weeks ago + 4.25% Asian dollar index USD/THB (right-axis-inverted) vs 1mth ago - 1.47% vs 1 week ago + 0.42% vs 1 day ago + 0.01% vs long term average + 10.33% Note: NEER is constructed from the weighted average of bilateral exchange rates of the baht via Thailand’s 21 major trading partners and trade competitors. An increase in NEER refers to an appreciation 3 For private circulation only. The foregoing is for informational purposes only and not to be considered as an offer to buy or sell, or a solicitation of an offer to buy or sell any security. Although the information herein was obtained from sources we believe to be reliable, we do not guarantee its accuracy nor do we assume responsibility for any error or mistake contained herein. Further information on the securities referred to herein may be obtained upon request.
- 4. KBank Daily Update Feb 17, 2011 Total Return Analysis – 3 month horizon, annualized Auction results of BoT and Government bonds Feb 16 Yield shift (bps) -40 -30 -20 -10 0 +10 +20 +30 +40 Bid- Tenor Amt. Accepted LB113A 2.04 2.08 2.12 2.15 2.19 2.23 2.27 2.31 2.09 Symbol Avg. Yield (%) coverage (yrs) (Bt mn) Range (%) ratio LB116A 2.64 2.56 2.49 2.41 2.34 2.27 2.19 2.12 1.79 LB416A 30.65 5,000 4.343/4.417 4.364700 1.75 LB11NA 3.54 3.29 3.04 2.79 2.55 2.30 2.05 1.80 1.31 CB11307A 0.04 95,000 2.070/2.120 2.104500 1.08 LB123A 4.16 3.81 3.46 3.11 2.76 2.41 2.06 1.71 1.11 Source: ThaiBMA LB12NA 5.31 4.72 4.12 3.53 2.94 2.35 1.76 1.17 0.32 LB133A 6.07 5.35 4.63 3.91 3.19 2.47 1.75 1.04 0.07 Auction Calendar of BoT Bonds LB137A 6.61 5.77 4.93 4.09 3.24 2.40 1.56 0.72 -0.37 Tenor Amt. Symbol Auction Date Maturity Date Remark LB13OA 7.03 6.09 5.15 4.22 3.28 2.34 1.41 0.47 -0.72 (yrs) (Bt mn) LB143A 7.43 6.43 5.43 4.43 3.43 2.42 1.42 0.42 -0.83 CB11307A 0.04 95,000 16-Feb-11 07-Mar-11 - LB145A 7.97 6.85 5.72 4.60 3.47 2.35 1.22 0.10 -1.28 CB11308A 0.04 80,000 17-Feb-11 08-Mar-11 - LB145B 7.97 6.84 5.72 4.59 3.47 2.34 1.22 0.09 -1.28 BOT152A 4.00 15,000 22-Feb-11 24-Feb-15 - LB14DA 8.76 7.45 6.14 4.83 3.52 2.20 0.89 -0.42 -1.98 CB11324C 0.08 25,000 22-Feb-11 24-Mar-11 - LB155A 9.51 8.02 6.52 5.02 3.52 2.02 0.52 -0.97 -2.72 CB11526B 0.25 12,000 22-Feb-11 26-May-11 - LB157A 9.37 7.91 6.45 4.99 3.53 2.07 0.61 -0.85 -2.56 - CB11825A 0.50 15,000 22-Feb-11 25-Aug-11 LB15DA 10.34 8.64 6.93 5.23 3.52 1.82 0.11 -1.59 -3.54 Source: ThaiBMA LB167A 10.96 9.12 7.29 5.46 3.63 1.79 -0.04 -1.87 -3.95 Auction Calendar of Government Bonds LB16NA 11.52 9.56 7.60 5.63 3.67 1.71 -0.25 -2.21 -4.42 LB171A 11.59 9.62 7.65 5.68 3.72 1.75 -0.22 -2.18 -4.40 Tenor Amt. Symbol Auction Date Maturity Date Remark (yrs) (Bt mn) LB175A 12.10 10.00 7.91 5.81 3.72 1.62 -0.47 -2.56 -4.90 LB25DA 15.05 8,000 23-Feb-11 12-Dec-25 - LB183A 13.19 10.83 8.48 6.12 3.77 1.41 -0.94 -3.29 -5.89 LB183B 12.88 10.60 8.32 6.04 3.76 1.48 -0.80 -3.08 -5.60 Source: ThaiBMA LB191A 13.86 11.34 8.82 6.30 3.79 1.27 -1.24 -3.76 -6.52 LB196A 14.80 12.04 9.29 6.54 3.78 1.03 -1.72 -4.47 -7.46 LB198A 14.59 11.90 9.21 6.52 3.82 1.13 -1.56 -4.24 -7.18 * Note that the MOF suspends auction of Treasury bills for two months LB19DA 14.89 12.14 9.38 6.63 3.88 1.12 -1.63 -4.38 -7.38 during January – February 2011. This is due to the large amount of Treasury LB213A 16.01 12.99 9.97 6.96 3.95 0.93 -2.08 -5.09 -8.35 cash balance. LB214A 15.91 12.94 9.96 6.99 4.01 1.04 -1.93 -4.90 -8.12 LB22NA 17.98 14.51 11.04 7.56 4.10 0.63 -2.84 -6.30 -10.01 LB233A 18.03 14.55 11.07 7.59 4.12 0.64 -2.83 -6.30 -10.02 LB236A 19.48 15.64 11.80 7.96 4.12 0.29 -3.54 -7.37 -11.45 LB244A 19.60 15.74 11.88 8.03 4.17 0.32 -3.53 -7.38 -11.47 LB24DA 20.22 16.21 12.21 8.21 4.21 0.22 -3.78 -7.77 -12.01 LB267A 20.71 16.58 12.46 8.34 4.22 0.10 -4.01 -8.12 -12.48 LB283A 21.95 17.52 13.09 8.67 4.25 -0.17 -4.59 -9.00 -13.66 LB296A 23.66 18.80 13.95 9.10 4.25 -0.59 -5.43 -10.27 -15.35 LB383A 27.89 21.99 16.11 10.22 4.34 -1.53 -7.40 -13.26 -19.37 LB396A 29.22 23.00 16.78 10.57 4.36 -1.84 -8.03 -14.22 -20.65 Average 12.97 10.63 8.30 5.97 3.64 1.31 -1.02 -3.35 -5.93 Source: KBank, Bloomberg KBank Rich – Cheap Model 30.00 20.00 10.00 0.00 -10.00 -20.00 -30.00 3 mth avg Now -40.00 LB296A LB113A LB116A LB11NA LB123A LB133A LB137A LB145B LB14DA LB155A LB15DA LB167A LB16NA LB175A LB183B LB191A LB196A LB198A LB19DA LB213A LB24DA LB267A LB283A LB396A Source: Bloomberg, KBank The 3-month average indicates the average differences between observed and derived yields 4 For private circulation only. The foregoing is for informational purposes only and not to be considered as an offer to buy or sell, or a solicitation of an offer to buy or sell any security. Although the information herein was obtained from sources we believe to be reliable, we do not guarantee its accuracy nor do we assume responsibility for any error or mistake contained herein. Further information on the securities referred to herein may be obtained upon request.
- 5. KBank Daily Update Feb 17, 2011 Economic News Update Singapore Raises 2011 Inflation Forecast After Record Expansion: Singapore raised its inflation forecast for 2011 after the economy expanded at a record pace last year, sustaining pressure on the central bank to allow greater currency appreciation. Consumer prices may climb 3 percent to 4 percent this year, up from a previous forecast of 2 percent to 3 percent, the trade ministry said in a statement today. Gross domestic product rose an annualized 3.9 percent in the three months to Dec. 31 from the previous quarter, when it contracted a revised 16.7 percent, it said. The economy expanded a revised 14.5 percent in 2010. Singapore’s growth is forecast to slow in 2011 to less than half of last year’s pace, when an economic rebound from the 2009 global recession prompted employers to boost wages and spurred property prices and tourist arrivals to unprecedented levels. Still, inflationary pressures may force the central bank to join other Asian policy makers in tightening monetary policy. “The economy should continue to fare well in coming quarters with services playing a key role,” Vishnu Varathan, an economist at Capital Economics (Asia) Pte in Singapore, said before the report. “The risk is that inflation could rise further to uncomfortably high levels in coming months. Policy settings will likely have to be tightened further to keep inflation under control.” Consumer prices may rise 5 percent to 6 percent in the first few months of 2011, the trade ministry said. “Thereafter, inflation should moderate, especially in the second half of the year,” it said. Inflation accelerated to 4.6 percent in December, the biggest increase in two years. The government kept this year’s economic growth forecast at 4 percent to 6 percent, the ministry said. The fourth quarter growth rate was revised from a Jan. 3 estimate of 6.9 percent and compares with the 5.3 percent median forecast of 14 economists surveyed by Bloomberg News. The Monetary Authority of Singapore, which uses the exchange rate as its main tool to manage inflation, revalued the currency in April 2010 and said in October it would steepen and widen the currency’s trading band while continuing to seek a “modest and gradual appreciation.” The stance is next scheduled for review in April. The Singapore dollar is the second-best performer in Asia excluding Japan in the past year, rising about 10 percent. The currency was little changed at S$1.2789 versus its U.S. counterpart at 7:51 a.m. today. The economy grew 12 percent in the fourth quarter from a year earlier, compared with the median estimate for a 12.1 percent gain in a Bloomberg News survey of 16 economists. (Source: Bloomberg) Market Strategists: Nalin Chutchotitham Email: nalin.c@kasikornbank.com Tel: 02-470-3235 5 For private circulation only. The foregoing is for informational purposes only and not to be considered as an offer to buy or sell, or a solicitation of an offer to buy or sell any security. Although the information herein was obtained from sources we believe to be reliable, we do not guarantee its accuracy nor do we assume responsibility for any error or mistake contained herein. Further information on the securities referred to herein may be obtained upon request.
- 6. KBank Daily Update Feb 17, 2011 Economic Calendar Date / Time Country Event Period Consensus Actual Prior Revised 02/16/2011 04:00 SK Export Price Index (MoM) JAN -- -0.90% 3.10% -- 02/16/2011 04:00 SK Export Price Index (YoY) JAN -- 4.90% 4.30% -- 02/16/2011 04:00 SK Import Price Index (MoM) JAN -- 0.00% 4.70% -- 02/16/2011 04:00 SK Import Price Index (YoY) JAN -- 14.10% 12.70% -- 02/16/2011 06:00 SK Unemployment Rate (SA) JAN 3.70% 3.60% 3.60% 3.50% 02/16/2011 06:30 AU Westpac Leading Index (MoM) DEC -- 0.80% 0.00% -- 02/16/2011 06:50 JN Tertiary Industry Index (MoM) DEC -0.60% -0.80% 0.60% 0.50% 02/16/2011 07:00 AU DEWR Skilled Vacancies MoM FEB -- -1.20% -4.60% -2.10% 02/16/2011 07:01 UK Nationwide Consumer Confidence JAN 50 47 53 54 02/16/2011 07:30 AU New Motor Vehicle Sales MoM JAN -- -1.90% 0.80% 1.00% 02/16/2011 07:30 AU New Motor Vehicle Sales YoY JAN -- -2.80% -3.10% -3.20% 02/16/2011 14:00 EC EU 25 New Car Registrations JAN -- -1.40% -3.20% -- 02/16/2011 16:30 UK Claimant Count Rate JAN 4.50% 4.50% 4.50% -- 02/16/2011 16:30 UK Jobless Claims Change JAN -3.0K 2.4K -4.1K -3.4K 02/16/2011 16:30 UK Average Weekly Earnings 3M/YoY DEC 2.00% 1.80% 2.10% -- 02/16/2011 16:30 UK Weekly Earnings exBonus 3M/YoY DEC 2.30% 2.30% 2.30% -- 02/16/2011 16:30 UK ILO Unemployment Rate (3mths) DEC 7.90% 7.90% 7.90% -- 02/16/2011 17:02 IT Current Account (mlns euro) DEC -- -5382M -5007M -- 02/16/2011 17:30 UK Bank of England Inflation Report 02/16/2011 17:32 VN Domestic Vehicle Sales (YoY) JAN -- 48.00% -17.10% -- 02/16/2011 19:00 US MBA Mortgage Applications Feb-11 -- -9.50% -5.50% -- 02/16/2011 20:30 CA Leading Indicators MoM JAN 0.40% 0.30% 0.50% 0.40% 02/16/2011 20:30 CA Int'l Securities Transactions DEC 9.000B 9.626B 8.005B 8.059B 02/16/2011 20:30 CA Manufacturing Sales MoM DEC 3.00% 0.40% -0.80% -0.60% 02/16/2011 20:30 US Housing Starts JAN 539K 596K 529K 520K 02/16/2011 20:30 US Building Permits JAN 559K 562K 635K 627K 02/16/2011 20:30 US Housing Starts MOM% JAN 1.90% 14.60% -4.30% -5.10% 02/16/2011 20:30 US Building Permits MOM% JAN -10.90% -10.40% 16.70% 15.30% 02/16/2011 20:30 US Producer Price Index (MoM) JAN 0.80% 0.80% 1.10% 0.90% 02/16/2011 20:30 US PPI Ex Food & Energy (MoM) JAN 0.20% 0.50% 0.20% -- 02/16/2011 20:30 US Producer Price Index (YoY) JAN 3.50% 3.60% 4.00% -- 02/16/2011 20:30 US PPI Ex Food & Energy (YoY) JAN 1.20% 1.60% 1.30% -- 02/16/2011 21:15 US Industrial Production JAN 0.50% -0.10% 0.80% 1.20% 02/16/2011 21:15 US Capacity Utilization JAN 76.30% 76.10% 76.00% 76.20% 02/17/2011 02:00 US Minutes of FOMC Meeting 02/17/2011 04:00 SK Department Store Sales YoY JAN -- 24.00% 11.60% -- 02/17/2011 04:00 SK Discount Store Sales YoY JAN -- 21.40% 2.90% -- 02/17/2011 07:00 SI GDP (QoQ) 4Q 5.30% 3.90% 6.90% -16.70% 02/17/2011 07:00 SI GDP (YoY) 4Q 12.10% 12.00% 12.50% 10.50% 02/17/2011 09:00 CH Actual FDI (YoY) JAN 17.20% 23.40% 15.60% -- 02/17/2011 12:00 JN Coincident Index CI DEC F -- -- 103.1 -- Source: Bloomberg 6 For private circulation only. The foregoing is for informational purposes only and not to be considered as an offer to buy or sell, or a solicitation of an offer to buy or sell any security. Although the information herein was obtained from sources we believe to be reliable, we do not guarantee its accuracy nor do we assume responsibility for any error or mistake contained herein. Further information on the securities referred to herein may be obtained upon request.