SlideShare ist ein Scribd-Unternehmen logo
1 von 2
NATIONAL                        RETAIL                       CLASSIFIED

   Year       Quarter        $ Millions      % Change      $ Millions       % Change      $ Millions       % Change
   2009         1             1,132.08        -25.87%       3,328.28         -23.68%       1,463.05         -42.34%
   2008                 1     1,527.16         -9.53%       4,360.96          -8.64%       2,537.37         -24.91%
                        2     1,583.70        -13.90%       4,740.03          -9.56%       2,501.34         -27.17%
                        3     1,362.59        -18.42%       4,467.55         -11.72%       2,362.45         -30.85%
                        4     1,522.49        -15.76%       5,200.03         -12.50%       2,573.86         -34.94%


Year                        $Mill            %Change      $Mill             %Change      $Mill             %Change
       2008                         $5,996       -14.4%           $18,769       -10.7%            $9,975        -29.7%
       2007                         $7,005        -6.7%           $21,018        -5.0%           $14,186        -16.5%
       2006                         $7,505        -5.1%           $22,121        -0.3%           $16,986         -1.9%
       2005                         $7,910        -2.2%           $22,187         0.8%           $17,312         4.2%
       2004                         $8,083         3.7%           $22,012         3.1%           $16,608         5.1%
       2003                         $7,797         8.1%           $21,341         1.7%           $15,801         -0.6%
TOTAL                          TOTAL                          TOTAL PRINT AND
  PRINT                          ONLINE                               ONLINE
 $ Millions        % Change     $ Millions       % Change     $ Millions  % Change
  5,923.41         -29.70%        696.31         -13.40%       6,619.72         -28.28%
  8,425.48         -14.38%        804.05          7.20%        9,229.53         -12.85%
  8,825.06         -16.07%        776.58          -2.40%       9,601.64         -15.11%
  8,192.59         -19.26%        749.84          -3.00%       8,942.43         -18.11%
  9,296.38         -20.59%        778.27          -8.10%       10,074.65        -19.74%


$Mill             %change      $Mill            %change      $Mill             %Change
        $34,740       -17.7%           $3,109        -1.8%           $37,848       -16.6%
        $42,209        -9.4%           $3,166        18.8%           $45,375        -7.9%
        $46,611        -1.7%           $2,664        31.5%           $49,275        -0.3%
        $47,408         1.5%           $2,027        31.5%           $49,435        2.5%
        $46,703         3.9%           $1,541        26.7%           $48,244        4.5%
        $44,939         1.9%           $1,216                        $46,156

Weitere ähnliche Inhalte

Was ist angesagt?

Merrill Lynch - Global Emerging Markets Forum (06 a 09-06-2006)*
Merrill Lynch - Global Emerging Markets Forum (06 a 09-06-2006)*Merrill Lynch - Global Emerging Markets Forum (06 a 09-06-2006)*
Merrill Lynch - Global Emerging Markets Forum (06 a 09-06-2006)*
CPFL RI
 
3.Jun2016San Mateo-SFRLogo
3.Jun2016San Mateo-SFRLogo3.Jun2016San Mateo-SFRLogo
3.Jun2016San Mateo-SFRLogo
Ray Jeter
 
Porcentaje de población
Porcentaje de poblaciónPorcentaje de población
Porcentaje de población
micaelavictoria
 
【(独)中小企業基盤整備機構】平成17年環境報告書
【(独)中小企業基盤整備機構】平成17年環境報告書【(独)中小企業基盤整備機構】平成17年環境報告書
【(独)中小企業基盤整備機構】平成17年環境報告書
env16
 

Was ist angesagt? (20)

McKonly & Asbury Webinar - 2014 Tax Update
McKonly & Asbury Webinar - 2014 Tax UpdateMcKonly & Asbury Webinar - 2014 Tax Update
McKonly & Asbury Webinar - 2014 Tax Update
 
Home Value State Rankings
Home Value State RankingsHome Value State Rankings
Home Value State Rankings
 
Merrill Lynch - Global Emerging Markets Forum (06 a 09-06-2006)*
Merrill Lynch - Global Emerging Markets Forum (06 a 09-06-2006)*Merrill Lynch - Global Emerging Markets Forum (06 a 09-06-2006)*
Merrill Lynch - Global Emerging Markets Forum (06 a 09-06-2006)*
 
Projected price v1
Projected price v1Projected price v1
Projected price v1
 
Projected price
Projected priceProjected price
Projected price
 
Copy of pickles
Copy of picklesCopy of pickles
Copy of pickles
 
JLL Great Lakes Scorecard
JLL Great Lakes ScorecardJLL Great Lakes Scorecard
JLL Great Lakes Scorecard
 
Sales team dashboard
Sales team dashboardSales team dashboard
Sales team dashboard
 
Attendance 11th sept 2015
Attendance 11th sept 2015Attendance 11th sept 2015
Attendance 11th sept 2015
 
3.Jun2016San Mateo-SFRLogo
3.Jun2016San Mateo-SFRLogo3.Jun2016San Mateo-SFRLogo
3.Jun2016San Mateo-SFRLogo
 
Research_MSc
Research_MScResearch_MSc
Research_MSc
 
Porcentaje de población
Porcentaje de poblaciónPorcentaje de población
Porcentaje de población
 
Tax Free Yields
Tax Free YieldsTax Free Yields
Tax Free Yields
 
World dairy-commodity-prices - Novembro 2017
World dairy-commodity-prices - Novembro 2017World dairy-commodity-prices - Novembro 2017
World dairy-commodity-prices - Novembro 2017
 
NEWMARKET Oct market report
NEWMARKET Oct market reportNEWMARKET Oct market report
NEWMARKET Oct market report
 
Australia's Population Map & Generational Profile
Australia's Population Map & Generational Profile Australia's Population Map & Generational Profile
Australia's Population Map & Generational Profile
 
Updated rate card trevon
Updated rate card trevonUpdated rate card trevon
Updated rate card trevon
 
Gsom1
Gsom1Gsom1
Gsom1
 
【(独)中小企業基盤整備機構】平成17年環境報告書
【(独)中小企業基盤整備機構】平成17年環境報告書【(独)中小企業基盤整備機構】平成17年環境報告書
【(独)中小企業基盤整備機構】平成17年環境報告書
 
Mortgage Brokers Association Data
Mortgage Brokers Association DataMortgage Brokers Association Data
Mortgage Brokers Association Data
 

Ähnlich wie Caída Publicidad EEUU 2009

2008 Annual Newspaper Ad Expenditures
2008 Annual Newspaper Ad Expenditures2008 Annual Newspaper Ad Expenditures
2008 Annual Newspaper Ad Expenditures
Juan Varela
 
whole food market fiveyeardata
whole food market  fiveyeardatawhole food market  fiveyeardata
whole food market fiveyeardata
finance44
 
Ltn200804281069 C
Ltn200804281069 CLtn200804281069 C
Ltn200804281069 C
guest54ca90
 
wyeth 3Q 2008 Net Revenue Report
wyeth 3Q 2008 Net Revenue Reportwyeth 3Q 2008 Net Revenue Report
wyeth 3Q 2008 Net Revenue Report
finance12
 

Ähnlich wie Caída Publicidad EEUU 2009 (20)

2008 Annual Newspaper Ad Expenditures
2008 Annual Newspaper Ad Expenditures2008 Annual Newspaper Ad Expenditures
2008 Annual Newspaper Ad Expenditures
 
Houston Market Report February 2010
Houston Market Report February 2010Houston Market Report February 2010
Houston Market Report February 2010
 
Houston Market Report August 2010
Houston Market Report August 2010Houston Market Report August 2010
Houston Market Report August 2010
 
Houston Market Report March 2010
Houston Market Report March 2010Houston Market Report March 2010
Houston Market Report March 2010
 
Houston Market Report July 2010
Houston Market Report July 2010Houston Market Report July 2010
Houston Market Report July 2010
 
Houston Market Report January 2010
Houston Market Report January 2010Houston Market Report January 2010
Houston Market Report January 2010
 
Houston Market Report April 2010
Houston Market Report April 2010Houston Market Report April 2010
Houston Market Report April 2010
 
Houston Market Report May 2010
Houston Market Report May 2010Houston Market Report May 2010
Houston Market Report May 2010
 
Houston Market Report June 2010
Houston Market Report June 2010Houston Market Report June 2010
Houston Market Report June 2010
 
whole food market fiveyeardata
whole food market  fiveyeardatawhole food market  fiveyeardata
whole food market fiveyeardata
 
Ltn200804281069 C
Ltn200804281069 CLtn200804281069 C
Ltn200804281069 C
 
Gta office market statistics q3 2011
Gta office market statistics q3 2011Gta office market statistics q3 2011
Gta office market statistics q3 2011
 
Dcf
DcfDcf
Dcf
 
Presentation 4Q09
Presentation 4Q09Presentation 4Q09
Presentation 4Q09
 
Boston Real Estate Report
Boston Real Estate ReportBoston Real Estate Report
Boston Real Estate Report
 
Ohl Apr Eng
Ohl Apr EngOhl Apr Eng
Ohl Apr Eng
 
Turkish consulate
Turkish consulateTurkish consulate
Turkish consulate
 
Gta office market statistics 2011 q2
Gta office market statistics 2011 q2Gta office market statistics 2011 q2
Gta office market statistics 2011 q2
 
wyeth 3Q 2008 Net Revenue Report
wyeth 3Q 2008 Net Revenue Reportwyeth 3Q 2008 Net Revenue Report
wyeth 3Q 2008 Net Revenue Report
 
May 2017 - Alberta Real Estate Benchmark and Economic Report
May 2017 - Alberta Real Estate Benchmark and Economic ReportMay 2017 - Alberta Real Estate Benchmark and Economic Report
May 2017 - Alberta Real Estate Benchmark and Economic Report
 

Mehr von Juan Varela (20)

Newsworks tablet gb 2012
Newsworks tablet gb 2012Newsworks tablet gb 2012
Newsworks tablet gb 2012
 
Vocento plan de eficiencia 2013
Vocento plan de eficiencia 2013Vocento plan de eficiencia 2013
Vocento plan de eficiencia 2013
 
Telefónica digital digital services
Telefónica digital digital servicesTelefónica digital digital services
Telefónica digital digital services
 
A3 9 m12
A3 9 m12A3 9 m12
A3 9 m12
 
Mediaset 9 m12
Mediaset 9 m12Mediaset 9 m12
Mediaset 9 m12
 
Abc economist mediareport-final
Abc economist mediareport-finalAbc economist mediareport-final
Abc economist mediareport-final
 
Antena3 la sexta_a_winning_combination_151211
Antena3 la sexta_a_winning_combination_151211Antena3 la sexta_a_winning_combination_151211
Antena3 la sexta_a_winning_combination_151211
 
London2011 tuenti
London2011 tuentiLondon2011 tuenti
London2011 tuenti
 
Un nuevo modelo de negocio
Un nuevo modelo de negocioUn nuevo modelo de negocio
Un nuevo modelo de negocio
 
Iab brasil conectado_consumodemedia
Iab brasil conectado_consumodemediaIab brasil conectado_consumodemedia
Iab brasil conectado_consumodemedia
 
Indicadores de-mercado-iab-brasil
Indicadores de-mercado-iab-brasilIndicadores de-mercado-iab-brasil
Indicadores de-mercado-iab-brasil
 
paywalls junio 2012
paywalls junio 2012paywalls junio 2012
paywalls junio 2012
 
Terra London 2011
Terra London 2011Terra London 2011
Terra London 2011
 
APM. TV Pública
APM. TV PúblicaAPM. TV Pública
APM. TV Pública
 
Economistcmr 0312
Economistcmr 0312Economistcmr 0312
Economistcmr 0312
 
Jwt generation z
Jwt generation zJwt generation z
Jwt generation z
 
Berria. medios contextuales pub
Berria. medios contextuales pubBerria. medios contextuales pub
Berria. medios contextuales pub
 
2012 lat am future in focus
2012 lat am future in focus2012 lat am future in focus
2012 lat am future in focus
 
Forta 2012
Forta 2012Forta 2012
Forta 2012
 
Axel springer fy 2011_final
Axel springer fy 2011_finalAxel springer fy 2011_final
Axel springer fy 2011_final
 

Caída Publicidad EEUU 2009

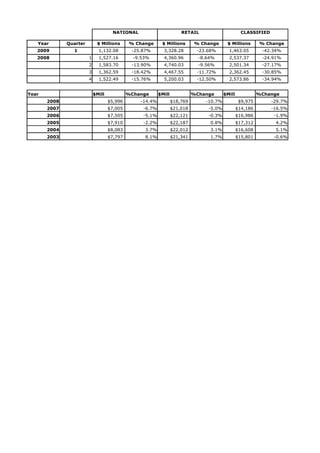
  • 1. NATIONAL RETAIL CLASSIFIED Year Quarter $ Millions % Change $ Millions % Change $ Millions % Change 2009 1 1,132.08 -25.87% 3,328.28 -23.68% 1,463.05 -42.34% 2008 1 1,527.16 -9.53% 4,360.96 -8.64% 2,537.37 -24.91% 2 1,583.70 -13.90% 4,740.03 -9.56% 2,501.34 -27.17% 3 1,362.59 -18.42% 4,467.55 -11.72% 2,362.45 -30.85% 4 1,522.49 -15.76% 5,200.03 -12.50% 2,573.86 -34.94% Year $Mill %Change $Mill %Change $Mill %Change 2008 $5,996 -14.4% $18,769 -10.7% $9,975 -29.7% 2007 $7,005 -6.7% $21,018 -5.0% $14,186 -16.5% 2006 $7,505 -5.1% $22,121 -0.3% $16,986 -1.9% 2005 $7,910 -2.2% $22,187 0.8% $17,312 4.2% 2004 $8,083 3.7% $22,012 3.1% $16,608 5.1% 2003 $7,797 8.1% $21,341 1.7% $15,801 -0.6%
  • 2. TOTAL TOTAL TOTAL PRINT AND PRINT ONLINE ONLINE $ Millions % Change $ Millions % Change $ Millions % Change 5,923.41 -29.70% 696.31 -13.40% 6,619.72 -28.28% 8,425.48 -14.38% 804.05 7.20% 9,229.53 -12.85% 8,825.06 -16.07% 776.58 -2.40% 9,601.64 -15.11% 8,192.59 -19.26% 749.84 -3.00% 8,942.43 -18.11% 9,296.38 -20.59% 778.27 -8.10% 10,074.65 -19.74% $Mill %change $Mill %change $Mill %Change $34,740 -17.7% $3,109 -1.8% $37,848 -16.6% $42,209 -9.4% $3,166 18.8% $45,375 -7.9% $46,611 -1.7% $2,664 31.5% $49,275 -0.3% $47,408 1.5% $2,027 31.5% $49,435 2.5% $46,703 3.9% $1,541 26.7% $48,244 4.5% $44,939 1.9% $1,216 $46,156